Climate resilient Coffee Beans Market Size and Share Forecast Outlook 2025 to 2035

The Climate resilient Coffee Beans Market is projected to record a valuation of USD 357.4 million in 2025 and USD 643.47 million in 2035, reflecting an increase of USD 286.07 million, equivalent to a growth of approximately 80% over the decade. This expansion corresponds to a CAGR of 6.1%, translating into a near 1.8X increase in Market size during the forecast period.
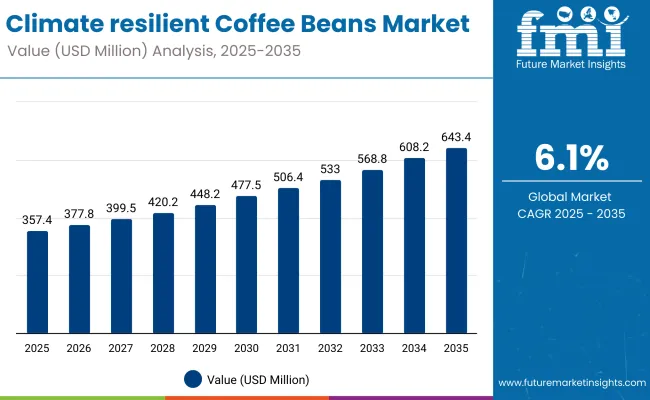
Quick stats for Climate resilient Coffee Beans Market (2025 to 2035)

  • Climate resilient Coffee Beans Market value (2025): USD 357.4 million
  • Climate resilient Coffee Beans Market forecast value (2035): UDS 643.4 million
  • Climate resilient Coffee Beans Market forecast cagr: 6.1%
  • Leading segment in Climate resilient Coffee Beans Market in 2025: arabica climate-resilient varieties (~xx%)
  • Key growth regions in the Climate resilient Coffee Beans Market: North America, Europe, South Asia & pacific
  • Top key players in Climate resilient Coffee Beans Market: Nestlé, Starbucks, JDE Peet’s, Lavazza, Olam, Ecom, Neumann KaffeeGruppe, Volcafe, Strauss Group, and illycaffè

Climate Resilient Coffee Bean Market

Climate resilient Coffee Beans Market Key Takeaways

Metric Value
Market Estimated Value in (2025E) USD 357.4 million
Market Forecast Value in (2035F) USD 643.4 million
Forecast CAGR (2025 to 2035) 6.1%

During the initial five-year phase from 2025 to 2030, the Market is expected to rise from USD 357.4 million to approximately USD 477.59 million, adding USD 120.19 million- accounting for about 42% of the total decade growth. This stage is anticipated to be characterized by steady institutional adoption, with climate-adapted Arabica and hybrid varieties securing procurement contracts from ESG-focused buyers. Regional demand will be led by North America and Europe, which together capture over half of global value, supported by resilient supply programs.

In the latter half from 2030 to 2035, an additional USD 165.88 million is forecast to be added, contributing to 58% of total growth as the Market advances from USD 477.59 million to USD 643.47 million. This acceleration will be powered by scaling agroforestry systems, genetic innovation, and resilience verification frameworks, which will broaden adoption among mainstream roasters and retail chains. Premiumization based on resilience credentials is expected to gain traction, while digital traceability and climate performance metrics will further reinforce buyer confidence and sustain upward price realization.

From 2020 to 2024, the Climate resilient Coffee Beans Market expanded steadily due to the rising emphasis on climate adaptation in agricultural supply chains. Industry adoption was driven by roasters and institutional buyers integrating resilience into sourcing criteria.

During this period, large-scale coffee traders and vertically integrated roasters held the dominant share, supported by long-term grower relationships and investment in agronomic programs. genetic innovation, agroforestry practices, and improved water management systems played a critical role in establishing Market credibility. Premium pricing was increasingly tied to verifiable climate performance, while uncertified bulks experienced stagnant value growth.

By 2025, demand is projected to reach USD 0.357 billion, with revenue mix gradually shifting toward differentiated, resilience-certified coffee in specialty and mainstream channels. competitive positioning is expected to move beyond bean quality alone toward end-to-end resilience verification, integrated traceability platforms, and digital Market place integration.

New entrants specializing in climate-data analytics, farm-level monitoring, and collaborative financing models are anticipated to capture growing interest from sustainability-driven buyers. Market leadership will depend on ecosystem collaboration, scalability of adaptation measures, and the ability to translate agronomic resilience into clear value propositions for both buyers and consumers.

Why is the Climate resilient Coffee Beans Market growing?

growth in the Climate resilient Coffee Beans Market is being driven by the increasing need to safeguard coffee production against the impacts of climate change. rising temperatures, erratic rainfall, and pest infestations have intensified pressure on growers, leading to greater adoption of resilient arabica, robusta, and hybrid varieties. investment in breeding programs, agroforestry systems, and soil health enhancements has been accelerated by both public and private stakeholders to ensure yield stability and quality preservation.

Procurement strategies by leading roasters and traders are being reshaped to prioritize climate adaptation credentials alongside traditional quality metrics. demand from specialty and mainstream segments is expected to rise as consumers become more aware of the environmental and social benefits linked to resilience-certified coffee. integration of digital traceability and climate performance verification into supply chains is anticipated to further strengthen Market adoption. Over the forecast period, the combination of agronomic innovation, sustainability mandates, and premium positioning is projected to sustain robust Market expansion.

Insights into the Variety Segment with Arabica Leading in Market Share

Variety Segment Market Value Share, 2025
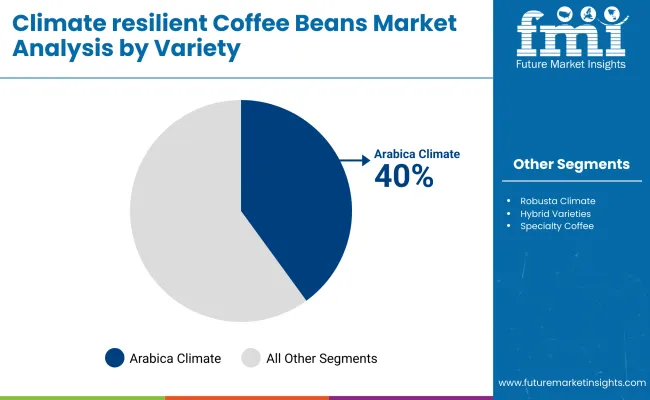
Climate Resilient Coffee Bean Market By Variety

Segment Share%
Arabica Climate-Resilient Varieties 40%
Robusta Climate-Resilient Varieties 25%
Hybrid Varieties (Arabica × Robusta) 20%
Specialty Coffee Climate-Resilient Varieties 15%

The arabica climate-resilient varieties segment is projected to command 40% of the Market value in 2025, driven by its premium quality perception and strong alignment with specialty coffee demand. Cultivation expansion is being promoted in both traditional and emerging regions, supported by breeding programs targeting drought tolerance and disease resistance. Institutional buyers and roasters are prioritizing these varieties for their balance of flavor complexity and climate resilience, ensuring continued relevance in global sourcing strategies.

As climate adaptation becomes a procurement norm, arabica’s share is expected to remain dominant, reinforced by innovation in cultivation techniques and expanding certified supply chains across multiple producing regions.

Insights into the Application Segment with Commercial Coffee Production at the Forefront

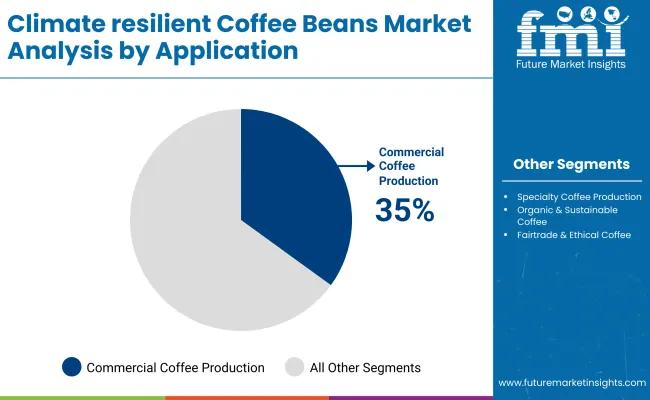
Application Segment Market Value Share, 2025

Segment Share%
Specialty Coffee Production 30%
Commercial Coffee Production 35%
Organic & Sustainable Coffee 20%
Fairtrade & Ethical Coffee 15%

Commercial coffee production is forecast to hold 35% of the Market share in 2025, reflecting steady demand from large-scale roasters and mainstream retail channels. Climate-resilient varieties are being integrated into conventional production systems to protect yields and maintain supply continuity under shifting climatic conditions.

Large-volume buyers are investing in agronomic support and resilience verification to secure compliance with sustainability policies. Over time, the segment is expected to benefit from increased adoption of hybrid and robusta variants, which enhances productivity while meeting flavor and quality thresholds for the commercial segment.

Insights into the Sales Channel Segment with Coffee Producers & Exporters Leading Distribution

Sales Channel Segment Market Value Share, 2025
Climate Resilient Coffee Bean Market By Application

Segment Share%
Coffee Producers & Exporters 35%
Specialty Coffee Retailers 20%
Modern trade 15%
Online Coffee Retail 20%
Food service & Hospitality 10%

Coffee producers and exporters are expected to account for 35% of the Market share in 2025, maintaining their central role in the value chain. This dominance is supported by their ability to aggregate climate-resilient varieties from diverse origins, meet quality and traceability requirements, and engage directly with both specialty and commercial buyers.

Strategic partnerships between exporters and global roasters are being strengthened to ensure year-round availability of resilience-certified lots. Investment in post-harvest infrastructure, quality control, and digital traceability platforms is anticipated to further consolidate this segment’s position. Over the decade, value creation is expected to be enhanced by premium pricing for verified climate-adapted supply.

What are the Drivers, Restraints, and Key Trends of the Climate resilient Coffee Beans Market?

Rising climate variability, volatile supply chains, and evolving sustainability mandates are reshaping procurement strategies in the Climate resilient Coffee Beans Market, even as demand expands across specialty, commercial, and ethical segments for verified, high-quality, and adaptation-ready coffee supply worldwide.

Expansion of Climate-Smart Agricultural PracticesThe Market is being propelled by the rapid scaling of climate-smart agricultural practices aimed at safeguarding yields and quality against temperature fluctuations, drought, and pest pressures. Governments, NGOs, and private-sector buyers have intensified funding and technical assistance for agroforestry systems, soil-microbiome enhancements, and water management innovations.

These measures are enabling farmers to stabilize output while meeting resilience verification standards demanded by global roasters and retailers. Direct trade relationships are increasingly structured to incentivize adoption, embedding adaptation criteria in long-term contracts. This alignment of policy, finance, and buyer requirements is projected to accelerate adoption rates through 2035, reinforcing climate resilience as both a risk mitigation and value creation pathway.

Limited Access to Certified Planting Material Market growth is being constrained by restricted access to certified climate-resilient seedlings and planting materials in key producing regions. Seed system bottlenecks, regulatory delays, and underdeveloped nursery infrastructure are slowing the scale-up of resilient varieties.

Smallholder farmers, who constitute most coffee producers, often face prohibitive costs and logistical barriers in sourcing high-quality inputs. Without adequate access, adoption timelines are prolonged, and supply consistency is challenged, particularly in regions most exposed to climate shocks. Unless these constraints are addressed through coordinated investment in seed multiplication and distribution networks, the Market ’s full potential may remain under-realized despite robust downstream demand.

Analysis of Climate resilient Coffee Beans Market by Key Countries

Countries CAGR (2025 to 2035)
China 5.09%
India 6.29%
Germany 5.24%
France 6.83%
UK 6.55%
USA 6.22%
Brazil 5.57%

The global Climate resilient Coffee Beans Market reflects clear regional divergence in adoption pace, shaped by consumption maturity, sourcing strategies, and climate adaptation urgency. North America is anticipated to lead in value share, supported by strong specialty coffee culture, high per capita consumption, and procurement frameworks embedding climate resilience criteria. Growth in this region is being reinforced by corporate ESG commitments and consumer readiness to pay premiums for verified sustainable supply.

Europe follows closely, with countries such as Germany, France, and the UK advancing resilience integration through fairtrade certification uptake, sustainability-driven retail policies, and traceable sourcing systems. In South Asia & Pacific, particularly in producing nations, growth is projected to accelerate as resilience programs are scaled through public-private partnerships and climate-smart farming incentives.

East Asia’s momentum is expected to be led by Japan and South Korea, where premium demand aligns with targeted sourcing of high-quality, adaptation-ready varieties. Latin America, despite its role as a major origin, shows lower value share due to a focus on volume exports; however, adoption is anticipated to strengthen as producers transition to certified resilient cultivars. The Middle East & Africa remains niche in value terms but is projected to expand through hospitality-driven specialty demand and premium café culture growth.

Sales Outlook for Climate resilient Coffee Beans Market in the United States

Year USA Climate Resilient Coffee bean Market (USD Million)
2025 85.78
2026 91.2
2027 96.6
2028 102.2
2029 107.4
2030 114.4
2031 122.3
2032 128.8
2033 137.0
2034 145.7
2035 155.4
Year CAGR (2025 to 2035)
2025 5.57%
2026 6.33%
2027 5.92%
2028 5.78%
2029 5.11%
2030 6.51%
2031 6.94%
2032 5.32%
2033 6.33%
2034 6.32%
2035 6.70%

The USA Climate resilient Coffee Beans Market is projected to increase from USD 350 million in 2025 to USD 779 million by 2035, advancing at a CAGR of 8.1% over the forecast period. Steady year-on-year growth is expected to be sustained, with Market revenues anticipated to surpass USD 500 million by 2030 and cross USD 750 million by 2035.

Growth is forecast to be driven by sustained investment in climate-smart agriculture, technological advancements in crop breeding, and heightened industry commitment to sustainable sourcing. The adoption of climate-resilient coffee varietals is anticipated to be accelerated by the growing need to mitigate risks from temperature fluctuations, pests, and unpredictable rainfall patterns.

Premiumization trends are projected to strengthen Market value, as specialty roasters and large beverage brands increasingly adopt climate-resilient beans to secure supply stability and align with ESG objectives. In parallel, rising consumer awareness of ethical and climate-conscious sourcing is expected to elevate demand for certified sustainable coffee products.

Institutional buyers, particularly within the hospitality and foodservice sectors, are forecast to expand procurement volumes to ensure consistency in flavor profiles amid changing climatic conditions. Furthermore, integrated value chain partnerships between coffee cooperatives, agritech firms, and exporters are expected to enhance production capacity and traceability.

  • Adoption of climate-resilient varietals in coffee-producing regions is expected to mitigate yield volatility.
  • Large beverage brands are projected to increase sourcing commitments to secure climate-proof supply chains.
  • Hospitality and food service sectors are anticipated to drive stable procurement volumes for quality consistency.

The sector’s expansion is forecast to be reinforced by advancements in agroforestry systems, wider availability of drought- and heat-tolerant cultivars, and supportive trade policies promoting sustainable coffee production.

Growth and Expansion Outlook for Climate resilient Coffee Beans Market in the United Kingdom

The UK Market is projected to record steady expansion through 2035, supported by high per capita coffee consumption and the growing influence of ethical sourcing on retail procurement. Retailers and hospitality chains are increasingly embedding resilience verification into supplier contracts, aligning with net-zero commitments. Specialty coffee culture continues to elevate demand for premium Arabica varieties adapted to climate risks. Government-backed sustainability programs and consumer demand for traceable products are expected to reinforce Market growth.

  • Retailers are prioritizing climate-resilient coffee in private-label and specialty ranges.
  • Hospitality operators are Making sustainability credentials as a differentiator.
  • Supply partnerships are integrating adaptation financing for producers.
  • Consumer awareness is boosting demand for certified premium offerings.

In-depth Analysis of Climate Resilient Coffee Beans in Europe

Countries / Subregion 2025
UK 20.84%
Germany 21.19%
Italy 10.39%
France 12.31%
Spain 9.87%
BENELUX 6.63%
Nordic 5.06%
Rest of Europe 14%
Total 100%
Countries / Subregion 2035
UK 18.52%
Germany 20.05%
Italy 9.17%
France 12.64%
Spain 11.77%
BENELUX 5.31%
Nordic 5.27%
Rest of Europe 17%
Total 100%

Growth and Expansion Outlook for Climate resilient Coffee Beans Market in India

The India Market is forecast to expand robustly as domestic consumption grows alongside sustained export demand for differentiated coffee. Production regions are increasingly investing in climate-smart practices to combat erratic monsoons and pest pressures. Specialty coffee adoption is rising in urban centers, while exporters are leveraging climate-resilient certifications to access premium international Markets. The government’s agricultural extension programs and private-sector partnerships are enabling greater farmer access to resilient planting material.

  • Exporters are targeting premium markets with certified climate-adapted varieties.
  • Urban coffee culture is boosting specialty and sustainable product demand.
  • On-farm adaptation practices are being scaled through training programs.
  • Value addition in processing is enhancing competitiveness in export markets.

Sales Outlook for Climate resilient Coffee Beans Market in China

Chinais anticipated to grow rapidly, driven by expanding café culture, e-commerce penetration, and a preference for premium, sustainable coffee among younger consumers. Imports of climate-resilient Arabica and hybrid varieties are increasing, supported by trade relationships with key producing countries. Domestic production in Yunnan is gradually integrating resilience-focused agronomy to secure consistent output. Digital retail channels are playing a pivotal role in consumer education and brand positioning.

  • E-commerce platforms are accelerating specialty and sustainable coffee sales.
  • Imports are diversifying to secure resilient, high-quality supply.
  • Yunnan producers are adopting agroforestry to manage climate risk.
  • Younger consumers are driving premiumization and sustainability demand.

In-depth Analysis of Climate resilient Coffee Beans Market in Germany

Germanyis set to maintain its position as one of Europe’s largest coffee importers, underpinned by strong demand for sustainable and traceable products. Roasters are embedding climate resilience criteria into procurement to ensure supply stability amid global climate challenges. Specialty coffee demand is reinforced by consumer preference for certified, origin-specific products. Policy alignment with EU Green Deal objectives is anticipated to encourage higher uptake of resilience-certified coffee.

  • Major roasters are leading in resilience-based procurement standards.
  • Specialty and organic coffee segments are expanding rapidly.
  • Policy frameworks are supporting sustainability-driven sourcing.
  • Consumer demand for traceability is influencing retail assortment strategies.

Growth Outlook for Climate resilient Coffee Beans Market in Japan

Japan Sales Channel 2025 Share%
Coffee Producers & Exporters 34%
Specialty Coffee Retailers 21%
Super Market s & Hyper Market s 15%
Online Coffee Retail 20%
Food service & Hospitality 10%
Total 100%
Japan Sales Channel CAGR (2025 to 2035)
Coffee Producers & Exporters 8.70%
Specialty Coffee Retailers 9.30%
Super Market s & Hyper Market s 8.80%
Online Coffee Retail 9.50%
Food service & Hospitality 9.00%

The Climate resilient Coffee Beans Market in Japan is projected at USD 25 million in 2025. Coffee producers and exporters contribute 34%, followed by specialty coffee retailers at 21%, showing a strong Market reliance on upstream sourcing and premium retail distribution. The online coffee retail segment, holding 20%, is gaining momentum due to the expansion of e-commerce and direct-to-consumer subscription models.

Growth is being reinforced by rising consumer demand for traceable, climate-adapted coffee and an increasing willingness to pay premiums for sustainability credentials. The food service and hospitality segment, with a 10% share, is integrating resilience-certified coffee into premium offerings, especially in boutique cafés and hotels. Over the forecast period, diversification across sales channels, enhanced digital traceability, and a sustained focus on quality are expected to define competitive advantages.

  • Japan’s Market holds a significant share in Asia-Pacific’s premium coffee demand.
  • Coffee producers and exporters lead with 34% share in 2025.
  • Online retail growth is driven by subscription models and premium offerings.
  • Specialty retailers leverage sustainability as a competitive differentiator.

Opportunity Analysis of South Korea Climate resilient Coffee Beans Market

S Korea Coffee Variety 2025 Share%
Arabica Climate Resilient Varieties 39%
Robusta Climate Resilient Varieties 24%
Hybrid Varieties (Arabica × Robusta) 22%
Specialty Coffee Climate Resilient Varieties 15%
Total 100%
S Korea Coffee Variety CAGR (2025 to 2035)
Arabica Climate Resilient Varieties 8.80%
Robusta Climate Resilient Varieties 8.90%
Hybrid Varieties (Arabica × Robusta) 9.20%
Specialty Coffee Climate Resilient Varieties 9.40%

The Climate resilient Coffee Beans Market in South Korea is projected at USD 15 million in 2025. Arabica climate-resilient varieties contribute the largest share at 39%, reflecting their dominance in specialty and premium café segments. Robusta and hybrid varieties collectively account for 46%, indicating rising interest in diversification for yield stability and supply security.

Specialty coffee-resilient varieties, with a 15% share, are expanding through boutique roasters and hospitality channels targeting niche, high-value consumers. Growth is expected to be reinforced by South Korea’s sophisticated coffee culture, high café density, and growing consumer awareness of sustainability credentials. Partnerships between importers, roasters, and original suppliers are expected to integrate climate resilience into sourcing portfolios over the next decade.
  • Arabica maintains dominance in premium segments with 39% share in 2025.
  • Hybrid and robusta adoption support resilience and yield optimization.
  • Specialty segment growth is driven by boutique and artisanal channels.
  • Consumer preference for sustainability and quality fuels premiumization trends.

Competitive Landscape of Berberine Market

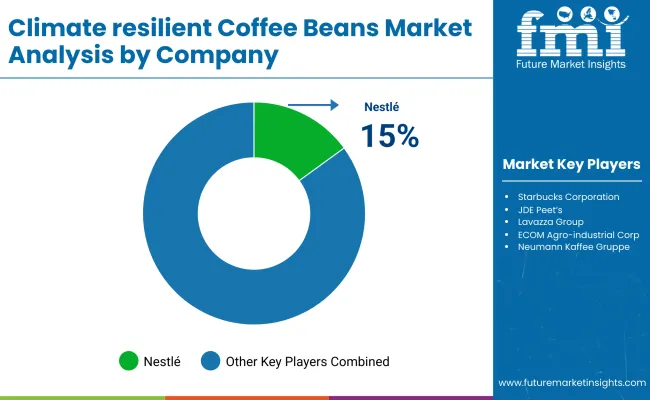
Climate Resilient Coffee Bean Market By Company

The Climate resilient Coffee Beans Market is moderately fragmented, with a mix of global commodity traders, vertically integrated roasters, and specialized sustainability-focused suppliers competing for Market share. Global leaders such as Nestlé S.A., Starbucks Corporation, and JDE Peet’s hold significant positions, driven by extensive procurement networks, early integration of climate resilience criteria, and direct engagement with producers at origin. Their strategies emphasize investment in climate-smart agriculture, resilience certification programs, and digital traceability platforms to secure long-term supply stability.

Established mid-sized players, including Lavazza Group, Olam International, and ECOM Agro-industrial Corp., cater to both specialty and commercial segments by leveraging strong origin presence, hybrid variety adoption, and targeted agronomic support. These companies are advancing Market reach through partnerships with NGOs, research institutes, and local cooperatives to expand farmer access to certified resilient planting material.

Specialized suppliers such as Neumann KaffeeGruppe, Volcafe Ltd., Strauss Group, and Illycaffè focus on premium, high-quality lots with climate adaptation as a value differentiator. Their competitive advantage is built on origin-specific expertise, direct trade models, and niche Market positioning.

Competitive differentiation is shifting from pure supply capability toward integrated sustainability ecosystems, combining agronomic innovation, verified environmental impact claims, and long-term buyer-producer contracts.

Key Developments in Market

  • January 2025 - AROMA Program LaunchedIn January 2025, a ~USD 120 million initiative named AROMA (Alternative Response Options for Mitigation & Adaptation of Coffee Farms) was initiated through a Green Climate Fund grant to Conservation International. This program is being implemented over seven years to strengthen climate resilience and decarbonize smallholder coffee farms across Central America and Uganda.
  • February 2025 - Excelsa Cultivation Gains Momentum in South SudanIn February 2025, trial cultivation of coffee excelsa a rare, drought-resistant species was reported in South Sudan. Despite comprising less than 1% of the global Market, its resilience to heat and disease is being recognized as a potential adaptation pathway, with hopes that commercial-scale production may follow.

Scope of the Report

Item Value
Quantitative Units USD 357.4 Million (2025), USD 643.4 Million (2035)
Coffee Variety Arabica Climate-Resilient Varieties, Robusta Climate-Resilient Varieties, Hybrid Varieties (Arabica × Robusta), Specialty Coffee Climate-Resilient Varieties
Development Approach Traditional Breeding, Genetic Engineering & CRISPR, Agroforestry & Shade-Grown Techniques, Microbial & Soil Health Enhancements, Climate-Adapted Cultivation Practices
Application Specialty Coffee Production, Commercial Coffee Production, Organic & Sustainable Coffee, Fairtrade & Ethical Coffee
Sales Channel Coffee Producers & Exporters, Specialty Coffee Retailers, modern trade, Online Coffee Retail, Foodservice & Hospitality
Regions Covered North America, Europe, South Asia & Pacific, East Asia, Latin America, Middle East & Africa
Countries Covered United States, Canada, Germany, France, United Kingdom, China, Japan, India, Brazil, South Africa
Key Companies Profiled Nestlé S.A., Starbucks Corporation, JDE Peet’s, Lavazza Group, Olam International, ECOM Agro-industrial Corp., Neumann Kaffee Gruppe, Volcafe Ltd., Strauss Group, Illycaffè
Additional Attributes Dollar sales by coffee variety, development approach, and application; adoption trends in climate-smart agriculture and resilience verification; rising demand for traceable, certified coffee; sector-specific growth in specialty, commercial, and organic segments; resilience integration in procurement; regional shifts influenced by sustainability policies; and innovations in agroforestry, genetic improvement, and soil-microbiome management.

Key Segments

By Coffee Variety:

  • Arabica Climate-Resilient Varieties
  • Robusta Climate-Resilient Varieties
  • Hybrid Varieties (Arabica × Robusta)
  • Specialty Coffee Climate-Resilient Varieties

By Development Approach:

  • Traditional Breeding
  • Genetic Engineering & CRISPR
  • Agroforestry & Shade-Grown Techniques
  • Microbial & Soil Health Enhancements
  • Climate-Adapted Cultivation Practices

By Application:

  • Specialty Coffee Production
  • Commercial Coffee Production
  • Organic & Sustainable Coffee
  • Fairtrade & Ethical Coffee

By Product Form:

  • Green Coffee Beans
  • Roasted Coffee Beans
  • Ground Coffee
  • Instant Coffee

By Sales Channel:

  • Coffee Producers & Exporters
  • Specialty Coffee Retailers
  • Supermarkets & Hypermarkets
  • Online Coffee Retail
  • Foodservice & Hospitality

By End User:

  • Coffee Roasters
  • Retail Consumers
  • Foodservice Providers

By Region:

  • North America
  • Latin America
  • Europe
  • East Asia
  • South Asia & Pacific
  • Middle East and Africa

Table of Content

  1. Executive Summary
    • Global Market Outlook
    • Demand-side Trends
    • Supply-side Trends
    • Technology Roadmap Analysis
    • Analysis and Recommendations
  2. Market Overview
    • Market Coverage / Taxonomy
    • Market Definition / Scope / Limitations
  3. Market Background
    • Market Dynamics
      • Drivers
      • Restraints
      • Opportunity
      • Trends
    • Scenario Forecast
      • Demand in Optimistic Scenario
      • Demand in Likely Scenario
      • Demand in Conservative Scenario
    • Opportunity Map Analysis
    • Product Life Cycle Analysis
    • Supply Chain Analysis
      • Supply Side Participants and their Roles
        • Producers
        • Mid-Level Participants (Traders/ Agents/ Brokers)
        • Wholesalers and Distributors
      • Value Added and Value Created at Node in the Supply Chain
      • List of Raw Material Suppliers
      • List of Existing and Potential Buyer’s
    • Investment Feasibility Matrix
    • Value Chain Analysis
      • Profit Margin Analysis
      • Wholesalers and Distributors
      • Retailers
    • PESTLE and Porter’s Analysis
    • Regulatory Landscape
      • By Key Regions
      • By Key Countries
    • Regional Parent Market Outlook
    • Production and Consumption Statistics
    • Import and Export Statistics
  4. Global Market Analysis 2020 to 2024 and Forecast, 2025 to 2035
    • Historical Market Size Value (USD Million) & Volume (Units) Analysis, 2020 to 2024
    • Current and Future Market Size Value (USD Million) & Volume (Units) Projections, 2025 to 2035
      • Y-o-Y Growth Trend Analysis
      • Absolute $ Opportunity Analysis
  5. Global Market Analysis 2020 to 2024 and Forecast 2025 to 2035, By Coffee Variety
    • Introduction / Key Findings
    • Historical Market Size Value (USD Million) & Volume (Units) Analysis By Coffee Variety, 2020 to 2024
    • Current and Future Market Size Value (USD Million) & Volume (Units) Analysis and Forecast By Coffee Variety, 2025 to 2035
      • Arabica Climate-Resilient Varieties
      • Robusta Climate-Resilient Varieties
      • Hybrid Varieties (Arabica × Robusta)
      • Specialty Coffee Climate-Resilient Varieties
    • Y-o-Y Growth Trend Analysis By Coffee Variety, 2020 to 2024
    • Absolute $ Opportunity Analysis By Coffee Variety, 2025 to 2035
  6. Global Market Analysis 2020 to 2024 and Forecast 2025 to 2035, By Development Approach
    • Introduction / Key Findings
    • Historical Market Size Value (USD Million) & Volume (Units) Analysis By Development Approach, 2020 to 2024
    • Current and Future Market Size Value (USD Million) & Volume (Units) Analysis and Forecast By Development Approach, 2025 to 2035
      • Traditional Breeding
      • Genetic Engineering & CRISPR
      • Agroforestry & Shade-Grown Techniques
      • Microbial & Soil Health Enhancements
      • Climate-Adapted Cultivation Practices
    • Y-o-Y Growth Trend Analysis By Development Approach, 2020 to 2024
    • Absolute $ Opportunity Analysis By Development Approach, 2025 to 2035
  7. Global Market Analysis 2020 to 2024 and Forecast 2025 to 2035, By Application
    • Introduction / Key Findings
    • Historical Market Size Value (USD Million) & Volume (Units) Analysis By Application, 2020 to 2024
    • Current and Future Market Size Value (USD Million) & Volume (Units) Analysis and Forecast By Application, 2025 to 2035
      • Specialty Coffee Production
      • Commercial Coffee Production
      • Organic & Sustainable Coffee
      • Fairtrade & Ethical Coffee
    • Y-o-Y Growth Trend Analysis By Application, 2020 to 2024
    • Absolute $ Opportunity Analysis By Application, 2025 to 2035
  8. Global Market Analysis 2020 to 2024 and Forecast 2025 to 2035, By Product Form
    • Introduction / Key Findings
    • Historical Market Size Value (USD Million) & Volume (Units) Analysis By Product Form, 2020 to 2024
    • Current and Future Market Size Value (USD Million) & Volume (Units) Analysis and Forecast By Product Form, 2025 to 2035
      • Green Coffee Beans
      • Roasted Coffee Beans
      • Ground Coffee
      • Instant Coffee
    • Y-o-Y Growth Trend Analysis By Product Form, 2020 to 2024
    • Absolute $ Opportunity Analysis By Product Form, 2025 to 2035
  9. Global Market Analysis 2020 to 2024 and Forecast 2025 to 2035, By Sales Channel
    • Introduction / Key Findings
    • Historical Market Size Value (USD Million) & Volume (Units) Analysis By Sales Channel, 2020 to 2024
    • Current and Future Market Size Value (USD Million) & Volume (Units) Analysis and Forecast By Sales Channel, 2025 to 2035
      • Coffee Producers & Exporters
      • Specialty Coffee Retailers
      • Supermarkets & Hypermarkets
      • Online Coffee Retail
      • Foodservice & Hospitality
    • Y-o-Y Growth Trend Analysis By Sales Channel, 2020 to 2024
    • Absolute $ Opportunity Analysis By Sales Channel, 2025 to 2035
  10. Global Market Analysis 2020 to 2024 and Forecast 2025 to 2035, By End User
    • Introduction / Key Findings
    • Historical Market Size Value (USD Million) & Volume (Units) Analysis By End User, 2020 to 2024
    • Current and Future Market Size Value (USD Million) & Volume (Units) Analysis and Forecast By End User, 2025 to 2035
      • Coffee Roasters
      • Retail Consumers
      • Foodservice Providers
    • Y-o-Y Growth Trend Analysis By End User, 2020 to 2024
    • Absolute $ Opportunity Analysis By End User, 2025 to 2035
  11. Global Market Analysis 2020 to 2024 and Forecast 2025 to 2035, By Region
    • Introduction
    • Historical Market Size Value (USD Million) & Volume (Units) Analysis By Region, 2020 to 2024
    • Current Market Size Value (USD Million) & Volume (Units) Analysis and Forecast By Region, 2025 to 2035
      • North America
      • Latin America
      • Europe
      • East Asia
      • South Asia & Pacific
      • Middle East and Africa
    • Market Attractiveness Analysis By Region
  12. North America Market Analysis 2020 to 2024 and Forecast 2025 to 2035, By Country
    • Historical Market Size Value (USD Million) & Volume (Units) Trend Analysis By Market Taxonomy, 2020 to 2024
    • Market Size Value (USD Million) & Volume (Units) Forecast By Market Taxonomy, 2025 to 2035
      • By Country
        • USA
        • Canada
      • By Coffee Variety
      • By Development Approach
      • By Application
      • By Product Form
      • By Sales Channel
      • By End User
    • Market Attractiveness Analysis
      • By Country
      • By Coffee Variety
      • By Development Approach
      • By Application
      • By Product Form
      • By Sales Channel
      • By End User
    • Key Takeaways
  13. Latin America Market Analysis 2020 to 2024 and Forecast 2025 to 2035, By Country
    • Historical Market Size Value (USD Million) & Volume (Units) Trend Analysis By Market Taxonomy, 2020 to 2024
    • Market Size Value (USD Million) & Volume (Units) Forecast By Market Taxonomy, 2025 to 2035
      • By Country
        • Brazil
        • Mexico
        • Colombia
        • Rest of Latin America
      • By Coffee Variety
      • By Development Approach
      • By Application
      • By Product Form
      • By Sales Channel
      • By End User
    • Market Attractiveness Analysis
      • By Country
      • By Coffee Variety
      • By Development Approach
      • By Application
      • By Product Form
      • By Sales Channel
      • By End User
    • Key Takeaways
  14. Europe Market Analysis 2020 to 2024 and Forecast 2025 to 2035, By Country
    • Historical Market Size Value (USD Million) & Volume (Units) Trend Analysis By Market Taxonomy, 2020 to 2024
    • Market Size Value (USD Million) & Volume (Units) Forecast By Market Taxonomy, 2025 to 2035
      • By Country
        • Germany
        • UK
        • France
        • Italy
        • Spain
        • Belgium
        • Netherlands
        • Nordic
        • Switzerland
        • Russia
        • Poland
        • Rest of Europe
      • By Coffee Variety
      • By Development Approach
      • By Application
      • By Product Form
      • By Sales Channel
      • By End User
    • Market Attractiveness Analysis
      • By Country
      • By Coffee Variety
      • By Development Approach
      • By Application
      • By Product Form
      • By Sales Channel
      • By End User
    • Key Takeaways
  15. East Asia Market Analysis 2020 to 2024 and Forecast 2025 to 2035, By Country
    • Historical Market Size Value (USD Million) & Volume (Units) Trend Analysis By Market Taxonomy, 2020 to 2024
    • Market Size Value (USD Million) & Volume (Units) Forecast By Market Taxonomy, 2025 to 2035
      • By Country
        • China
        • Japan
        • South Korea
      • By Coffee Variety
      • By Development Approach
      • By Application
      • By Product Form
      • By Sales Channel
      • By End User
    • Market Attractiveness Analysis
      • By Country
      • By Coffee Variety
      • By Development Approach
      • By Application
      • By Product Form
      • By Sales Channel
      • By End User
    • Key Takeaways
  16. South Asia & Pacific Market Analysis 2020 to 2024 and Forecast 2025 to 2035, By Country
    • Historical Market Size Value (USD Million) & Volume (Units) Trend Analysis By Market Taxonomy, 2020 to 2024
    • Market Size Value (USD Million) & Volume (Units) Forecast By Market Taxonomy, 2025 to 2035
      • By Country
        • India
        • Thailand
        • Malaysia
        • Indonesia
        • Singapore
        • Vietnam
        • Australia
        • New Zealand
        • Rest of South Asia
      • By Coffee Variety
      • By Development Approach
      • By Application
      • By Product Form
      • By Sales Channel
      • By End User
    • Market Attractiveness Analysis
      • By Country
      • By Coffee Variety
      • By Development Approach
      • By Application
      • By Product Form
      • By Sales Channel
      • By End User
    • Key Takeaways
  17. Middle East and Africa Market Analysis 2020 to 2024 and Forecast 2025 to 2035, By Country
    • Historical Market Size Value (USD Million) & Volume (Units) Trend Analysis By Market Taxonomy, 2020 to 2024
    • Market Size Value (USD Million) & Volume (Units) Forecast By Market Taxonomy, 2025 to 2035
      • By Country
        • Turkey
        • UAE
        • Saudi Arabia
        • Israel
        • Other GCC Countries
        • North Africa
        • South Africa
      • By Coffee Variety
      • By Development Approach
      • By Application
      • By Product Form
      • By Sales Channel
      • By End User
    • Market Attractiveness Analysis
      • By Country
      • By Coffee Variety
      • By Development Approach
      • By Application
      • By Product Form
      • By Sales Channel
      • By End User
    • Key Takeaways
  18. Key Countries Market Analysis
    • USA
      • Pricing Analysis
      • Market Share Analysis, 2024
        • By Coffee Variety
        • By Development Approach
        • By Application
        • By Product Form
        • By Sales Channel
        • By End User
    • Canada
      • Pricing Analysis
      • Market Share Analysis, 2024
        • By Coffee Variety
        • By Development Approach
        • By Application
        • By Product Form
        • By Sales Channel
        • By End User
    • Brazil
      • Pricing Analysis
      • Market Share Analysis, 2024
        • By Coffee Variety
        • By Development Approach
        • By Application
        • By Product Form
        • By Sales Channel
        • By End User
    • Mexico
      • Pricing Analysis
      • Market Share Analysis, 2024
        • By Coffee Variety
        • By Development Approach
        • By Application
        • By Product Form
        • By Sales Channel
        • By End User
    • Colombia
      • Pricing Analysis
      • Market Share Analysis, 2024
        • By Coffee Variety
        • By Development Approach
        • By Application
        • By Product Form
        • By Sales Channel
        • By End User
    • Rest of Latin America
      • Pricing Analysis
      • Market Share Analysis, 2024
        • By Coffee Variety
        • By Development Approach
        • By Application
        • By Product Form
        • By Sales Channel
        • By End User
    • Germany
      • Pricing Analysis
      • Market Share Analysis, 2024
        • By Coffee Variety
        • By Development Approach
        • By Application
        • By Product Form
        • By Sales Channel
        • By End User
    • UK
      • Pricing Analysis
      • Market Share Analysis, 2024
        • By Coffee Variety
        • By Development Approach
        • By Application
        • By Product Form
        • By Sales Channel
        • By End User
    • France
      • Pricing Analysis
      • Market Share Analysis, 2024
        • By Coffee Variety
        • By Development Approach
        • By Application
        • By Product Form
        • By Sales Channel
        • By End User
    • Italy
      • Pricing Analysis
      • Market Share Analysis, 2024
        • By Coffee Variety
        • By Development Approach
        • By Application
        • By Product Form
        • By Sales Channel
        • By End User
    • Spain
      • Pricing Analysis
      • Market Share Analysis, 2024
        • By Coffee Variety
        • By Development Approach
        • By Application
        • By Product Form
        • By Sales Channel
        • By End User
    • Belgium
      • Pricing Analysis
      • Market Share Analysis, 2024
        • By Coffee Variety
        • By Development Approach
        • By Application
        • By Product Form
        • By Sales Channel
        • By End User
    • Netherlands
      • Pricing Analysis
      • Market Share Analysis, 2024
        • By Coffee Variety
        • By Development Approach
        • By Application
        • By Product Form
        • By Sales Channel
        • By End User
    • Nordic
      • Pricing Analysis
      • Market Share Analysis, 2024
        • By Coffee Variety
        • By Development Approach
        • By Application
        • By Product Form
        • By Sales Channel
        • By End User
    • Switzerland
      • Pricing Analysis
      • Market Share Analysis, 2024
        • By Coffee Variety
        • By Development Approach
        • By Application
        • By Product Form
        • By Sales Channel
        • By End User
    • Russia
      • Pricing Analysis
      • Market Share Analysis, 2024
        • By Coffee Variety
        • By Development Approach
        • By Application
        • By Product Form
        • By Sales Channel
        • By End User
    • Poland
      • Pricing Analysis
      • Market Share Analysis, 2024
        • By Coffee Variety
        • By Development Approach
        • By Application
        • By Product Form
        • By Sales Channel
        • By End User
    • Rest of Europe
      • Pricing Analysis
      • Market Share Analysis, 2024
        • By Coffee Variety
        • By Development Approach
        • By Application
        • By Product Form
        • By Sales Channel
        • By End User
    • China
      • Pricing Analysis
      • Market Share Analysis, 2024
        • By Coffee Variety
        • By Development Approach
        • By Application
        • By Product Form
        • By Sales Channel
        • By End User
    • Japan
      • Pricing Analysis
      • Market Share Analysis, 2024
        • By Coffee Variety
        • By Development Approach
        • By Application
        • By Product Form
        • By Sales Channel
        • By End User
    • South Korea
      • Pricing Analysis
      • Market Share Analysis, 2024
        • By Coffee Variety
        • By Development Approach
        • By Application
        • By Product Form
        • By Sales Channel
        • By End User
    • India
      • Pricing Analysis
      • Market Share Analysis, 2024
        • By Coffee Variety
        • By Development Approach
        • By Application
        • By Product Form
        • By Sales Channel
        • By End User
    • Thailand
      • Pricing Analysis
      • Market Share Analysis, 2024
        • By Coffee Variety
        • By Development Approach
        • By Application
        • By Product Form
        • By Sales Channel
        • By End User
    • Malaysia
      • Pricing Analysis
      • Market Share Analysis, 2024
        • By Coffee Variety
        • By Development Approach
        • By Application
        • By Product Form
        • By Sales Channel
        • By End User
    • Indonesia
      • Pricing Analysis
      • Market Share Analysis, 2024
        • By Coffee Variety
        • By Development Approach
        • By Application
        • By Product Form
        • By Sales Channel
        • By End User
    • Singapore
      • Pricing Analysis
      • Market Share Analysis, 2024
        • By Coffee Variety
        • By Development Approach
        • By Application
        • By Product Form
        • By Sales Channel
        • By End User
    • Vietnam
      • Pricing Analysis
      • Market Share Analysis, 2024
        • By Coffee Variety
        • By Development Approach
        • By Application
        • By Product Form
        • By Sales Channel
        • By End User
    • Australia
      • Pricing Analysis
      • Market Share Analysis, 2024
        • By Coffee Variety
        • By Development Approach
        • By Application
        • By Product Form
        • By Sales Channel
        • By End User
    • New Zealand
      • Pricing Analysis
      • Market Share Analysis, 2024
        • By Coffee Variety
        • By Development Approach
        • By Application
        • By Product Form
        • By Sales Channel
        • By End User
    • Rest of South Asia
      • Pricing Analysis
      • Market Share Analysis, 2024
        • By Coffee Variety
        • By Development Approach
        • By Application
        • By Product Form
        • By Sales Channel
        • By End User
  19. Market Structure Analysis
    • Competition Dashboard
    • Competition Benchmarking
    • Market Share Analysis of Top Players
      • By Regional
      • By Coffee Variety
      • By Development Approach
      • By Application
      • By Product Form
      • By Sales Channel
      • By End User
  20. Competition Analysis
    • Competition Deep Dive
      • Nestlé
        • Overview
        • Product Portfolio
        • Profitability by Market Segments (Product/Age /Sales Channel/Region)
        • Sales Footprint
        • Strategy Overview
          • Marketing Strategy
          • Product Strategy
          • Channel Strategy
      • Starbucks Corporation
        • Overview
        • Product Portfolio
        • Profitability by Market Segments (Product/Age /Sales Channel/Region)
        • Sales Footprint
        • Strategy Overview
          • Marketing Strategy
          • Product Strategy
          • Channel Strategy
      • JDE Peet’s
        • Overview
        • Product Portfolio
        • Profitability by Market Segments (Product/Age /Sales Channel/Region)
        • Sales Footprint
        • Strategy Overview
          • Marketing Strategy
          • Product Strategy
          • Channel Strategy
      • Lavazza
        • Overview
        • Product Portfolio
        • Profitability by Market Segments (Product/Age /Sales Channel/Region)
        • Sales Footprint
        • Strategy Overview
          • Marketing Strategy
          • Product Strategy
          • Channel Strategy
      • Olam International
        • Overview
        • Product Portfolio
        • Profitability by Market Segments (Product/Age /Sales Channel/Region)
        • Sales Footprint
        • Strategy Overview
          • Marketing Strategy
          • Product Strategy
          • Channel Strategy
      • ECOM Agroindustrial Corporation
        • Overview
        • Product Portfolio
        • Profitability by Market Segments (Product/Age /Sales Channel/Region)
        • Sales Footprint
        • Strategy Overview
          • Marketing Strategy
          • Product Strategy
          • Channel Strategy
      • Neumann Kaffee Gruppe
        • Overview
        • Product Portfolio
        • Profitability by Market Segments (Product/Age /Sales Channel/Region)
        • Sales Footprint
        • Strategy Overview
          • Marketing Strategy
          • Product Strategy
          • Channel Strategy
      • Volcafe Ltd.
        • Overview
        • Product Portfolio
        • Profitability by Market Segments (Product/Age /Sales Channel/Region)
        • Sales Footprint
        • Strategy Overview
          • Marketing Strategy
          • Product Strategy
          • Channel Strategy
      • Strauss Group
        • Overview
        • Product Portfolio
        • Profitability by Market Segments (Product/Age /Sales Channel/Region)
        • Sales Footprint
        • Strategy Overview
          • Marketing Strategy
          • Product Strategy
          • Channel Strategy
      • Illycaffè
        • Overview
        • Product Portfolio
        • Profitability by Market Segments (Product/Age /Sales Channel/Region)
        • Sales Footprint
        • Strategy Overview
          • Marketing Strategy
          • Product Strategy
          • Channel Strategy
  21. Assumptions & Acronyms Used
  22. Research Methodology

List of Tables

  • Table 1: Global Market Value (USD Million) Forecast by Region, 2020-2035
  • Table 2: Global Market Volume (Units) Forecast by Region, 2020-2035
  • Table 3: Global Market Value (USD Million) Forecast by Coffee Variety, 2020-2035
  • Table 4: Global Market Volume (Units) Forecast by Coffee Variety, 2020-2035
  • Table 5: Global Market Value (USD Million) Forecast by Development Approach, 2020-2035
  • Table 6: Global Market Volume (Units) Forecast by Development Approach, 2020-2035
  • Table 7: Global Market Value (USD Million) Forecast by Application, 2020-2035
  • Table 8: Global Market Volume (Units) Forecast by Application, 2020-2035
  • Table 9: Global Market Value (USD Million) Forecast by Product Form, 2020-2035
  • Table 10: Global Market Volume (Units) Forecast by Product Form, 2020-2035
  • Table 11: Global Market Value (USD Million) Forecast by Sales Channel, 2020-2035
  • Table 12: Global Market Volume (Units) Forecast by Sales Channel, 2020-2035
  • Table 13: Global Market Value (USD Million) Forecast by End User, 2020-2035
  • Table 14: Global Market Volume (Units) Forecast by End User, 2020-2035
  • Table 15: North America Market Value (USD Million) Forecast by Country, 2020-2035
  • Table 16: North America Market Volume (Units) Forecast by Country, 2020-2035
  • Table 17: North America Market Value (USD Million) Forecast by Coffee Variety, 2020-2035
  • Table 18: North America Market Volume (Units) Forecast by Coffee Variety, 2020-2035
  • Table 19: North America Market Value (USD Million) Forecast by Development Approach, 2020-2035
  • Table 20: North America Market Volume (Units) Forecast by Development Approach, 2020-2035
  • Table 21: North America Market Value (USD Million) Forecast by Application, 2020-2035
  • Table 22: North America Market Volume (Units) Forecast by Application, 2020-2035
  • Table 23: North America Market Value (USD Million) Forecast by Product Form, 2020-2035
  • Table 24: North America Market Volume (Units) Forecast by Product Form, 2020-2035
  • Table 25: North America Market Value (USD Million) Forecast by Sales Channel, 2020-2035
  • Table 26: North America Market Volume (Units) Forecast by Sales Channel, 2020-2035
  • Table 27: North America Market Value (USD Million) Forecast by End User, 2020-2035
  • Table 28: North America Market Volume (Units) Forecast by End User, 2020-2035
  • Table 29: Latin America Market Value (USD Million) Forecast by Country, 2020-2035
  • Table 30: Latin America Market Volume (Units) Forecast by Country, 2020-2035
  • Table 31: Latin America Market Value (USD Million) Forecast by Coffee Variety, 2020-2035
  • Table 32: Latin America Market Volume (Units) Forecast by Coffee Variety, 2020-2035
  • Table 33: Latin America Market Value (USD Million) Forecast by Development Approach, 2020-2035
  • Table 34: Latin America Market Volume (Units) Forecast by Development Approach, 2020-2035
  • Table 35: Latin America Market Value (USD Million) Forecast by Application, 2020-2035
  • Table 36: Latin America Market Volume (Units) Forecast by Application, 2020-2035
  • Table 37: Latin America Market Value (USD Million) Forecast by Product Form, 2020-2035
  • Table 38: Latin America Market Volume (Units) Forecast by Product Form, 2020-2035
  • Table 39: Latin America Market Value (USD Million) Forecast by Sales Channel, 2020-2035
  • Table 40: Latin America Market Volume (Units) Forecast by Sales Channel, 2020-2035
  • Table 41: Latin America Market Value (USD Million) Forecast by End User, 2020-2035
  • Table 42: Latin America Market Volume (Units) Forecast by End User, 2020-2035
  • Table 43: Europe Market Value (USD Million) Forecast by Country, 2020-2035
  • Table 44: Europe Market Volume (Units) Forecast by Country, 2020-2035
  • Table 45: Europe Market Value (USD Million) Forecast by Coffee Variety, 2020-2035
  • Table 46: Europe Market Volume (Units) Forecast by Coffee Variety, 2020-2035
  • Table 47: Europe Market Value (USD Million) Forecast by Development Approach, 2020-2035
  • Table 48: Europe Market Volume (Units) Forecast by Development Approach, 2020-2035
  • Table 49: Europe Market Value (USD Million) Forecast by Application, 2020-2035
  • Table 50: Europe Market Volume (Units) Forecast by Application, 2020-2035
  • Table 51: Europe Market Value (USD Million) Forecast by Product Form, 2020-2035
  • Table 52: Europe Market Volume (Units) Forecast by Product Form, 2020-2035
  • Table 53: Europe Market Value (USD Million) Forecast by Sales Channel, 2020-2035
  • Table 54: Europe Market Volume (Units) Forecast by Sales Channel, 2020-2035
  • Table 55: Europe Market Value (USD Million) Forecast by End User, 2020-2035
  • Table 56: Europe Market Volume (Units) Forecast by End User, 2020-2035
  • Table 57: East Asia Market Value (USD Million) Forecast by Country, 2020-2035
  • Table 58: East Asia Market Volume (Units) Forecast by Country, 2020-2035
  • Table 59: East Asia Market Value (USD Million) Forecast by Coffee Variety, 2020-2035
  • Table 60: East Asia Market Volume (Units) Forecast by Coffee Variety, 2020-2035
  • Table 61: East Asia Market Value (USD Million) Forecast by Development Approach, 2020-2035
  • Table 62: East Asia Market Volume (Units) Forecast by Development Approach, 2020-2035
  • Table 63: East Asia Market Value (USD Million) Forecast by Application, 2020-2035
  • Table 64: East Asia Market Volume (Units) Forecast by Application, 2020-2035
  • Table 65: East Asia Market Value (USD Million) Forecast by Product Form, 2020-2035
  • Table 66: East Asia Market Volume (Units) Forecast by Product Form, 2020-2035
  • Table 67: East Asia Market Value (USD Million) Forecast by Sales Channel, 2020-2035
  • Table 68: East Asia Market Volume (Units) Forecast by Sales Channel, 2020-2035
  • Table 69: East Asia Market Value (USD Million) Forecast by End User, 2020-2035
  • Table 70: East Asia Market Volume (Units) Forecast by End User, 2020-2035
  • Table 71: South Asia & Pacific Market Value (USD Million) Forecast by Country, 2020-2035
  • Table 72: South Asia & Pacific Market Volume (Units) Forecast by Country, 2020-2035
  • Table 73: South Asia & Pacific Market Value (USD Million) Forecast by Coffee Variety, 2020-2035
  • Table 74: South Asia & Pacific Market Volume (Units) Forecast by Coffee Variety, 2020-2035
  • Table 75: South Asia & Pacific Market Value (USD Million) Forecast by Development Approach, 2020-2035
  • Table 76: South Asia & Pacific Market Volume (Units) Forecast by Development Approach, 2020-2035
  • Table 77: South Asia & Pacific Market Value (USD Million) Forecast by Application, 2020-2035
  • Table 78: South Asia & Pacific Market Volume (Units) Forecast by Application, 2020-2035
  • Table 79: South Asia & Pacific Market Value (USD Million) Forecast by Product Form, 2020-2035
  • Table 80: South Asia & Pacific Market Volume (Units) Forecast by Product Form, 2020-2035
  • Table 81: South Asia & Pacific Market Value (USD Million) Forecast by Sales Channel, 2020-2035
  • Table 82: South Asia & Pacific Market Volume (Units) Forecast by Sales Channel, 2020-2035
  • Table 83: South Asia & Pacific Market Value (USD Million) Forecast by End User, 2020-2035
  • Table 84: South Asia & Pacific Market Volume (Units) Forecast by End User, 2020-2035
  • Table 85: Middle East and Africa Market Value (USD Million) Forecast by Country, 2020-2035
  • Table 86: Middle East and Africa Market Volume (Units) Forecast by Country, 2020-2035
  • Table 87: Middle East and Africa Market Value (USD Million) Forecast by Coffee Variety, 2020-2035
  • Table 88: Middle East and Africa Market Volume (Units) Forecast by Coffee Variety, 2020-2035
  • Table 89: Middle East and Africa Market Value (USD Million) Forecast by Development Approach, 2020-2035
  • Table 90: Middle East and Africa Market Volume (Units) Forecast by Development Approach, 2020-2035
  • Table 91: Middle East and Africa Market Value (USD Million) Forecast by Application, 2020-2035
  • Table 92: Middle East and Africa Market Volume (Units) Forecast by Application, 2020-2035
  • Table 93: Middle East and Africa Market Value (USD Million) Forecast by Product Form, 2020-2035
  • Table 94: Middle East and Africa Market Volume (Units) Forecast by Product Form, 2020-2035
  • Table 95: Middle East and Africa Market Value (USD Million) Forecast by Sales Channel, 2020-2035
  • Table 96: Middle East and Africa Market Volume (Units) Forecast by Sales Channel, 2020-2035
  • Table 97: Middle East and Africa Market Value (USD Million) Forecast by End User, 2020-2035
  • Table 98: Middle East and Africa Market Volume (Units) Forecast by End User, 2020-2035

List of Figures

  • Figure 1: Global Market Value (USD Million) by Coffee Variety, 2025-2035
  • Figure 2: Global Market Value (USD Million) by Development Approach, 2025-2035
  • Figure 3: Global Market Value (USD Million) by Application, 2025-2035
  • Figure 4: Global Market Value (USD Million) by Product Form, 2025-2035
  • Figure 5: Global Market Value (USD Million) by Sales Channel, 2025-2035
  • Figure 6: Global Market Value (USD Million) by End User, 2025-2035
  • Figure 7: Global Market Value (USD Million) by Region, 2025-2035
  • Figure 8: Global Market Value (USD Million) Analysis by Region, 2020-2035
  • Figure 9: Global Market Volume (Units) Analysis by Region, 2020-2035
  • Figure 10: Global Market Value Share (%) and BPS Analysis by Region, 2025-2035
  • Figure 11: Global Market Y-o-Y Growth (%) Projections by Region, 2025-2035
  • Figure 12: Global Market Value (USD Million) Analysis by Coffee Variety, 2020-2035
  • Figure 13: Global Market Volume (Units) Analysis by Coffee Variety, 2020-2035
  • Figure 14: Global Market Value Share (%) and BPS Analysis by Coffee Variety, 2025-2035
  • Figure 15: Global Market Y-o-Y Growth (%) Projections by Coffee Variety, 2025-2035
  • Figure 16: Global Market Value (USD Million) Analysis by Development Approach, 2020-2035
  • Figure 17: Global Market Volume (Units) Analysis by Development Approach, 2020-2035
  • Figure 18: Global Market Value Share (%) and BPS Analysis by Development Approach, 2025-2035
  • Figure 19: Global Market Y-o-Y Growth (%) Projections by Development Approach, 2025-2035
  • Figure 20: Global Market Value (USD Million) Analysis by Application, 2020-2035
  • Figure 21: Global Market Volume (Units) Analysis by Application, 2020-2035
  • Figure 22: Global Market Value Share (%) and BPS Analysis by Application, 2025-2035
  • Figure 23: Global Market Y-o-Y Growth (%) Projections by Application, 2025-2035
  • Figure 24: Global Market Value (USD Million) Analysis by Product Form, 2020-2035
  • Figure 25: Global Market Volume (Units) Analysis by Product Form, 2020-2035
  • Figure 26: Global Market Value Share (%) and BPS Analysis by Product Form, 2025-2035
  • Figure 27: Global Market Y-o-Y Growth (%) Projections by Product Form, 2025-2035
  • Figure 28: Global Market Value (USD Million) Analysis by Sales Channel, 2020-2035
  • Figure 29: Global Market Volume (Units) Analysis by Sales Channel, 2020-2035
  • Figure 30: Global Market Value Share (%) and BPS Analysis by Sales Channel, 2025-2035
  • Figure 31: Global Market Y-o-Y Growth (%) Projections by Sales Channel, 2025-2035
  • Figure 32: Global Market Value (USD Million) Analysis by End User, 2020-2035
  • Figure 33: Global Market Volume (Units) Analysis by End User, 2020-2035
  • Figure 34: Global Market Value Share (%) and BPS Analysis by End User, 2025-2035
  • Figure 35: Global Market Y-o-Y Growth (%) Projections by End User, 2025-2035
  • Figure 36: Global Market Attractiveness by Coffee Variety, 2025-2035
  • Figure 37: Global Market Attractiveness by Development Approach, 2025-2035
  • Figure 38: Global Market Attractiveness by Application, 2025-2035
  • Figure 39: Global Market Attractiveness by Product Form, 2025-2035
  • Figure 40: Global Market Attractiveness by Sales Channel, 2025-2035
  • Figure 41: Global Market Attractiveness by End User, 2025-2035
  • Figure 42: Global Market Attractiveness by Region, 2025-2035
  • Figure 43: North America Market Value (USD Million) by Coffee Variety, 2025-2035
  • Figure 44: North America Market Value (USD Million) by Development Approach, 2025-2035
  • Figure 45: North America Market Value (USD Million) by Application, 2025-2035
  • Figure 46: North America Market Value (USD Million) by Product Form, 2025-2035
  • Figure 47: North America Market Value (USD Million) by Sales Channel, 2025-2035
  • Figure 48: North America Market Value (USD Million) by End User, 2025-2035
  • Figure 49: North America Market Value (USD Million) by Country, 2025-2035
  • Figure 50: North America Market Value (USD Million) Analysis by Country, 2020-2035
  • Figure 51: North America Market Volume (Units) Analysis by Country, 2020-2035
  • Figure 52: North America Market Value Share (%) and BPS Analysis by Country, 2025-2035
  • Figure 53: North America Market Y-o-Y Growth (%) Projections by Country, 2025-2035
  • Figure 54: North America Market Value (USD Million) Analysis by Coffee Variety, 2020-2035
  • Figure 55: North America Market Volume (Units) Analysis by Coffee Variety, 2020-2035
  • Figure 56: North America Market Value Share (%) and BPS Analysis by Coffee Variety, 2025-2035
  • Figure 57: North America Market Y-o-Y Growth (%) Projections by Coffee Variety, 2025-2035
  • Figure 58: North America Market Value (USD Million) Analysis by Development Approach, 2020-2035
  • Figure 59: North America Market Volume (Units) Analysis by Development Approach, 2020-2035
  • Figure 60: North America Market Value Share (%) and BPS Analysis by Development Approach, 2025-2035
  • Figure 61: North America Market Y-o-Y Growth (%) Projections by Development Approach, 2025-2035
  • Figure 62: North America Market Value (USD Million) Analysis by Application, 2020-2035
  • Figure 63: North America Market Volume (Units) Analysis by Application, 2020-2035
  • Figure 64: North America Market Value Share (%) and BPS Analysis by Application, 2025-2035
  • Figure 65: North America Market Y-o-Y Growth (%) Projections by Application, 2025-2035
  • Figure 66: North America Market Value (USD Million) Analysis by Product Form, 2020-2035
  • Figure 67: North America Market Volume (Units) Analysis by Product Form, 2020-2035
  • Figure 68: North America Market Value Share (%) and BPS Analysis by Product Form, 2025-2035
  • Figure 69: North America Market Y-o-Y Growth (%) Projections by Product Form, 2025-2035
  • Figure 70: North America Market Value (USD Million) Analysis by Sales Channel, 2020-2035
  • Figure 71: North America Market Volume (Units) Analysis by Sales Channel, 2020-2035
  • Figure 72: North America Market Value Share (%) and BPS Analysis by Sales Channel, 2025-2035
  • Figure 73: North America Market Y-o-Y Growth (%) Projections by Sales Channel, 2025-2035
  • Figure 74: North America Market Value (USD Million) Analysis by End User, 2020-2035
  • Figure 75: North America Market Volume (Units) Analysis by End User, 2020-2035
  • Figure 76: North America Market Value Share (%) and BPS Analysis by End User, 2025-2035
  • Figure 77: North America Market Y-o-Y Growth (%) Projections by End User, 2025-2035
  • Figure 78: North America Market Attractiveness by Coffee Variety, 2025-2035
  • Figure 79: North America Market Attractiveness by Development Approach, 2025-2035
  • Figure 80: North America Market Attractiveness by Application, 2025-2035
  • Figure 81: North America Market Attractiveness by Product Form, 2025-2035
  • Figure 82: North America Market Attractiveness by Sales Channel, 2025-2035
  • Figure 83: North America Market Attractiveness by End User, 2025-2035
  • Figure 84: North America Market Attractiveness by Country, 2025-2035
  • Figure 85: Latin America Market Value (USD Million) by Coffee Variety, 2025-2035
  • Figure 86: Latin America Market Value (USD Million) by Development Approach, 2025-2035
  • Figure 87: Latin America Market Value (USD Million) by Application, 2025-2035
  • Figure 88: Latin America Market Value (USD Million) by Product Form, 2025-2035
  • Figure 89: Latin America Market Value (USD Million) by Sales Channel, 2025-2035
  • Figure 90: Latin America Market Value (USD Million) by End User, 2025-2035
  • Figure 91: Latin America Market Value (USD Million) by Country, 2025-2035
  • Figure 92: Latin America Market Value (USD Million) Analysis by Country, 2020-2035
  • Figure 93: Latin America Market Volume (Units) Analysis by Country, 2020-2035
  • Figure 94: Latin America Market Value Share (%) and BPS Analysis by Country, 2025-2035
  • Figure 95: Latin America Market Y-o-Y Growth (%) Projections by Country, 2025-2035
  • Figure 96: Latin America Market Value (USD Million) Analysis by Coffee Variety, 2020-2035
  • Figure 97: Latin America Market Volume (Units) Analysis by Coffee Variety, 2020-2035
  • Figure 98: Latin America Market Value Share (%) and BPS Analysis by Coffee Variety, 2025-2035
  • Figure 99: Latin America Market Y-o-Y Growth (%) Projections by Coffee Variety, 2025-2035
  • Figure 100: Latin America Market Value (USD Million) Analysis by Development Approach, 2020-2035
  • Figure 101: Latin America Market Volume (Units) Analysis by Development Approach, 2020-2035
  • Figure 102: Latin America Market Value Share (%) and BPS Analysis by Development Approach, 2025-2035
  • Figure 103: Latin America Market Y-o-Y Growth (%) Projections by Development Approach, 2025-2035
  • Figure 104: Latin America Market Value (USD Million) Analysis by Application, 2020-2035
  • Figure 105: Latin America Market Volume (Units) Analysis by Application, 2020-2035
  • Figure 106: Latin America Market Value Share (%) and BPS Analysis by Application, 2025-2035
  • Figure 107: Latin America Market Y-o-Y Growth (%) Projections by Application, 2025-2035
  • Figure 108: Latin America Market Value (USD Million) Analysis by Product Form, 2020-2035
  • Figure 109: Latin America Market Volume (Units) Analysis by Product Form, 2020-2035
  • Figure 110: Latin America Market Value Share (%) and BPS Analysis by Product Form, 2025-2035
  • Figure 111: Latin America Market Y-o-Y Growth (%) Projections by Product Form, 2025-2035
  • Figure 112: Latin America Market Value (USD Million) Analysis by Sales Channel, 2020-2035
  • Figure 113: Latin America Market Volume (Units) Analysis by Sales Channel, 2020-2035
  • Figure 114: Latin America Market Value Share (%) and BPS Analysis by Sales Channel, 2025-2035
  • Figure 115: Latin America Market Y-o-Y Growth (%) Projections by Sales Channel, 2025-2035
  • Figure 116: Latin America Market Value (USD Million) Analysis by End User, 2020-2035
  • Figure 117: Latin America Market Volume (Units) Analysis by End User, 2020-2035
  • Figure 118: Latin America Market Value Share (%) and BPS Analysis by End User, 2025-2035
  • Figure 119: Latin America Market Y-o-Y Growth (%) Projections by End User, 2025-2035
  • Figure 120: Latin America Market Attractiveness by Coffee Variety, 2025-2035
  • Figure 121: Latin America Market Attractiveness by Development Approach, 2025-2035
  • Figure 122: Latin America Market Attractiveness by Application, 2025-2035
  • Figure 123: Latin America Market Attractiveness by Product Form, 2025-2035
  • Figure 124: Latin America Market Attractiveness by Sales Channel, 2025-2035
  • Figure 125: Latin America Market Attractiveness by End User, 2025-2035
  • Figure 126: Latin America Market Attractiveness by Country, 2025-2035
  • Figure 127: Europe Market Value (USD Million) by Coffee Variety, 2025-2035
  • Figure 128: Europe Market Value (USD Million) by Development Approach, 2025-2035
  • Figure 129: Europe Market Value (USD Million) by Application, 2025-2035
  • Figure 130: Europe Market Value (USD Million) by Product Form, 2025-2035
  • Figure 131: Europe Market Value (USD Million) by Sales Channel, 2025-2035
  • Figure 132: Europe Market Value (USD Million) by End User, 2025-2035
  • Figure 133: Europe Market Value (USD Million) by Country, 2025-2035
  • Figure 134: Europe Market Value (USD Million) Analysis by Country, 2020-2035
  • Figure 135: Europe Market Volume (Units) Analysis by Country, 2020-2035
  • Figure 136: Europe Market Value Share (%) and BPS Analysis by Country, 2025-2035
  • Figure 137: Europe Market Y-o-Y Growth (%) Projections by Country, 2025-2035
  • Figure 138: Europe Market Value (USD Million) Analysis by Coffee Variety, 2020-2035
  • Figure 139: Europe Market Volume (Units) Analysis by Coffee Variety, 2020-2035
  • Figure 140: Europe Market Value Share (%) and BPS Analysis by Coffee Variety, 2025-2035
  • Figure 141: Europe Market Y-o-Y Growth (%) Projections by Coffee Variety, 2025-2035
  • Figure 142: Europe Market Value (USD Million) Analysis by Development Approach, 2020-2035
  • Figure 143: Europe Market Volume (Units) Analysis by Development Approach, 2020-2035
  • Figure 144: Europe Market Value Share (%) and BPS Analysis by Development Approach, 2025-2035
  • Figure 145: Europe Market Y-o-Y Growth (%) Projections by Development Approach, 2025-2035
  • Figure 146: Europe Market Value (USD Million) Analysis by Application, 2020-2035
  • Figure 147: Europe Market Volume (Units) Analysis by Application, 2020-2035
  • Figure 148: Europe Market Value Share (%) and BPS Analysis by Application, 2025-2035
  • Figure 149: Europe Market Y-o-Y Growth (%) Projections by Application, 2025-2035
  • Figure 150: Europe Market Value (USD Million) Analysis by Product Form, 2020-2035
  • Figure 151: Europe Market Volume (Units) Analysis by Product Form, 2020-2035
  • Figure 152: Europe Market Value Share (%) and BPS Analysis by Product Form, 2025-2035
  • Figure 153: Europe Market Y-o-Y Growth (%) Projections by Product Form, 2025-2035
  • Figure 154: Europe Market Value (USD Million) Analysis by Sales Channel, 2020-2035
  • Figure 155: Europe Market Volume (Units) Analysis by Sales Channel, 2020-2035
  • Figure 156: Europe Market Value Share (%) and BPS Analysis by Sales Channel, 2025-2035
  • Figure 157: Europe Market Y-o-Y Growth (%) Projections by Sales Channel, 2025-2035
  • Figure 158: Europe Market Value (USD Million) Analysis by End User, 2020-2035
  • Figure 159: Europe Market Volume (Units) Analysis by End User, 2020-2035
  • Figure 160: Europe Market Value Share (%) and BPS Analysis by End User, 2025-2035
  • Figure 161: Europe Market Y-o-Y Growth (%) Projections by End User, 2025-2035
  • Figure 162: Europe Market Attractiveness by Coffee Variety, 2025-2035
  • Figure 163: Europe Market Attractiveness by Development Approach, 2025-2035
  • Figure 164: Europe Market Attractiveness by Application, 2025-2035
  • Figure 165: Europe Market Attractiveness by Product Form, 2025-2035
  • Figure 166: Europe Market Attractiveness by Sales Channel, 2025-2035
  • Figure 167: Europe Market Attractiveness by End User, 2025-2035
  • Figure 168: Europe Market Attractiveness by Country, 2025-2035
  • Figure 169: East Asia Market Value (USD Million) by Coffee Variety, 2025-2035
  • Figure 170: East Asia Market Value (USD Million) by Development Approach, 2025-2035
  • Figure 171: East Asia Market Value (USD Million) by Application, 2025-2035
  • Figure 172: East Asia Market Value (USD Million) by Product Form, 2025-2035
  • Figure 173: East Asia Market Value (USD Million) by Sales Channel, 2025-2035
  • Figure 174: East Asia Market Value (USD Million) by End User, 2025-2035
  • Figure 175: East Asia Market Value (USD Million) by Country, 2025-2035
  • Figure 176: East Asia Market Value (USD Million) Analysis by Country, 2020-2035
  • Figure 177: East Asia Market Volume (Units) Analysis by Country, 2020-2035
  • Figure 178: East Asia Market Value Share (%) and BPS Analysis by Country, 2025-2035
  • Figure 179: East Asia Market Y-o-Y Growth (%) Projections by Country, 2025-2035
  • Figure 180: East Asia Market Value (USD Million) Analysis by Coffee Variety, 2020-2035
  • Figure 181: East Asia Market Volume (Units) Analysis by Coffee Variety, 2020-2035
  • Figure 182: East Asia Market Value Share (%) and BPS Analysis by Coffee Variety, 2025-2035
  • Figure 183: East Asia Market Y-o-Y Growth (%) Projections by Coffee Variety, 2025-2035
  • Figure 184: East Asia Market Value (USD Million) Analysis by Development Approach, 2020-2035
  • Figure 185: East Asia Market Volume (Units) Analysis by Development Approach, 2020-2035
  • Figure 186: East Asia Market Value Share (%) and BPS Analysis by Development Approach, 2025-2035
  • Figure 187: East Asia Market Y-o-Y Growth (%) Projections by Development Approach, 2025-2035
  • Figure 188: East Asia Market Value (USD Million) Analysis by Application, 2020-2035
  • Figure 189: East Asia Market Volume (Units) Analysis by Application, 2020-2035
  • Figure 190: East Asia Market Value Share (%) and BPS Analysis by Application, 2025-2035
  • Figure 191: East Asia Market Y-o-Y Growth (%) Projections by Application, 2025-2035
  • Figure 192: East Asia Market Value (USD Million) Analysis by Product Form, 2020-2035
  • Figure 193: East Asia Market Volume (Units) Analysis by Product Form, 2020-2035
  • Figure 194: East Asia Market Value Share (%) and BPS Analysis by Product Form, 2025-2035
  • Figure 195: East Asia Market Y-o-Y Growth (%) Projections by Product Form, 2025-2035
  • Figure 196: East Asia Market Value (USD Million) Analysis by Sales Channel, 2020-2035
  • Figure 197: East Asia Market Volume (Units) Analysis by Sales Channel, 2020-2035
  • Figure 198: East Asia Market Value Share (%) and BPS Analysis by Sales Channel, 2025-2035
  • Figure 199: East Asia Market Y-o-Y Growth (%) Projections by Sales Channel, 2025-2035
  • Figure 200: East Asia Market Value (USD Million) Analysis by End User, 2020-2035
  • Figure 201: East Asia Market Volume (Units) Analysis by End User, 2020-2035
  • Figure 202: East Asia Market Value Share (%) and BPS Analysis by End User, 2025-2035
  • Figure 203: East Asia Market Y-o-Y Growth (%) Projections by End User, 2025-2035
  • Figure 204: East Asia Market Attractiveness by Coffee Variety, 2025-2035
  • Figure 205: East Asia Market Attractiveness by Development Approach, 2025-2035
  • Figure 206: East Asia Market Attractiveness by Application, 2025-2035
  • Figure 207: East Asia Market Attractiveness by Product Form, 2025-2035
  • Figure 208: East Asia Market Attractiveness by Sales Channel, 2025-2035
  • Figure 209: East Asia Market Attractiveness by End User, 2025-2035
  • Figure 210: East Asia Market Attractiveness by Country, 2025-2035
  • Figure 211: South Asia & Pacific Market Value (USD Million) by Coffee Variety, 2025-2035
  • Figure 212: South Asia & Pacific Market Value (USD Million) by Development Approach, 2025-2035
  • Figure 213: South Asia & Pacific Market Value (USD Million) by Application, 2025-2035
  • Figure 214: South Asia & Pacific Market Value (USD Million) by Product Form, 2025-2035
  • Figure 215: South Asia & Pacific Market Value (USD Million) by Sales Channel, 2025-2035
  • Figure 216: South Asia & Pacific Market Value (USD Million) by End User, 2025-2035
  • Figure 217: South Asia & Pacific Market Value (USD Million) by Country, 2025-2035
  • Figure 218: South Asia & Pacific Market Value (USD Million) Analysis by Country, 2020-2035
  • Figure 219: South Asia & Pacific Market Volume (Units) Analysis by Country, 2020-2035
  • Figure 220: South Asia & Pacific Market Value Share (%) and BPS Analysis by Country, 2025-2035
  • Figure 221: South Asia & Pacific Market Y-o-Y Growth (%) Projections by Country, 2025-2035
  • Figure 222: South Asia & Pacific Market Value (USD Million) Analysis by Coffee Variety, 2020-2035
  • Figure 223: South Asia & Pacific Market Volume (Units) Analysis by Coffee Variety, 2020-2035
  • Figure 224: South Asia & Pacific Market Value Share (%) and BPS Analysis by Coffee Variety, 2025-2035
  • Figure 225: South Asia & Pacific Market Y-o-Y Growth (%) Projections by Coffee Variety, 2025-2035
  • Figure 226: South Asia & Pacific Market Value (USD Million) Analysis by Development Approach, 2020-2035
  • Figure 227: South Asia & Pacific Market Volume (Units) Analysis by Development Approach, 2020-2035
  • Figure 228: South Asia & Pacific Market Value Share (%) and BPS Analysis by Development Approach, 2025-2035
  • Figure 229: South Asia & Pacific Market Y-o-Y Growth (%) Projections by Development Approach, 2025-2035
  • Figure 230: South Asia & Pacific Market Value (USD Million) Analysis by Application, 2020-2035
  • Figure 231: South Asia & Pacific Market Volume (Units) Analysis by Application, 2020-2035
  • Figure 232: South Asia & Pacific Market Value Share (%) and BPS Analysis by Application, 2025-2035
  • Figure 233: South Asia & Pacific Market Y-o-Y Growth (%) Projections by Application, 2025-2035
  • Figure 234: South Asia & Pacific Market Value (USD Million) Analysis by Product Form, 2020-2035
  • Figure 235: South Asia & Pacific Market Volume (Units) Analysis by Product Form, 2020-2035
  • Figure 236: South Asia & Pacific Market Value Share (%) and BPS Analysis by Product Form, 2025-2035
  • Figure 237: South Asia & Pacific Market Y-o-Y Growth (%) Projections by Product Form, 2025-2035
  • Figure 238: South Asia & Pacific Market Value (USD Million) Analysis by Sales Channel, 2020-2035
  • Figure 239: South Asia & Pacific Market Volume (Units) Analysis by Sales Channel, 2020-2035
  • Figure 240: South Asia & Pacific Market Value Share (%) and BPS Analysis by Sales Channel, 2025-2035
  • Figure 241: South Asia & Pacific Market Y-o-Y Growth (%) Projections by Sales Channel, 2025-2035
  • Figure 242: South Asia & Pacific Market Value (USD Million) Analysis by End User, 2020-2035
  • Figure 243: South Asia & Pacific Market Volume (Units) Analysis by End User, 2020-2035
  • Figure 244: South Asia & Pacific Market Value Share (%) and BPS Analysis by End User, 2025-2035
  • Figure 245: South Asia & Pacific Market Y-o-Y Growth (%) Projections by End User, 2025-2035
  • Figure 246: South Asia & Pacific Market Attractiveness by Coffee Variety, 2025-2035
  • Figure 247: South Asia & Pacific Market Attractiveness by Development Approach, 2025-2035
  • Figure 248: South Asia & Pacific Market Attractiveness by Application, 2025-2035
  • Figure 249: South Asia & Pacific Market Attractiveness by Product Form, 2025-2035
  • Figure 250: South Asia & Pacific Market Attractiveness by Sales Channel, 2025-2035
  • Figure 251: South Asia & Pacific Market Attractiveness by End User, 2025-2035
  • Figure 252: South Asia & Pacific Market Attractiveness by Country, 2025-2035
  • Figure 253: Middle East and Africa Market Value (USD Million) by Coffee Variety, 2025-2035
  • Figure 254: Middle East and Africa Market Value (USD Million) by Development Approach, 2025-2035
  • Figure 255: Middle East and Africa Market Value (USD Million) by Application, 2025-2035
  • Figure 256: Middle East and Africa Market Value (USD Million) by Product Form, 2025-2035
  • Figure 257: Middle East and Africa Market Value (USD Million) by Sales Channel, 2025-2035
  • Figure 258: Middle East and Africa Market Value (USD Million) by End User, 2025-2035
  • Figure 259: Middle East and Africa Market Value (USD Million) by Country, 2025-2035
  • Figure 260: Middle East and Africa Market Value (USD Million) Analysis by Country, 2020-2035
  • Figure 261: Middle East and Africa Market Volume (Units) Analysis by Country, 2020-2035
  • Figure 262: Middle East and Africa Market Value Share (%) and BPS Analysis by Country, 2025-2035
  • Figure 263: Middle East and Africa Market Y-o-Y Growth (%) Projections by Country, 2025-2035
  • Figure 264: Middle East and Africa Market Value (USD Million) Analysis by Coffee Variety, 2020-2035
  • Figure 265: Middle East and Africa Market Volume (Units) Analysis by Coffee Variety, 2020-2035
  • Figure 266: Middle East and Africa Market Value Share (%) and BPS Analysis by Coffee Variety, 2025-2035
  • Figure 267: Middle East and Africa Market Y-o-Y Growth (%) Projections by Coffee Variety, 2025-2035
  • Figure 268: Middle East and Africa Market Value (USD Million) Analysis by Development Approach, 2020-2035
  • Figure 269: Middle East and Africa Market Volume (Units) Analysis by Development Approach, 2020-2035
  • Figure 270: Middle East and Africa Market Value Share (%) and BPS Analysis by Development Approach, 2025-2035
  • Figure 271: Middle East and Africa Market Y-o-Y Growth (%) Projections by Development Approach, 2025-2035
  • Figure 272: Middle East and Africa Market Value (USD Million) Analysis by Application, 2020-2035
  • Figure 273: Middle East and Africa Market Volume (Units) Analysis by Application, 2020-2035
  • Figure 274: Middle East and Africa Market Value Share (%) and BPS Analysis by Application, 2025-2035
  • Figure 275: Middle East and Africa Market Y-o-Y Growth (%) Projections by Application, 2025-2035
  • Figure 276: Middle East and Africa Market Value (USD Million) Analysis by Product Form, 2020-2035
  • Figure 277: Middle East and Africa Market Volume (Units) Analysis by Product Form, 2020-2035
  • Figure 278: Middle East and Africa Market Value Share (%) and BPS Analysis by Product Form, 2025-2035
  • Figure 279: Middle East and Africa Market Y-o-Y Growth (%) Projections by Product Form, 2025-2035
  • Figure 280: Middle East and Africa Market Value (USD Million) Analysis by Sales Channel, 2020-2035
  • Figure 281: Middle East and Africa Market Volume (Units) Analysis by Sales Channel, 2020-2035
  • Figure 282: Middle East and Africa Market Value Share (%) and BPS Analysis by Sales Channel, 2025-2035
  • Figure 283: Middle East and Africa Market Y-o-Y Growth (%) Projections by Sales Channel, 2025-2035
  • Figure 284: Middle East and Africa Market Value (USD Million) Analysis by End User, 2020-2035
  • Figure 285: Middle East and Africa Market Volume (Units) Analysis by End User, 2020-2035
  • Figure 286: Middle East and Africa Market Value Share (%) and BPS Analysis by End User, 2025-2035
  • Figure 287: Middle East and Africa Market Y-o-Y Growth (%) Projections by End User, 2025-2035
  • Figure 288: Middle East and Africa Market Attractiveness by Coffee Variety, 2025-2035
  • Figure 289: Middle East and Africa Market Attractiveness by Development Approach, 2025-2035
  • Figure 290: Middle East and Africa Market Attractiveness by Application, 2025-2035
  • Figure 291: Middle East and Africa Market Attractiveness by Product Form, 2025-2035
  • Figure 292: Middle East and Africa Market Attractiveness by Sales Channel, 2025-2035
  • Figure 293: Middle East and Africa Market Attractiveness by End User, 2025-2035
  • Figure 294: Middle East and Africa Market Attractiveness by Country, 2025-2035

Frequently Asked Questions

How big is the Climate resilient Coffee Beans Market in 2025?

The global Climate resilient Coffee Beans Market is estimated to be valued at USD 357.4 million in 2025.

What will be the size of the Climate resilient Coffee Beans Market in 2035?

The Market size for the Climate resilient Coffee Beans Market is projected to reach USD 643.47 million by 2035.

How much will the Climate resilient Coffee Beans Market growth between 2025 and 2035?

The Climate resilient Coffee Beans Market is expected to grow at a 6.1% CAGR between 2025 and 2035.

What are the key product types in the Climate resilient Coffee Beans Market?

The key product types in the Climate resilient Coffee Beans Market are Arabica Climate-Resilient Varieties, Robusta Climate-Resilient Varieties, Hybrid Varieties (Arabica × Robusta), and Specialty Coffee Climate-Resilient Varieties.

Which coffee variety segment will contribute a significant share in the Climate resilient Coffee Beans Market in 2025?

In terms of variety, Arabica Climate-Resilient Varieties are expected to command 40% share in the Climate resilient Coffee Beans Market in 2025.

Explore Similar Insights

Future Market Insights

Climate Resilient Coffee bean Market