

- Market Size (2026)
- USD 375.0 Mn
- Forecast (2036)
- USD 3492.0 Mn
- CAGR (2026 to 2036)
- 25.0%
How big is Retail Shelf-Scanning & Inventory Robots Market size?
USD 375.0 million in 2026 and USD 3,492.0 million by 2036 at a 25.0% CAGR.
The retail shelf-scanning & inventory robots sector is expected to record a 25.0% CAGR from 2026 to 2036, lifting valuation from USD 375.0 million to USD 3,492.0 million. Modern retail stores rely on automated technology to track stock accurately on the sales floor. Scheduled aisle scans provide recurring evidence covering empty facings and misplaced products during operating hours. Store teams connect these robot findings with replenishment work and inventory management software for quicker corrective action. A major industry report highlights the current data gap making such robots necessary. Impinj reported in December 2024 stating only 33% of surveyed United States supply-chain managers consistently obtained accurate real-time inventory data. This lack of visibility directly influences retailers to adopt direct shelf verification tools. Such inventory robots result with helping store managers solve stock inaccuracies before losing sales.
Different global markets prioritize unique features when choosing automated shelf-scanning platforms. United States retailers favor multi-store evidence and managed service coverage during platform review. European Union and Japanese retailers place greater weight on governance records and navigation across compact stores. Every platform selection heavily reflects specific aisle geometry and local technical coverage across each operating region. Growing interest in artificial intelligence further drives this global adoption. Honeywell reported in January 2025 claiming 32% of surveyed retailers were applying AI to product-availability monitoring. This growing trend directly promotes automated shelf intelligence investment worldwide. Retailers are required to choose robotic platforms integrating both, regional store layouts and technical capabilities.
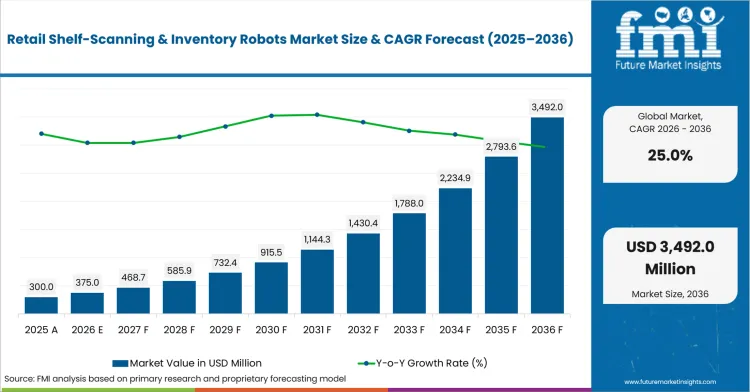
Key Takeaways of Retail Shelf-Scanning & Inventory Robots Market
- Demand for retail shelf-scanning and inventory robots is driven by retailers connecting shelf evidence with replenishment speed, with program decisions reflecting recognition accuracy and service responsiveness.
- By business model, RaaS - subscription is expected to lead with 56.0% share in 2026, owing to managed deployment and recurring support.
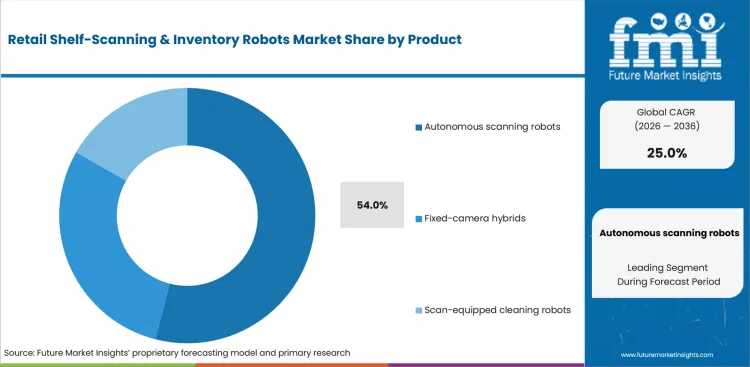
- Autonomous scanning robots are the dominant robot type segment, projected to hold 54.0% share in 2026, influenced by scheduled aisle coverage without permanent sensor placement.
- Grocery chains are estimated to lead the end-user category with 46.0% share in 2026, aided by frequent replenishment activity across extensive assortments.
- Recognition accuracy and route coverage remain critical to supplier evaluation, as store associates benefit from prioritized exception lists that reduce repetitive shelf checks.
- The United States, European Union, and Japan are expected to form the higher-growth country tier, advancing at 26.0%, 24.0%, and 23.0% CAGR respectively through 2036, supported by large chain networks, structured data practices, and compact-store automation expertise.
- Competition centers on Simbe Robotics, Brain Corporation, Badger Technologies, MetraLabs, Trax Retail, and Pensa Systems, with vendors differentiating through autonomous scanning platforms, managed services, and image-led shelf intelligence.
Analyst Perspective
"Retail shelf intelligence is becoming a store execution tool rather than a simple inventory monitoring system. Retailers are focusing on how quickly shelf data can be converted into replenishment actions, pricing corrections, and improved on-shelf availability without disrupting normal store operations. The platforms creating the greatest value are those that deliver dependable recognition accuracy, integrate with existing retail workflows, and enable store teams to resolve issues efficiently. Consistent field support and practical staff training will remain important as retailers expand deployments across larger store networks."
- Nikhil Kaitwade, Principal Consultant at Future Market Insights
Source: Future Market Insights market analysis, 2026.
How is Retail Shelf-Scanning & Inventory Robots Market segmented?
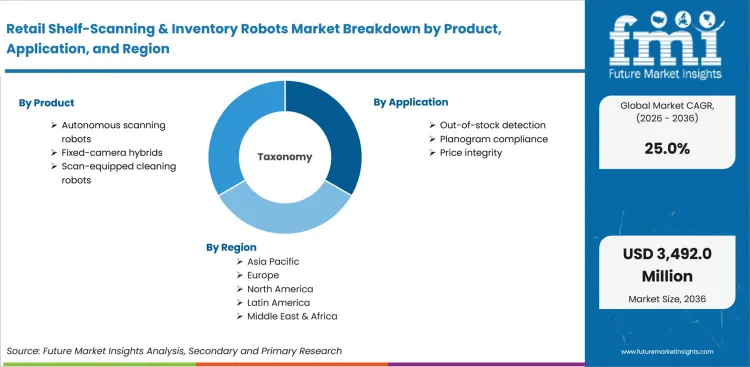
The retail shelf-scanning & inventory robots sector is segmented by product, application, component, end user, business model, and region.
The retail shelf-scanning & inventory robots sector is segmented by product, application, component, end user, business model, and region. Product coverage includes autonomous scanning robots with fixed-camera hybrids and scan-equipped cleaning robots. Application coverage includes out-of-stock detection with planogram compliance and price integrity. Component coverage includes hardware with AI software & analytics and services. End-user coverage includes grocery chains with mass merchandise and drug & convenience. Business-model coverage includes RaaS - subscription with direct and data services. Regional coverage includes North America and Latin America. Europe receives separate analysis with East Asia and South Asia. Oceania and Middle East and Africa complete geographic analysis.
Why do autonomous scanning robots shape product selection?
Simbe reported in October 2025 claiming Tally operated across 17 Harmons locations following a successful pilot, illustrating autonomous route value across a regional grocery network. Mobile platforms pair cameras with onboard computing to repeat aisle scans without permanent fixtures. Mapped routes allow service robotics platforms to preserve scan continuity as shelf layouts and merchandise positions change.
- Based on product, autonomous scanning robots are set to represent 54.0% share in 2026 as it is influenced by recurring aisle coverage and flexible redeployment across store formats. Retail teams assess route completion and image quality during operating hours to confirm dependable shelf evidence.
- Fixed-camera hybrids provide persistent observation across selected shelf zones requiring frequent review. Scan-equipped cleaning robots support dual-purpose programs seeking shelf data during established floor-care routes.
Why does out-of-stock detection lead application activity?
Out-of-stock workflows turn rapid shelf capture into prioritized checks for empty facings. Computer vision completes the process by translating aisle images into product-level tasks for replenishment teams. Pensa Systems reported in April 2025 noting its motion-based Vision AI operated 10x faster than legacy gap scanning and image comparison, promoting quicker exception discovery across store aisles.
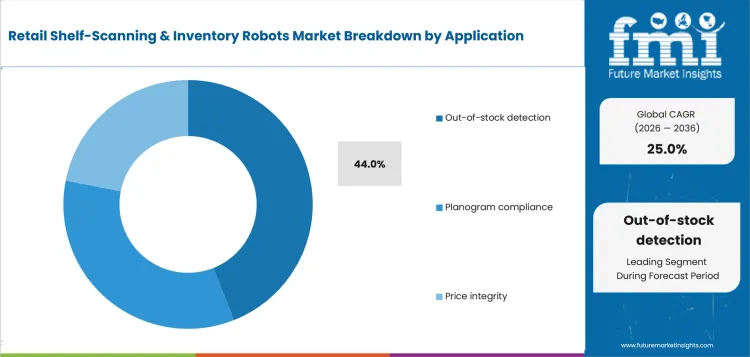
- Out-of-stock detection is anticipated to secure 44.0% share of application in 2026, driven by retailer concern over missed sales and inaccurate shelf availability. Operations teams evaluate alert precision and issue-resolution speed across store departments.
- Planogram compliance identifies misplaced products and incomplete promotional displays across planned layouts. Price integrity compares shelf information with store records to support accurate customer-facing labels.
Why does hardware lead component selection?
Badger Technologies reported in May 2025 highlighting its autonomous robot platform having improved inventory accuracy beyond 97% at a leading hardware retailer, demonstrating value from integrated sensors and mobile equipment. Cameras and processors gather shelf evidence during autonomous route completion. Platform robotics design then governs balance and safe aisle movement around shoppers and store employees.
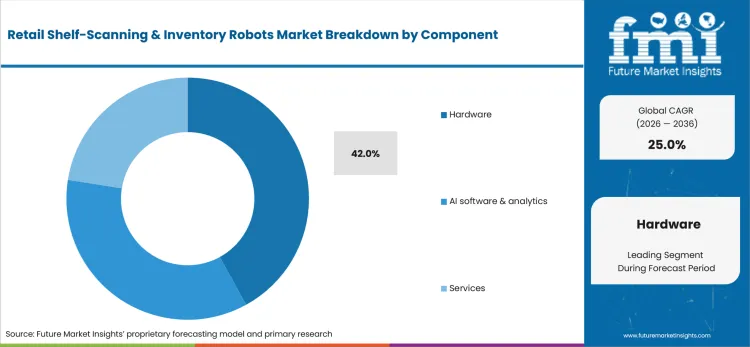
- By component, hardware is forecast to capture 42.0% share of component in 2026 since robots and sensors represent core equipment across mobile scanning programs. Retail teams compare camera resolution and battery duration with navigation quality across complete store routes.
- AI software & analytics convert captured images into prioritized shelf exceptions for store teams. Services support mapping and maintenance with fleet supervision across deployed locations.
Why do grocery chains lead end-user activity?
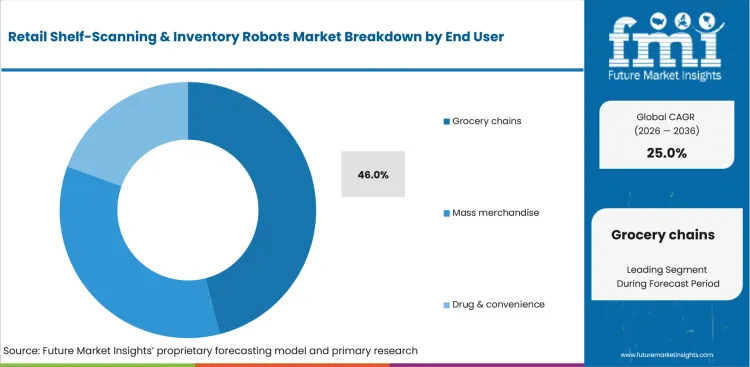
Walmart reported in April 2025 announcing its network to have included more than 10,750 stores worldwide, showing chain scale suited to standardized shelf-intelligence programs. Grocery assortments create repeated replenishment checks across packaged food and household products. Smart shelves extend shelf evidence between mobile scanning rounds across high-turn sections.
- Grocery chains are projected to hold 46.0% share of end user in 2026, guided by frequent stock movement and recurring availability checks across extensive assortments. Regional operators compare detected gaps and recovery speed across departments to evaluate operating gains.
- Mass merchandise retailers manage differing product dimensions across extensive selling areas requiring flexible scan routes. Drug & convenience outlets may favor compact systems or focused coverage across high-turn products.
How does RaaS - subscription retain business-model strength?
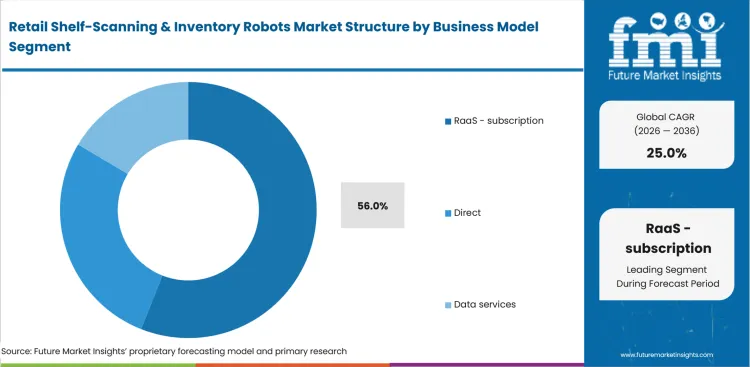
Subscription arrangements distribute deployment costs across contract periods and connect fleet operation with ongoing support. Managed service teams oversee fleet supervision and technical maintenance for retailers lacking internal robotics specialists. International Federation of Robotics reported in October 2025 stating robot-as-a-service fleets expanded by 31%, indicating greater commercial acceptance for recurring access across professional service applications.
- In 2026, RaaS - subscription is estimated to hold 56.0% share owing to recurring maintenance and managed software access across store networks. Retailers review service response and fleet uptime with contract flexibility during company selection.
- Direct models support internal ownership across operators preferring controlled equipment schedules. Data services may deliver shelf findings through retail analytics without transferring robot ownership.
What are drivers, restraints, and opportunities in Retail Shelf-Scanning & Inventory Robots Market?
Shelf-availability pressure and recurring inventory correction support robot evaluation. Recognition gaps and route disruption may delay regular store use.
- Driver: Retailers need recurring shelf evidence to correct phantom inventory and replenish empty facings sooner.
- Restraint: Route mapping and recognition quality may weaken across crowded aisles or changing promotional displays.
- Opportunity: Managed services and fixed-camera options may extend access across stores lacking internal robotics teams.
Frequent shelf-price changes and persistent inventory gaps encourage retailers to adopt automated scanning for faster corrective action. NVIDIA reported in January 2025 for about 89% of surveyed retail and CPG professionals actively used AI or assessed projects, encouraging shelf-recognition investment. Retailers are expected to combine scanning robots with electronic shelf label systems for quicker price and availability correction.
Deployment teams are likely to assess shopper interaction and aisle behavior during structured pilots. Chaysang and colleagues reported in November 2025 claiming a study to have surveyed 388 customers with frontline service-robot experience, identifying psychological comfort and technology anxiety as acceptance influences.
Simbe reported in October 2024 noting for 61% of surveyed shoppers were more likely to visit retailers using in-store robots, indicating acceptance potential for customer-facing scanning. Mixed automation portfolios are projected to coordinate shelf scans with warehouse robotics across backroom replenishment activity.
What country CAGRs are profiled in Retail Shelf-Scanning & Inventory Robots Market?
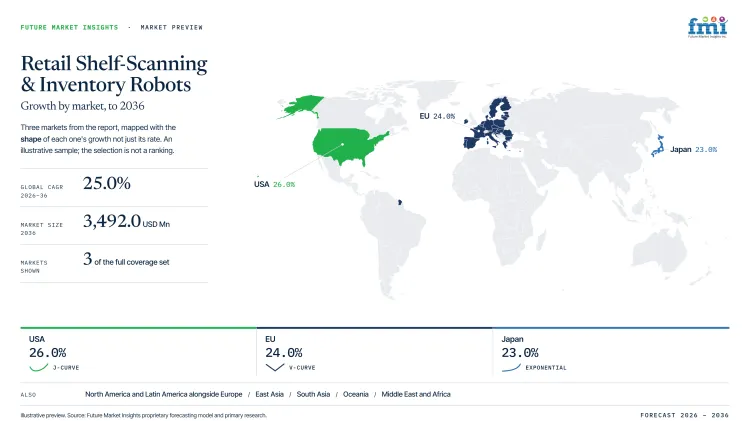
| Country or Market | CAGR |
|---|---|
| USA | 26.0% |
| EU | 24.0% |
| Japan | 23.0% |
Source: Future Market Insights country forecasting, 2026.
How do country-level CAGRs compare in the retail shelf-scanning & inventory robots market?
Country comparison shows a measured step-down across the profiled markets. United States records the upper rate followed by the European Union and Japan. A three-point spread indicates broadly comparable expansion prospects across all three markets. Relative positioning reflects differences in retail-network scale and store-automation readiness. European Union figures represent a regional average, allowing individual member countries to record different rates.
- United States leads the comparison and establishes North America as the primary expansion cluster among the markets shown.
- European Union follows with a moderate gap, indicating continued investment in structured shelf-data systems and connected retail operations.
- Japan records the lowest CAGR among the listed markets, yet its forecast remains prominent within the wider retail automation context.
- Pattern resembles a gradual downward slope instead of a sharp separation between quicker-expanding and slower-expanding markets.
Markets recording similar CAGRs may present different entry conditions due to store formats and service-network availability. Full report coverage provides country-level analysis across North America, Latin America, Europe, East Asia, South Asia, Oceania and the Middle East and Africa.
Country-wise Analysis
- Retail shelf-scanning & inventory robot sector in the United States is projected to expand at 26.0% CAGR between 2026 and 2036, backed by large store networks and active robotics programs. Extensive multi-location operations provide practical settings for testing scan consistency and issue resolution. USA Bureau of Labor Statistics reported in May 2026 for retail trade representing 16.1 million jobs during 2025, highlighting workforce scale suited to prioritized shelf tasks.
- Eurostat reported in February 2025 stating for 77% of EU internet users to have purchased goods or services online during 2024, increasing pressure for accurate omnichannel inventory. Structured data practices support measured integration across differing retail groups and national rules. Industry in the European Union is anticipated to rise at 24.0% CAGR during forecast period, aided by connected-commerce operations and formal deployment review.
- Compact store formats encourage companies to refine navigation and route planning for dense merchandising layouts. The market in Japan is estimated to record 23.0% CAGR from 2026 to 2036, guided by automation expertise and consistent inventory evidence. Ministry of Economy Trade and Industry reported in August 2025 announcing Japan to have recorded a 9.8% business-to-consumer e-commerce ratio during 2024, highlighting closer alignment between store inventory and online availability.
Who participates in Retail Shelf-Scanning & Inventory Robots Market?
Simbe Robotics and Brain Corporation support autonomous shelf-scanning programs. Badger Technologies and MetraLabs add mobile inventory platforms. Trax Retail and Pensa Systems provide image-led shelf intelligence. Vusion and Focal Systems address fixed-camera observation. Keonn Technologies and Dane Technologies support RFID-led and portable scanning activity.
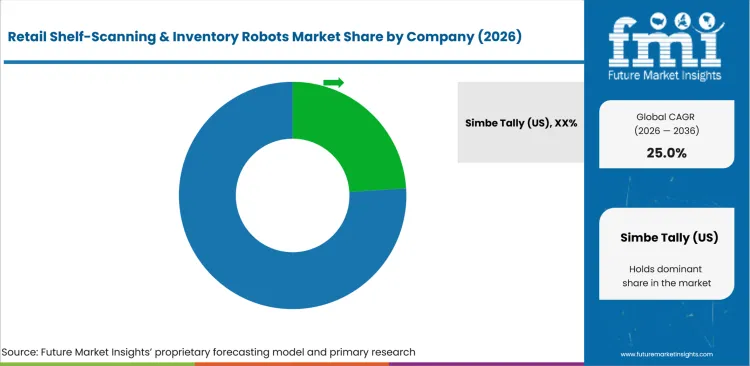
Competition in retail shelf-scanning & inventory robots is expected to depend on recognition accuracy and dependable route completion. Retail teams are likely to compare companies led by store coverage and integration support during pilot review. Simbe Robotics and Brain Corporation are expected to receive attention through autonomous platforms and managed services. Badger Technologies is projected to add multipurpose store equipment. Trax Retail and Pensa Systems are estimated to support shelf-image analysis across established retail programs. Vusion and Focal Systems are anticipated to compete across fixed-camera intelligence. Keonn Technologies and Dane Technologies are likely to strengthen RFID and portable scanning options. Providers connecting scan findings with artificial intelligence in retail systems are expected to support prioritized store action.
- Simbe Robotics and Brain Corporation are expected to receive review attention based on autonomous route depth and managed shelf-intelligence services. Retail programs are likely to assess recognition quality and operating responsiveness.
- Badger Technologies and MetraLabs are anticipated to compete depending on mobile inventory platforms and store-navigation experience. Grocery teams are projected to compare route completion and employee workflow support.
- Trax Retail and Pensa Systems are forecast to support image-led availability and planogram applications. Integration depth is expected to influence alert delivery and issue correction.
- Vusion and Focal Systems are likely to serve fixed-camera programs requiring frequent shelf observation. Keonn Technologies and Dane Technologies are anticipated to support RFID-led or portable scanning deployments.
Competitive Benchmarking: Retail Shelf-Scanning & Inventory Robots Market
| Company | Portfolio Depth | Retail Match | Service Support | Service Reach |
|---|---|---|---|---|
| Simbe Robotics, Inc. | High | High | High | United States and global |
| Brain Corporation | High | High | High | United States and global |
| Badger Technologies | High | High | High | United States |
| Trax Retail | High | High | High | Singapore and global |
| Pensa Systems, Inc. | Medium | High | Medium | United States and global |
| Vusion | High | High | High | France and global |
| Focal Systems, Inc. | High | High | Medium | United States and global |
| MetraLabs GmbH | Medium | High | Medium | Germany and Europe |
| Keonn Technologies, S.L. | Medium | Medium | Medium | Spain and global |
| Dane Technologies, Inc. | Medium | High | Medium | United States |
Source: Future Market Insights competitive analysis, 2026.
Key Developments in Retail Shelf-Scanning & Inventory Robots Market
- In June 2025, VusionGroup announced a Carrefour connected-store pilot using approximately 500 cameras for automated shelf monitoring. Captana connected camera evidence with urgent shelf tasks, improving detection of gaps and misplaced products across instrumented aisles.
- In September 2025, Brain Corporation launched ShelfOptix with Driveline through a managed service supported by more than 15,000 field representatives. National field coverage reduced setup responsibility for retailers seeking shelf intelligence without internal robot-management teams.
- In January 2026, Simbe Robotics introduced Tally 4.0 with operating duration reaching 12 hours. Extended runtime influenced denser scan schedules and more frequent shelf updates across long operating days.
Key Players in Retail Shelf-Scanning & Inventory Robots Market
Autonomous scanning and managed robotics companies
- Simbe Robotics, Inc.
- Brain Corporation
- Badger Technologies
- MetraLabs GmbH
Shelf intelligence and fixed-sensor specialists
- Trax Retail
- Pensa Systems, Inc.
- Vusion
- Focal Systems, Inc.
RFID and portable scanning providers
- Keonn Technologies, S.L.
- Dane Technologies, Inc.
Retail Shelf-Scanning & Inventory Robots Market Report Scope
| Coverage field | Report scope |
|---|---|
| Market breakdown | Retail Shelf-Scanning & Inventory Robots Market breakdown by product alongside application, component, end user, business model, and region |
| Quantitative Units | USD million in 2026 to USD million by 2036 at a CAGR |
| Market Definition | Retail shelf-scanning & inventory robots include mobile and fixed systems supporting shelf availability checks, planogram review, price verification and inventory location. |
| Regions Covered | North America and Latin America alongside Europe, East Asia, South Asia, Oceania, Middle East and Africa |
| Countries Covered | United States and Canada alongside Brazil, Mexico, Argentina, Germany, United Kingdom, France, Italy, Spain, China, Japan, South Korea, India, Thailand, Indonesia, Australia, New Zealand, GCC countries, South Africa and Turkey |
| Key Companies Profiled | Simbe Robotics, Inc. and Brain Corporation alongside Badger Technologies, MetraLabs GmbH, Trax Retail, Pensa Systems, Inc., Vusion, Focal Systems, Inc., Keonn Technologies, S.L. and Dane Technologies, Inc. |
| Forecast Period | 2026 to 2036 |
| Approach | Hybrid bottom-up and top-down methodology using segment share, country CAGR, retail task exposure, product portfolio depth, field evidence and service coverage |
Source: Future Market Insights report design, 2026.
Retail Shelf-Scanning & Inventory Robots Market - Research Methodology
| Method | Approach |
|---|---|
| Primary Research | FMI analysts gathered input from manufacturers, service providers, technology developers, distributors, end users, procurement teams, and subject-matter experts. Interviews examined purchasing decisions, product or service evaluation, adoption barriers, approval requirements, pricing considerations, and expectations for technical or commercial support. Respondents were also asked what evidence is required before a trial, pilot, or initial order develops into regular purchasing. |
| Desk Research | Desk research covered government statistics, regulatory publications, trade data, industry associations, technical literature, standards, company filings, product information, and official corporate announcements. Sources were reviewed for relevance, publication date, geographic coverage, and consistency with the defined market scope. Claims relating to performance, applications, approvals, capacity, investment, and commercial activity were retained only when supported by credible public evidence. |
| Market Sizing and Forecasting | The market model combined the baseline value with historical performance, segment structure, pricing and volume indicators, adoption levels, company participation, and country-level demand conditions. Forecast assumptions considered economic activity, investment trends, regulatory developments, technology adoption, purchasing cycles, supply availability, and barriers to wider market use. Segment and regional estimates were reconciled before the final market total was calculated. |
| Data Validation | Estimates were checked against multiple independent indicators, including public data, company activity, trade patterns, industry developments, and findings from primary interviews. Validation also tested whether products, services, applications, and company revenues fell within the defined market boundaries. Adjacent categories, unsupported claims, overlapping revenues, and activities without direct market relevance were excluded to reduce double counting and maintain consistency across segments and countries. |
Source: Future Market Insights research methodology, 2026.
Retail Shelf-Scanning & Inventory Robots Market by Segments
Retail Shelf-Scanning & Inventory Robots Market segmented by Product:
- Autonomous scanning robots
- Fixed-camera hybrids
- Scan-equipped cleaning robots
Retail Shelf-Scanning & Inventory Robots Market segmented by Application:
- Out-of-stock detection
- Planogram compliance
- Price integrity
Retail Shelf-Scanning & Inventory Robots Market segmented by Component:
- Hardware
- AI software & analytics
- Services
Retail Shelf-Scanning & Inventory Robots Market segmented by End User:
- Grocery chains
- Mass merchandise
- Drug & convenience
Retail Shelf-Scanning & Inventory Robots Market segmented by Business Model:
- RaaS - subscription
- Direct
- Data services
Retail Shelf-Scanning & Inventory Robots Market segmented by Region:
- North America
- United States
- Canada
- Latin America
- Brazil
- Mexico
- Argentina
- Europe
- Germany
- United Kingdom
- France
- Italy
- Spain
- East Asia
- China
- Japan
- South Korea
- South Asia
- India
- Thailand
- Indonesia
- Oceania
- Australia
- New Zealand
- Middle East and Africa
- GCC countries
- South Africa
- Turkey
Research Sources and Bibliography
- Impinj, Inc. (2024, December 11). New Impinj research reveals top headaches for supply chain managers for 2025.
- Honeywell. (2025, January 15). 5 retail trends changing the way you shop in 2025.
- Simbe Robotics. (2025, October 29). Harmons deploys Simbe’s Tally inventory robot in stores following pilot success.
- Pensa Systems. (2025, April 24). Pensa Systems wins Shelf Monitoring Solution of the Year for the third consecutive year.
- Badger Technologies. (2025, May 8). Badger Technologies launches Digital Teammate platform powered by next-generation multipurpose autonomous robots.
- Walmart Inc. (2025, April 9). Walmart showcases business strategy focused on driving growth and shareholder value.
- International Federation of Robotics. (2025, October 7). World Robotics 2025 report: Service robots released by IFR.
- NVIDIA. (2025, January 10). AI gets real for retailers: 9 out of 10 retailers now adopting or piloting AI, latest NVIDIA survey finds.
- Chaysang, A., Patterson, P., Kimpakorn, N., & Chaisuwan, C. (2025, November 4). Determinants of customer acceptance of frontline service robots in a retail context. Journal of Services Marketing, 39(10), 165-178.
- Simbe Robotics. (2024, October 1). Simbe announces international expansion into Turkey with CarrefourSA as new study underscores positive shopper sentiment for in-store robots.
- USA Bureau of Labor Statistics. (2026, May 28). Wholesale and retail trade industries labor productivity.
- Eurostat. (2025, February 20). Online shopping in the EU keeps growing.
- Ministry of Economy, Trade and Industry. (2025, August 26). Results of FY2024 e-commerce market survey compiled.
- VusionGroup. (2025, June 12). Carrefour and VusionGroup test a new generation of connected stores with EdgeSense.
- Brain Corporation. (2025, September 29). Brain Corp and Driveline launch ShelfOptix: The first fully managed, robot-powered shelf intelligence service.
- Simbe Robotics. (2026, January 12). Simbe unveils Tally 4.0: The next generation of autonomous retail robot powering store intelligence via physical AI.
This bibliography is provided for reader reference and is not exhaustive. The full report contains the complete reference list and detailed citations.
This Report Answers
- What segments shape demand across product, application, component, end user, and business model?
- How do grocery and merchandise retailers evaluate retail shelf-scanning & inventory robots during structured pilots?
- How do country CAGRs differ across USA, EU, and Japan?
- What companies compete through mobile scanning and fixed-camera intelligence with service support?
- How are forecasts validated using a hybrid bottom-up and top-down approach?
- What factors do account teams address prior to multi-store expansion?
- How do recognition quality and route completion affect platform selection?
- What limits return on investment for teams adding retail shelf-scanning & inventory robots?
- How do shopper comfort and store-team training influence account approval?
- What company capabilities improve long-term confidence across retail networks?
Frequently Asked Questions
What supports demand in retail shelf-scanning & inventory robots market?
Demand is likely to receive support from retailers needing recurring shelf evidence across replenishment activity. Store teams are expected to favor platforms combining dependable recognition with responsive field service.
Who are notable companies in retail shelf-scanning & inventory robots market?
Notable companies are anticipated to include Simbe Robotics and Brain Corporation with other providers supporting mobile scanning. Competition is likely to reflect recognition quality with route performance and regional service access.
What restraint affects retail shelf-scanning & inventory robots market?
Deployment risk increases through weak recognition or unstable navigation across changing aisles and promotional layouts. Retailers may slow adoption if pilot results lack dependable exception accuracy or responsive technical support.
Why do executives track retail shelf-scanning & inventory robots market?
Executives are expected to track shelf-intelligence programs as availability performance affects sales execution and labor planning. Platform evidence and service responsiveness shape investment reviews across store networks.
What business problem does retail shelf-scanning & inventory robots market address?
Retail shelf-scanning & inventory robots address gaps between inventory records and products presented on store shelves. Store operators need recurring evidence supporting replenishment priorities and merchandising correction across busy operating periods.
What do account teams evaluate prior to selecting companies?
Account teams are likely to evaluate recognition quality with route completion and repeat-use reliability during pilots. Integration access and technical documentation are expected to guide final company review.
What limits return on investment for purchasing teams?
Return on investment weakens if store mapping or alert quality remains inconsistent during deployment programs. Low issue-resolution rates and interrupted routes reduce expected operating gains across participating store networks.
How do companies build long-term account confidence?
Companies build account confidence through consistent scan quality and evidence tailored to retail operations. Training records and responsive troubleshooting are projected to influence contract renewal trust.
Preview the report firsthand - request a free sample
Get SampleGet the brochure for pricing and purchase details.
Get PDFTable of Content
- Key Takeaways
- Market Size and CAGR
- Top Growth Driver
- Fastest Growing Segment
- Leading Region
- Key Companies
- Emerging Opportunities
- Executive Summary
- Global Market Outlook
- Demand-side Trends
- Supply-side Trends
- Technology Roadmap Analysis
- Analysis and Recommendations
- Analyst Perspective (What is happening? Why now? What should investors know?)
- Key Questions Answered
- How large is the market?
- What is the CAGR?
- What are key trends?
- Which region dominates?
- Who are the leaders?
- Market Overview
- Market Coverage / Taxonomy
- Market Definition / Scope / Limitations
- Research Methodology
- Chapter Orientation
- Analytical Lens and Working Hypotheses
- Market Structure, Signals, and Trend Drivers
- Benchmarking and Cross-market Comparability
- Market Sizing, Forecasting, and Opportunity Mapping
- Research Design and Evidence Framework
- Desk Research Programme (Secondary Evidence)
- Expert Input and Fieldwork (Primary Evidence)
- Tooling, Models, and Reference Databases
- Data Engineering and Model Build
- Quality Assurance and Audit Trail
- Market Background
- Market Dynamics (Drivers, Restraints, Opportunity, Trends)
- Scenario Forecast (Optimistic, Likely, Conservative)
- Impact Analysis
- AI Impact
- Sustainability Impact
- Regulatory Impact
- Technology Impact
- Consumer / Buyer Analysis
- Purchase Drivers
- Adoption Barriers
- Buyer Journey
- Opportunity Map Analysis
- Product Life Cycle Analysis
- Supply Chain Analysis
- Investment Feasibility Matrix
- Value Chain Analysis
- PESTLE and Porter's Analysis
- Regulatory Landscape
- Regional Parent Market Outlook
- Production and Consumption Statistics
- Import and Export Statistics
- Global Market Analysis and Forecast, 2021 to 2036
- Historical Market Size Value (USD Million) Analysis, 2021 to 2025
- Current and Future Market Size Value (USD Million) Projections, 2026 to 2036
- Y-o-Y Growth Trend Analysis
- Absolute $ Opportunity Analysis
- Global Market Pricing Analysis, 2021 to 2036
- Global Market Analysis and Forecast, By Product, 2021 to 2036
- Introduction / Key Findings
- Historical Market Size Value (USD Million) Analysis By Product, 2021 to 2025
- Current and Future Market Size Value (USD Million) Analysis and Forecast By Product, 2026 to 2036
- Autonomous scanning robots
- Fixed-camera hybrids
- Scan-equipped cleaning robots
- Autonomous scanning robots
- Y-o-Y Growth Trend Analysis By Product, 2021 to 2025
- Absolute $ Opportunity Analysis By Product, 2026 to 2036
- Global Market Analysis and Forecast, By Application, 2021 to 2036
- Introduction / Key Findings
- Historical Market Size Value (USD Million) Analysis By Application, 2021 to 2025
- Current and Future Market Size Value (USD Million) Analysis and Forecast By Application, 2026 to 2036
- Out-of-stock detection
- Planogram compliance
- Price integrity
- Out-of-stock detection
- Y-o-Y Growth Trend Analysis By Application, 2021 to 2025
- Absolute $ Opportunity Analysis By Application, 2026 to 2036
- Global Market Analysis and Forecast, By Component, 2021 to 2036
- Introduction / Key Findings
- Historical Market Size Value (USD Million) Analysis By Component, 2021 to 2025
- Current and Future Market Size Value (USD Million) Analysis and Forecast By Component, 2026 to 2036
- Hardware
- AI software & analytics
- Services
- Hardware
- Y-o-Y Growth Trend Analysis By Component, 2021 to 2025
- Absolute $ Opportunity Analysis By Component, 2026 to 2036
- Global Market Analysis and Forecast, By End User, 2021 to 2036
- Introduction / Key Findings
- Historical Market Size Value (USD Million) Analysis By End User, 2021 to 2025
- Current and Future Market Size Value (USD Million) Analysis and Forecast By End User, 2026 to 2036
- Grocery chains
- Mass merchandise
- Drug & convenience
- Grocery chains
- Y-o-Y Growth Trend Analysis By End User, 2021 to 2025
- Absolute $ Opportunity Analysis By End User, 2026 to 2036
- Global Market Analysis and Forecast, By Business Model, 2021 to 2036
- Introduction / Key Findings
- Historical Market Size Value (USD Million) Analysis By Business Model, 2021 to 2025
- Current and Future Market Size Value (USD Million) Analysis and Forecast By Business Model, 2026 to 2036
- RaaS - subscription
- Direct
- Data services
- RaaS - subscription
- Y-o-Y Growth Trend Analysis By Business Model, 2021 to 2025
- Absolute $ Opportunity Analysis By Business Model, 2026 to 2036
- Global Market Analysis and Forecast, By Region, 2021 to 2036
- Introduction
- Historical Market Size Value (USD Million) Analysis By Region, 2021 to 2025
- Current Market Size Value (USD Million) Analysis and Forecast By Region, 2026 to 2036
- North America
- Latin America
- Western Europe
- Eastern Europe
- East Asia
- South Asia and Pacific
- Middle East & Africa
- Market Attractiveness Analysis By Region
- North America Market Analysis and Forecast, By Country, 2021 to 2036
- Historical Market Size Value (USD Million) Trend Analysis By Market Taxonomy, 2021 to 2025
- Market Size Value (USD Million) Forecast By Market Taxonomy, 2026 to 2036
- By Country
- USA
- Canada
- By Product
- By Application
- By Component
- By End User
- By Business Model
- By Country
- Market Attractiveness Analysis
- By Country
- By Product
- By Application
- By Component
- By End User
- By Business Model
- Key Takeaways
- Latin America Market Analysis and Forecast, By Country
- Historical Market Size Value (USD Million) Trend Analysis By Market Taxonomy, 2021 to 2025
- Market Size Value (USD Million) Forecast By Market Taxonomy, 2026 to 2036
- By Country
- Brazil
- Mexico
- Chile
- Rest of Latin America
- By Product
- By Application
- By Component
- By End User
- By Business Model
- By Country
- Market Attractiveness Analysis
- By Country
- By Product
- By Application
- By Component
- By End User
- By Business Model
- Key Takeaways
- Western Europe Market Analysis and Forecast, By Country
- Historical Market Size Value (USD Million) Trend Analysis By Market Taxonomy, 2021 to 2025
- Market Size Value (USD Million) Forecast By Market Taxonomy, 2026 to 2036
- By Country
- Germany
- UK
- Italy
- Spain
- France
- Nordic
- BENELUX
- Rest of Western Europe
- By Product
- By Application
- By Component
- By End User
- By Business Model
- By Country
- Market Attractiveness Analysis
- By Country
- By Product
- By Application
- By Component
- By End User
- By Business Model
- Key Takeaways
- Eastern Europe Market Analysis and Forecast, By Country
- Historical Market Size Value (USD Million) Trend Analysis By Market Taxonomy, 2021 to 2025
- Market Size Value (USD Million) Forecast By Market Taxonomy, 2026 to 2036
- By Country
- Russia
- Poland
- Hungary
- Balkan & Baltic
- Rest of Eastern Europe
- By Product
- By Application
- By Component
- By End User
- By Business Model
- By Country
- Market Attractiveness Analysis
- By Country
- By Product
- By Application
- By Component
- By End User
- By Business Model
- Key Takeaways
- East Asia Market Analysis and Forecast, By Country
- Historical Market Size Value (USD Million) Trend Analysis By Market Taxonomy, 2021 to 2025
- Market Size Value (USD Million) Forecast By Market Taxonomy, 2026 to 2036
- By Country
- China
- Japan
- South Korea
- By Product
- By Application
- By Component
- By End User
- By Business Model
- By Country
- Market Attractiveness Analysis
- By Country
- By Product
- By Application
- By Component
- By End User
- By Business Model
- Key Takeaways
- South Asia and Pacific Market Analysis and Forecast, By Country
- Historical Market Size Value (USD Million) Trend Analysis By Market Taxonomy, 2021 to 2025
- Market Size Value (USD Million) Forecast By Market Taxonomy, 2026 to 2036
- By Country
- India
- ASEAN
- Australia & New Zealand
- Rest of South Asia and Pacific
- By Product
- By Application
- By Component
- By End User
- By Business Model
- By Country
- Market Attractiveness Analysis
- By Country
- By Product
- By Application
- By Component
- By End User
- By Business Model
- Key Takeaways
- Middle East & Africa Market Analysis and Forecast, By Country
- Historical Market Size Value (USD Million) Trend Analysis By Market Taxonomy, 2021 to 2025
- Market Size Value (USD Million) Forecast By Market Taxonomy, 2026 to 2036
- By Country
- Kingdom of Saudi Arabia
- Other GCC Countries
- Türkiye
- South Africa
- Other African Union
- Rest of Middle East & Africa
- By Product
- By Application
- By Component
- By End User
- By Business Model
- By Country
- Market Attractiveness Analysis
- By Country
- By Product
- By Application
- By Component
- By End User
- By Business Model
- Key Takeaways
- Key Countries Market Analysis
- USA
- Pricing Analysis
- Market Share Analysis, 2025
- By Product
- By Application
- By Component
- By End User
- By Business Model
- Canada
- Pricing Analysis
- Market Share Analysis, 2025
- By Product
- By Application
- By Component
- By End User
- By Business Model
- Mexico
- Pricing Analysis
- Market Share Analysis, 2025
- By Product
- By Application
- By Component
- By End User
- By Business Model
- Brazil
- Pricing Analysis
- Market Share Analysis, 2025
- By Product
- By Application
- By Component
- By End User
- By Business Model
- Chile
- Pricing Analysis
- Market Share Analysis, 2025
- By Product
- By Application
- By Component
- By End User
- By Business Model
- Germany
- Pricing Analysis
- Market Share Analysis, 2025
- By Product
- By Application
- By Component
- By End User
- By Business Model
- UK
- Pricing Analysis
- Market Share Analysis, 2025
- By Product
- By Application
- By Component
- By End User
- By Business Model
- Italy
- Pricing Analysis
- Market Share Analysis, 2025
- By Product
- By Application
- By Component
- By End User
- By Business Model
- Spain
- Pricing Analysis
- Market Share Analysis, 2025
- By Product
- By Application
- By Component
- By End User
- By Business Model
- France
- Pricing Analysis
- Market Share Analysis, 2025
- By Product
- By Application
- By Component
- By End User
- By Business Model
- India
- Pricing Analysis
- Market Share Analysis, 2025
- By Product
- By Application
- By Component
- By End User
- By Business Model
- ASEAN
- Pricing Analysis
- Market Share Analysis, 2025
- By Product
- By Application
- By Component
- By End User
- By Business Model
- Australia & New Zealand
- Pricing Analysis
- Market Share Analysis, 2025
- By Product
- By Application
- By Component
- By End User
- By Business Model
- China
- Pricing Analysis
- Market Share Analysis, 2025
- By Product
- By Application
- By Component
- By End User
- By Business Model
- Japan
- Pricing Analysis
- Market Share Analysis, 2025
- By Product
- By Application
- By Component
- By End User
- By Business Model
- South Korea
- Pricing Analysis
- Market Share Analysis, 2025
- By Product
- By Application
- By Component
- By End User
- By Business Model
- Russia
- Pricing Analysis
- Market Share Analysis, 2025
- By Product
- By Application
- By Component
- By End User
- By Business Model
- Poland
- Pricing Analysis
- Market Share Analysis, 2025
- By Product
- By Application
- By Component
- By End User
- By Business Model
- Hungary
- Pricing Analysis
- Market Share Analysis, 2025
- By Product
- By Application
- By Component
- By End User
- By Business Model
- Kingdom of Saudi Arabia
- Pricing Analysis
- Market Share Analysis, 2025
- By Product
- By Application
- By Component
- By End User
- By Business Model
- Türkiye
- Pricing Analysis
- Market Share Analysis, 2025
- By Product
- By Application
- By Component
- By End User
- By Business Model
- South Africa
- Pricing Analysis
- Market Share Analysis, 2025
- By Product
- By Application
- By Component
- By End User
- By Business Model
- USA
- Market Structure Analysis
- Competition Dashboard
- Competition Benchmarking
- Market Share Analysis of Top Players
- By Regional
- By Product
- By Application
- By Component
- By End User
- By Business Model
- Emerging Startups
- Innovation Benchmarking
- Competition Analysis
- Competition Deep Dive
- Simbe Tally (US)
- Overview
- Product Portfolio
- Profitability by Market Segments
- Sales Footprint
- Strategy Overview
- Marketing Strategy
- Product Strategy
- Channel Strategy
- Brain Corp scan (US)
- Badger Technologies (US)
- Trax (SG)
- Simbe Tally (US)
- Case Studies
- Success Stories
- Recent Developments
- Competition Deep Dive
- Assumptions & Acronyms Used


