Methodology

REV Air Curtain Market Forecast and Outlook 2025 to 2035

The global REV air curtain market is valued at USD 274.7 million in 2025 and is projected to reach USD 383.8 million by 2035, reflecting a CAGR of 3.4%. Growth in the early portion of the forecast period is supported by steady installation activity across retail entrances, industrial loading zones, and commercial buildings seeking to maintain indoor temperature stability and improve particulate control. Air curtains are used to limit air exchange at openings, reduce HVAC load, and support cleaner indoor environments. Product refinement focuses on quieter motor assemblies, more efficient airflow patterns, and improved control interfaces that allow systems to adjust output based on occupancy or door-open duration.

Through the later years of the forecast window, demand remains consistent as replacement cycles align with building-maintenance schedules and energy-efficiency targets. Adoption increases in facilities undergoing HVAC upgrades or operational retrofits, where air curtains are integrated to reduce heating and cooling losses. Manufacturers continue to improve blade geometry, fan performance, and mounting flexibility to suit varied entrance widths and installation constraints. By 2035, incremental gains in efficiency, durability, and automated control options sustain market progress, even as growth transitions toward a replacement-driven pattern in mature commercial and industrial sectors.

Quick Stats for REV Air Curtain Market

  • REV Air Curtain Market Value (2025): USD 274.7 million
  • REV Air Curtain Market Forecast Value (2035): USD 383.8 million
  • Forecast CAGR (2025 to 2035): 3.4%
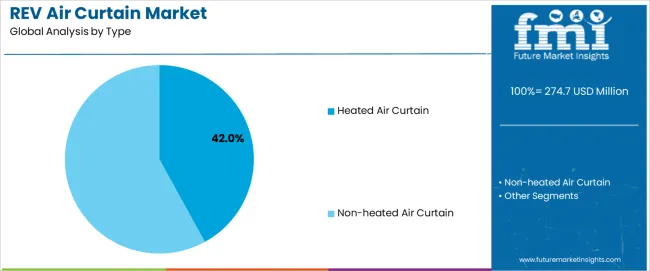
  • Leading Type: Heated Air Curtain (42.0%)
  • Key Growth Regions: East Asia, Europe, North America
  • Top Players: Berner International, Boon Edam, Systemair, Envirotec, Biddle, JS Air Curtains, Powered Aire, Airtecnics, Frico, Tekadoor, Stavoklima, NHS Air Curtains

Rev Air Curtain Market Market Value Analysis

What is the Growth Forecast for the REV Air Curtain Market through 2035?

Between 2025 and 2030, the REV Air Curtain Market grows from USD 274.7 million to USD 324.6 million, exhibiting a mild but consistent peak-to-trough pattern influenced by commercial construction cycles and HVAC system upgrades. The trough is observed in the early years (2025 to 2027), where annual increases of USD 7.9 million and USD 8.1 million reflect steady but moderate adoption. Demand improves mid-cycle as retail spaces, industrial facilities, and hospitality buildings expand investments in energy-efficient entryway systems. By 2029 to 2030, yearly gains rise to USD 10.6 million, marking the cycle’s first peak, driven by broader use of high-velocity thermal barriers and low-noise motor technologies.

From 2030 to 2035, the market rises from USD 324.6 million to USD 383.7 million, forming a second peak-to-trough sequence with slightly stronger momentum. The trough appears between 2030 to 2031 with a USD 10.1 million increase, followed by progressive acceleration as annual gains reach USD 12.6 million by 2034 to 2035. This late-cycle peak reflects growing adoption in logistics centers, cold-storage facilities, and large-format retail environments. Upgrades to variable-speed motors, improved heat-exchange efficiency, and integration with building automation systems strengthen demand. Across the decade, the market shows a stable upward peak-to-trough pattern supported by energy efficiency mandates and continued commercial infrastructure expansion.

REV Air Curtain Market Key Takeaways

Metric Value
Market Value (2025) USD 274.7 million
Market Forecast Value (2035) USD 383.8 million
Forecast CAGR (2025 to 2035) 3.4%

Why Is the REV Air Curtain Market Growing Across Commercial, Industrial, and Retail Facilities?

Demand for REV air curtains is rising as building operators seek to maintain stable indoor temperatures, reduce energy loss, and improve hygiene at high-traffic doorways. Air curtains form a controlled airflow barrier that limits infiltration of outdoor air, dust, and insects while allowing unobstructed entry for customers, staff, and material-handling equipment. Facilities in retail, warehousing, cold storage, and food service adopt REV air curtains to support HVAC efficiency and limit strain on heating or cooling systems during frequent door openings. Manufacturers refine motor efficiency, blade geometry, and airflow uniformity to ensure consistent barrier performance across varying door heights and environmental conditions. As energy-management requirements tighten in North America, Europe, and Asia-Pacific, operators increasingly integrate air curtains into broader efficiency strategies.

Market expansion is also supported by stronger hygiene and ventilation priorities in commercial buildings. REV air curtains help reduce cross-contamination risks in kitchens, laboratories, and healthcare-adjacent environments by controlling airborne particulates at entry points. Producers develop low-noise motors, variable-speed controls, and smart sensors that adjust airflow based on door position or occupancy levels. Integration with building management systems allows facilities to monitor performance and reduce operational costs through optimized runtime. Adoption increases in logistics centers and industrial settings where stable indoor environments are critical for equipment protection and worker comfort. Although installation costs and sizing complexity remain barriers for smaller sites, continued improvements in airflow modeling, motor durability, and energy-saving performance support steady global demand for REV air curtain systems.

How Do Functional Designs and Building Categories Shape Segmentation in the REV Air Curtain Market?

The REV air curtain market is segmented by type, application, and region. By type, the market is divided into heated air curtains and non-heated air curtains. Based on application, it is categorized into commercial buildings, residential buildings, industrial buildings, public infrastructure, and others. Regionally, the market is segmented into North America, Europe, East Asia, South Asia, Latin America, and the Middle East & Africa. These divisions reflect differences in climate conditions, building-use patterns, and regional adoption of controlled airflow barriers.
What Factors Support the Leading Position of Heated Air Curtains in Market Adoption?

Rev Air Curtain Market Analysis By Type

The heated air curtain segment accounts for approximately 42.0% of the global REV air curtain market in 2025, making it the leading type category. Its leadership is linked to its suitability for colder climates and entryways where temperature stabilization is required to reduce heat loss during frequent door openings. Heated air curtains provide a warm airflow barrier that limits cold drafts and supports consistent indoor temperature levels, which is important for buildings with high foot traffic. Their functions reduce HVAC strain by lowering warm-air escape, making them a practical choice for controlled environments in retail and public buildings.

Manufacturers supply heated units with adjustable temperature ranges, multi-speed blowers, and insulated housings that support reliable operation under varied load conditions. Adoption is significant in North America and Europe, where winter temperatures and energy-management requirements increase the need for thermal air barriers. Heated air curtains also suit facilities requiring improved comfort at building entrances, contributing to stable operational environments in locations with continuous occupant movement. The segment maintains its lead because heated airflow systems align with user expectations for indoor climate consistency, energy efficiency, and dependable performance in cold-weather building operations.
Why Do Commercial Buildings Represent the Largest Application Share in This Market?

Rev Air Curtain Market Analysis By Application

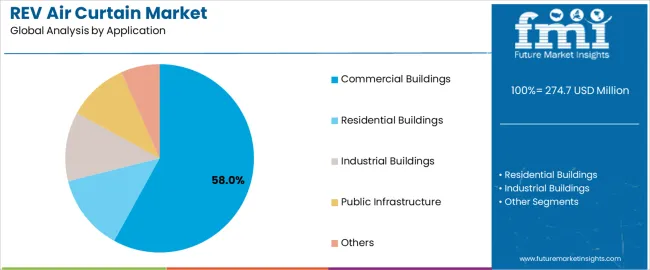
The commercial building segment represents about 58.0% of the total REV air curtain market in 2025, making it the dominant application category. This position reflects the high frequency of door openings in retail stores, supermarkets, office buildings, and hospitality facilities, where air curtains help maintain interior comfort and control particulate infiltration. Commercial environments rely on air curtains to reduce energy loss at entrances, stabilize temperature zones, and support hygiene management in areas where outdoor air can introduce dust or insects.

Manufacturers provide models sized for wide doorways, revolving doors, and multi-entry layouts commonly found in commercial properties. Adoption is strong in Europe, North America, and East Asia, where building codes and energy-efficiency guidelines encourage the use of airflow barriers. Commercial buildings also use air curtains to support zoning between customer areas and service corridors, helping maintain operational flow while reducing HVAC load. The segment holds its leading share because commercial facilities face continuous occupant movement, making controlled air barriers essential for maintaining environmental stability and supporting daily operational requirements.

What are the Key Trends, Drivers, and Restraints in the REV Air Curtain Market?

The REV air curtain market is growing as commercial buildings, industrial facilities and retail spaces adopt airflow barriers to improve indoor climate control and reduce energy loss. Air curtains create a continuous stream of air across doorways, helping maintain temperature zones and limiting dust, insects and outdoor contaminants from entering. Growth is supported by rising energy-efficiency requirements, increased construction of climate-controlled facilities and wider use of automated entrances. Adoption is limited by installation cost, maintenance needs and varied performance across building layouts. Manufacturers are enhancing airflow uniformity, noise reduction and control-system integration to suit diverse applications.

How are energy-efficiency goals influencing demand for REV air curtains?

Demand rises as facility owners aim to reduce heating and cooling losses around frequently used doorways. Air curtains help stabilize indoor temperatures by creating a protective air barrier, lowering HVAC load and improving occupant comfort. Sectors such as retail, cold storage, warehouses and hospitality rely on air curtains to minimize energy waste during high footfall or frequent door cycling. As building operators seek practical efficiency measures without major structural changes, air curtains become an attractive option for improving climate control at entry points.

What factors are limiting wider adoption of REV air curtain systems?

Adoption is moderated by upfront equipment and installation costs, which may deter small businesses or retrofits in older buildings. Effectiveness depends on correct sizing, mounting height and airflow balance, making professional installation essential. Units require periodic cleaning and filter checks to maintain performance, adding to maintenance burden. Noise and airflow feel can influence user acceptance in customer-facing environments. Variability in doorway conditions such as strong external winds or pressure imbalances can reduce performance, limiting adoption in challenging architectural layouts.

What trends are shaping next-generation air curtain design and technology?

Current trends include quieter motors, improved fan efficiency and electronically commutated (EC) drives that reduce power consumption. Manufacturers are integrating automatic controls that adjust airflow based on door activity, temperature sensors or building-management systems. Slimmer housings and customizable lengths support modern architectural aesthetics. In industrial settings, high-velocity models with better sealing performance are gaining traction. Interest is also rising in air curtains designed for hygiene-sensitive spaces such as food processing and laboratories. As market expectations evolve, air curtain systems continue advancing toward improved energy performance, better integration and lower operational noise.
What is the Analysis of the REV Air Curtain Market by Key Country?

Rev Air Curtain Market Cagr Analysis By Country

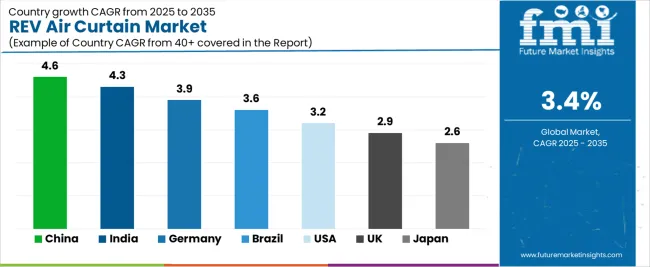
Country CAGR (%)
China 4.6%
India 4.3%
Germany 3.9%
Brazil 3.6%
USA 3.2%
UK 2.9%
Japan 2.6%

The REV Air Curtain Market is expanding steadily across global regions, with China leading at a 4.6% CAGR through 2035 due to strong commercial construction activity, rising HVAC modernization, and increasing adoption of energy-saving entrance technologies. India follows at 4.3%, driven by rapid retail and hospitality expansion, growing awareness of climate control efficiency, and demand for cost-effective air management solutions. Germany records 3.9%, reflecting strict energy-efficiency standards, advanced engineering applications, and widespread use in industrial and commercial facilities.

Brazil grows at 3.6%, supported by increased commercial infrastructure development and rising need for indoor air quality management. The USA, at 3.2%, remains a mature market emphasizing innovation in low-noise, high-efficiency systems, while the UK (2.9%) and Japan (2.6%) focus on compact, eco-friendly air curtain technologies optimized for dense urban commercial environments.

How Is Commercial Expansion Supporting Market Growth in China?

China is projected to grow at a CAGR of 4.6% through 2035 in the REV air curtain market. Increasing commercial construction and stricter indoor climate control standards drive demand for entrance air barrier solutions. Manufacturers supply variable-speed blowers, integrated control panels, and energy recovery features to reduce operational costs. Retail, healthcare, and logistics facilities adopt units to stabilise indoor conditions and limit HVAC load. Vendors integrate sensors for door status, occupancy detection, and adaptive airflow modulation to improve performance. Service agreements covering filter replacement and routine calibration extend operational reliability at multi-site deployments. Energy reporting features support compliance and budgeting.

  • Variable-speed blowers improve efficiency across varied door and traffic conditions.
  • Adaptive airflow modulation reduces HVAC load during peak occupancy periods.
  • Door sensors enable automated start stop to conserve energy.
  • Service contracts include filter changes, calibration, and performance reporting.

Why Is Retail Growth Increasing Adoption in India?

India is projected to grow at a CAGR of 4.3% through 2035 in the REV air curtain market. Rapid retail expansion and rising hygiene requirements increase adoption of entrance air barriers. Local manufacturers adapt modular designs with corrosion-resistant finishes for diverse climatic zones. Vendors add easy maintenance access, standardised mounts, and clear installation guides for installers. Energy-efficient motors and simple control interfaces lower lifecycle costs for small chains. Service networks support fast spare-part delivery and preventive checks in regional hubs. Regulatory guidance on indoor air quality further encourages installation in hospitals and schools. Operational tracking aids compliance and energy audits.
  • Corrosion-resistant finishes extend equipment life in coastal and humid areas.
  • Modular mounts simplify retrofits within existing door frames and openings.
  • Preventive checks reduce unexpected failures and onsite maintenance costs.
  • Standardised guides shorten installation time across widespread contractor networks.

How Do Energy Codes Shape Market Uptake in Germany?

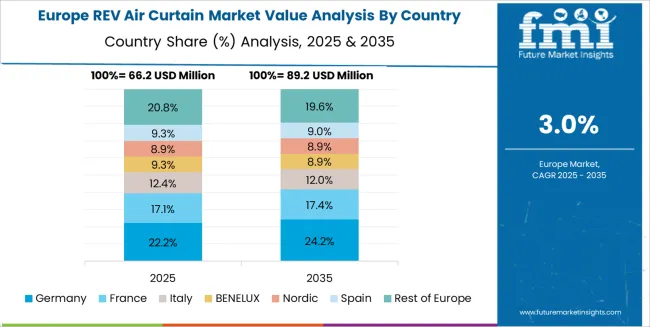
Rev Air Curtain Market Europe Country Market Share Analysis, 2025 & 2035

Germany is projected to grow at a CAGR of 3.9% through 2035 in the REV air curtain market. Strict energy codes and industrial hygiene expectations increase demand for certified air barrier systems. Manufacturers supply units meeting EU efficiency classes and low-noise standards for enclosed spaces. Facility managers select models with verified airflow profiles and documented test reports. Integration with building management systems provides remote monitoring and scheduled operation. Long-term maintenance contracts include annual calibration and performance validation certificates. Procurement focuses on lifecycle cost analysis, acoustic impact assessments, and contractor accreditation. Warranty terms often cover motor replacement and control module updates.

  • EU efficiency classes guide selection for energy-sensitive building projects.
  • Low-noise ratings support installations near offices and residential floors.
  • Lifecycle cost analysis includes energy, maintenance, and replacement forecasting.
  • Accredited contractors ensure compliant installation and validated performance results.

Why Are Climate and Tourism Patterns Shaping Demand in Brazil?

Brazil is projected to grow at a CAGR of 3.6% through 2035 in the REV air curtain market. Retail expansion, mall refurbishments, and climate control for tropical conditions support adoption. Manufacturers provide corrosion-resistant units and reinforced seals to combat humidity effects. Local service networks focus on rapid cartridge supply and onsite repairs. Energy-efficient fans and scheduled operation reduce running costs in high-temperature zones. Operators coordinate installations to align with seasonal tourism and peak retail periods. Regulatory focus on indoor air quality and HVAC integration influences product selection. Training improves maintenance capability.

  • Corrosion-resistant seals extend module life in humid coastal installations.
  • Scheduled operation reduces energy use during high ambient temperature periods.
  • Spare-part availability reduces downtime for high-traffic retail locations nationwide.
  • Installation timing aligns with tourism peaks to minimise disruption.

How Are Network and Facility Upgrades Affecting the United States?

Rev Air Curtain Market Country Value Analysis

USA is projected to grow at a CAGR of 3.2% through 2035 in the REV air curtain market. Retail chains, healthcare campuses, and cold storage facilities drive varied product demand. Manufacturers focus on UL listed controls, variable frequency drives, and durable motors. Integration with building automation and energy management platforms enables centralised scheduling. Service providers offer predictive maintenance subscriptions and remote performance dashboards for fleets. Procurement emphasises compliance with ventilation codes and indoor air quality metrics. Operational analytics inform retrofits, ROI calculations, and targeted replacement planning. Contractors provide rapid mobilisation and certified installation across regional outlet networks, with warranty support.

  • UL listing ensures electrical safety and simplified compliance checks.
  • Predictive maintenance subscriptions reduce unplanned downtime across multi-site fleets.
  • Integration with EMS enables centralised scheduling and energy reporting.
  • Certified installers ensure code-compliant mounting and warranty validity nationwide.

Why Are Planning Rules and Tenancy Agreements Driving UK Activity?

UK is projected to grow at a CAGR of 2.9% through 2035 in the REV air curtain market. Urban retail, hospitality refurbishments, and energy-efficiency targets influence procurement patterns. Manufacturers offer low-energy fans, discreet housings, and quiet operation options. Integration with automatic doors and occupancy detectors improves activation accuracy. Service providers include scheduled maintenance, testing logs, and performance certificates. Procurement emphasises lifecycle assessments, noise impact studies, and tenant comfort. Landlord agreements often determine access windows, installation permissions, and liability allocation during maintenance. Insurance underwriting and building regulations affect acceptable equipment specifications in sensitive sites. Tenant feedback informs placement and operation scheduling.
  • Low-energy fans reduce running costs across multi-store retail portfolios.
  • Tenant consultations improve placement to minimise disturbance and complaints.
  • Noise impact studies support planning approvals and landlord negotiations.
  • Scheduled testing logs provide documentation for compliance and warranties

How Is High Density Urban Design Influencing Japan?

Rev Air Curtain Market Japan Market Share Analysis By Type

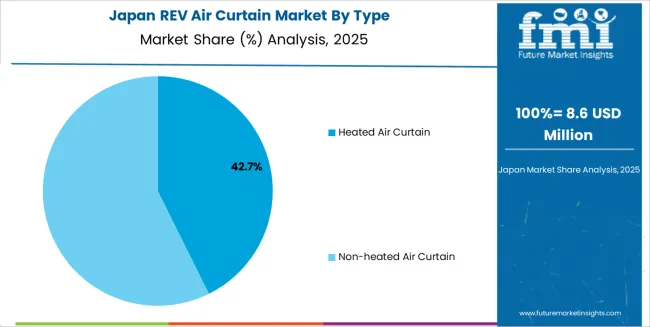
Japan is projected to grow at a CAGR of 2.6% through 2035 in the REV air curtain market. Demand centres on compact units suited to narrow entrances and dense layouts. Manufacturers design low-profile housings, precise airflow shaping, and low-noise fans. Integration with seismic restraints and cable management addresses regulatory requirements. Service contracts include scheduled inspections, vibration monitoring, and rapid spare supply. Procurement emphasises footprint constraints, energy use, and maintenance access during retrofits. Retailers and transport operators prefer modules with verified airflow models and installation guides. Noise certification aids acceptance in residential mixed-use developments and station concourses. Spare-part logistics reduce downtime.
  • Low-profile housings enable installation in narrow doorway and vestibule spaces.
  • Seismic restraints protect units and ensure compliance with building codes.
  • Vibration monitoring predicts failures before service interruption affecting uptime.
  • Rapid spare supply shortens mean time to repair significantly nationwide.

How Competitive Is the Global REV Air Curtain Market and What Defines Its Strategic Landscape?

Rev Air Curtain Market Analysis By Company

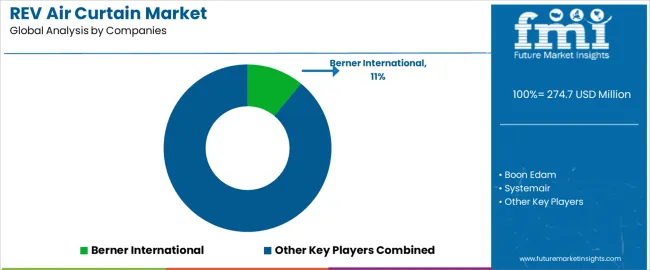
The global REV air curtain market shows moderate fragmentation, shaped by manufacturers supplying airflow barriers for commercial buildings, industrial facilities, retail spaces, and controlled-environment entrances. Berner International maintains a strong position through energy-efficient systems designed for continuous operation in high-traffic areas. Boon Edam and Systemair support upper-tier demand by integrating air curtains with revolving-door assemblies, HVAC controls, and automated entry systems.

Envirotec and Biddle strengthen mid-range competitiveness with units engineered for stable airflow, reduced turbulence, and reliable thermal separation across variable entry conditions. JS Air Curtains and Powered Aire broaden availability with product lines covering retail storefronts, food-service sites, and light-industrial installations where noise levels, mounting flexibility, and durability are key considerations.

Airtecnics and Frico expand the market with electronically regulated air curtains designed to maintain consistent discharge velocity and support energy-saving building-management systems. Tekadoor, Stavoklima, and NHS Air Curtains add further diversity through compact models, industrial high-performance units, and solutions tailored for cold-storage or climate-sensitive applications.

Competition across this segment is shaped by airflow uniformity, power efficiency, and compatibility with heating and cooling systems. Strategic differentiation depends on motor technology, mounting versatility, and the ability to meet building-code efficiency targets. As commercial facilities emphasize controlled entry environments and reduced HVAC loss, manufacturers delivering reliable, low-noise, and energy-efficient air curtains are positioned to strengthen long-term market presence.

Key Players in the REV Air Curtain Market

  • Berner International
  • Boon Edam
  • Systemair
  • Envirotec
  • Biddle
  • JS Air Curtains
  • Powered Aire
  • Airtecnics
  • Frico
  • Tekadoor
  • Stavoklima
  • NHS Air Curtains

Report Scope for REV Air Curtain Market

Items Values
Market Value (2025) USD million
Type Heated Air Curtain, Non-heated Air Curtain
Application Commercial Buildings, Residential Buildings, Industrial Buildings, Public Infrastructure, Others
Regions Covered East Asia, Europe, North America, South Asia, Latin America, Middle East & Africa
Countries Covered China, India, Germany, Brazil, USA, UK, Japan, and 40+ additional countries
Key Companies Profiled Berner International, Boon Edam, Systemair, Envirotec, Biddle, JS Air Curtains, Powered Aire, Airtecnics, Frico, Tekadoor, Stavoklima, NHS Air Curtains
Additional Attributes Dollar sales by type and application, OEM vs aftermarket split, channel mix (distributors, direct, online), commercial vs industrial pricing bands, typical project-level BOMs, case studies on energy-savings impacts, BMS integration options, smart-sensor add-ons (door-position, occupancy, temp).

REV Air Curtain Market Segmentations

Type:

  • Heated Air Curtain
  • Non-heated Air Curtain

Application:

  • Commercial Buildings
  • Residential Buildings
  • Industrial Buildings
  • Public Infrastructure
  • Others

Region:

  • East Asia

    • China
    • Japan
    • South Korea
    • Taiwan
    • Rest of East Asia
  • Europe

    • Germany
    • UK
    • France
    • Italy
    • Spain
    • Switzerland
    • Nordic
    • BENELUX
    • Rest of Europe
  • North America

    • USA
    • Canada
    • Mexico
  • South Asia

    • India
    • Pakistan
    • Bangladesh
    • Rest of South Asia
  • Latin America

    • Brazil
    • Argentina
    • Chile
    • Rest of Latin America
  • Middle East & Africa

    • Kingdom of Saudi Arabia
    • Other GCC Countries
    • Turkey
    • South Africa
    • Other African Union
    • Rest of Middle East & Africa
  • Eastern Europe

    • Russia
    • Poland
    • Czech Republic
    • Rest of Eastern Europe

Frequently Asked Questions

How big is the rev air curtain market in 2025?

The global rev air curtain market is estimated to be valued at USD 274.7 million in 2025.

What will be the size of rev air curtain market in 2035?

The market size for the rev air curtain market is projected to reach USD 383.8 million by 2035.

How much will be the rev air curtain market growth between 2025 and 2035?

The rev air curtain market is expected to grow at a 3.4% CAGR between 2025 and 2035.

What are the key product types in the rev air curtain market?

The key product types in rev air curtain market are heated air curtain and non-heated air curtain.

Which application segment to contribute significant share in the rev air curtain market in 2025?

In terms of application, commercial buildings segment to command 58.0% share in the rev air curtain market in 2025.

Table of Content

  1. Executive Summary
    • Global Market Outlook
    • Demand to side Trends
    • Supply to side Trends
    • Technology Roadmap Analysis
    • Analysis and Recommendations
  2. Market Overview
    • Market Coverage / Taxonomy
    • Market Definition / Scope / Limitations
  3. Market Background
    • Market Dynamics
      • Drivers
      • Restraints
      • Opportunity
      • Trends
    • Scenario Forecast
      • Demand in Optimistic Scenario
      • Demand in Likely Scenario
      • Demand in Conservative Scenario
    • Opportunity Map Analysis
    • Product Life Cycle Analysis
    • Supply Chain Analysis
    • Investment Feasibility Matrix
    • Value Chain Analysis
    • PESTLE and Porter’s Analysis
    • Regulatory Landscape
    • Regional Parent Market Outlook
    • Production and Consumption Statistics
    • Import and Export Statistics
  4. Global Market Analysis 2020 to 2024 and Forecast, 2025 to 2035
    • Historical Market Size Value (USD Million) Analysis, 2020 to 2024
    • Current and Future Market Size Value (USD Million) Projections, 2025 to 2035
      • Y to o to Y Growth Trend Analysis
      • Absolute $ Opportunity Analysis
  5. Global Market Pricing Analysis 2020 to 2024 and Forecast 2025 to 2035
  6. Global Market Analysis 2020 to 2024 and Forecast 2025 to 2035, By Type
    • Introduction / Key Findings
    • Historical Market Size Value (USD Million) Analysis By Type , 2020 to 2024
    • Current and Future Market Size Value (USD Million) Analysis and Forecast By Type , 2025 to 2035
      • Heated Air Curtain
      • Non-heated Air Curtain
    • Y to o to Y Growth Trend Analysis By Type , 2020 to 2024
    • Absolute $ Opportunity Analysis By Type , 2025 to 2035
  7. Global Market Analysis 2020 to 2024 and Forecast 2025 to 2035, By Application
    • Introduction / Key Findings
    • Historical Market Size Value (USD Million) Analysis By Application, 2020 to 2024
    • Current and Future Market Size Value (USD Million) Analysis and Forecast By Application, 2025 to 2035
      • Commercial Buildings
      • Residential Buildings
      • Industrial Buildings
      • Public Infrastructure
      • Others
    • Y to o to Y Growth Trend Analysis By Application, 2020 to 2024
    • Absolute $ Opportunity Analysis By Application, 2025 to 2035
  8. Global Market Analysis 2020 to 2024 and Forecast 2025 to 2035, By Region
    • Introduction
    • Historical Market Size Value (USD Million) Analysis By Region, 2020 to 2024
    • Current Market Size Value (USD Million) Analysis and Forecast By Region, 2025 to 2035
      • North America
      • Latin America
      • Western Europe
      • Eastern Europe
      • East Asia
      • South Asia and Pacific
      • Middle East & Africa
    • Market Attractiveness Analysis By Region
  9. North America Market Analysis 2020 to 2024 and Forecast 2025 to 2035, By Country
    • Historical Market Size Value (USD Million) Trend Analysis By Market Taxonomy, 2020 to 2024
    • Market Size Value (USD Million) Forecast By Market Taxonomy, 2025 to 2035
      • By Country
        • USA
        • Canada
        • Mexico
      • By Type
      • By Application
    • Market Attractiveness Analysis
      • By Country
      • By Type
      • By Application
    • Key Takeaways
  10. Latin America Market Analysis 2020 to 2024 and Forecast 2025 to 2035, By Country
    • Historical Market Size Value (USD Million) Trend Analysis By Market Taxonomy, 2020 to 2024
    • Market Size Value (USD Million) Forecast By Market Taxonomy, 2025 to 2035
      • By Country
        • Brazil
        • Chile
        • Rest of Latin America
      • By Type
      • By Application
    • Market Attractiveness Analysis
      • By Country
      • By Type
      • By Application
    • Key Takeaways
  11. Western Europe Market Analysis 2020 to 2024 and Forecast 2025 to 2035, By Country
    • Historical Market Size Value (USD Million) Trend Analysis By Market Taxonomy, 2020 to 2024
    • Market Size Value (USD Million) Forecast By Market Taxonomy, 2025 to 2035
      • By Country
        • Germany
        • UK
        • Italy
        • Spain
        • France
        • Nordic
        • BENELUX
        • Rest of Western Europe
      • By Type
      • By Application
    • Market Attractiveness Analysis
      • By Country
      • By Type
      • By Application
    • Key Takeaways
  12. Eastern Europe Market Analysis 2020 to 2024 and Forecast 2025 to 2035, By Country
    • Historical Market Size Value (USD Million) Trend Analysis By Market Taxonomy, 2020 to 2024
    • Market Size Value (USD Million) Forecast By Market Taxonomy, 2025 to 2035
      • By Country
        • Russia
        • Poland
        • Hungary
        • Balkan & Baltic
        • Rest of Eastern Europe
      • By Type
      • By Application
    • Market Attractiveness Analysis
      • By Country
      • By Type
      • By Application
    • Key Takeaways
  13. East Asia Market Analysis 2020 to 2024 and Forecast 2025 to 2035, By Country
    • Historical Market Size Value (USD Million) Trend Analysis By Market Taxonomy, 2020 to 2024
    • Market Size Value (USD Million) Forecast By Market Taxonomy, 2025 to 2035
      • By Country
        • China
        • Japan
        • South Korea
      • By Type
      • By Application
    • Market Attractiveness Analysis
      • By Country
      • By Type
      • By Application
    • Key Takeaways
  14. South Asia and Pacific Market Analysis 2020 to 2024 and Forecast 2025 to 2035, By Country
    • Historical Market Size Value (USD Million) Trend Analysis By Market Taxonomy, 2020 to 2024
    • Market Size Value (USD Million) Forecast By Market Taxonomy, 2025 to 2035
      • By Country
        • India
        • ASEAN
        • Australia & New Zealand
        • Rest of South Asia and Pacific
      • By Type
      • By Application
    • Market Attractiveness Analysis
      • By Country
      • By Type
      • By Application
    • Key Takeaways
  15. Middle East & Africa Market Analysis 2020 to 2024 and Forecast 2025 to 2035, By Country
    • Historical Market Size Value (USD Million) Trend Analysis By Market Taxonomy, 2020 to 2024
    • Market Size Value (USD Million) Forecast By Market Taxonomy, 2025 to 2035
      • By Country
        • Kingdom of Saudi Arabia
        • Other GCC Countries
        • Turkiye
        • South Africa
        • Other African Union
        • Rest of Middle East & Africa
      • By Type
      • By Application
    • Market Attractiveness Analysis
      • By Country
      • By Type
      • By Application
    • Key Takeaways
  16. Key Countries Market Analysis
    • USA
      • Pricing Analysis
      • Market Share Analysis, 2024
        • By Type
        • By Application
    • Canada
      • Pricing Analysis
      • Market Share Analysis, 2024
        • By Type
        • By Application
    • Mexico
      • Pricing Analysis
      • Market Share Analysis, 2024
        • By Type
        • By Application
    • Brazil
      • Pricing Analysis
      • Market Share Analysis, 2024
        • By Type
        • By Application
    • Chile
      • Pricing Analysis
      • Market Share Analysis, 2024
        • By Type
        • By Application
    • Germany
      • Pricing Analysis
      • Market Share Analysis, 2024
        • By Type
        • By Application
    • UK
      • Pricing Analysis
      • Market Share Analysis, 2024
        • By Type
        • By Application
    • Italy
      • Pricing Analysis
      • Market Share Analysis, 2024
        • By Type
        • By Application
    • Spain
      • Pricing Analysis
      • Market Share Analysis, 2024
        • By Type
        • By Application
    • France
      • Pricing Analysis
      • Market Share Analysis, 2024
        • By Type
        • By Application
    • India
      • Pricing Analysis
      • Market Share Analysis, 2024
        • By Type
        • By Application
    • ASEAN
      • Pricing Analysis
      • Market Share Analysis, 2024
        • By Type
        • By Application
    • Australia & New Zealand
      • Pricing Analysis
      • Market Share Analysis, 2024
        • By Type
        • By Application
    • China
      • Pricing Analysis
      • Market Share Analysis, 2024
        • By Type
        • By Application
    • Japan
      • Pricing Analysis
      • Market Share Analysis, 2024
        • By Type
        • By Application
    • South Korea
      • Pricing Analysis
      • Market Share Analysis, 2024
        • By Type
        • By Application
    • Russia
      • Pricing Analysis
      • Market Share Analysis, 2024
        • By Type
        • By Application
    • Poland
      • Pricing Analysis
      • Market Share Analysis, 2024
        • By Type
        • By Application
    • Hungary
      • Pricing Analysis
      • Market Share Analysis, 2024
        • By Type
        • By Application
    • Kingdom of Saudi Arabia
      • Pricing Analysis
      • Market Share Analysis, 2024
        • By Type
        • By Application
    • Turkiye
      • Pricing Analysis
      • Market Share Analysis, 2024
        • By Type
        • By Application
    • South Africa
      • Pricing Analysis
      • Market Share Analysis, 2024
        • By Type
        • By Application
  17. Market Structure Analysis
    • Competition Dashboard
    • Competition Benchmarking
    • Market Share Analysis of Top Players
      • By Regional
      • By Type
      • By Application
  18. Competition Analysis
    • Competition Deep Dive
      • Berner International
        • Overview
        • Product Portfolio
        • Profitability by Market Segments (Product/Age /Sales Channel/Region)
        • Sales Footprint
        • Strategy Overview
          • Marketing Strategy
          • Product Strategy
          • Channel Strategy
      • Boon Edam
      • Systemair
      • Envirotec
      • Biddle
      • JS Air Curtains
      • Powered Aire
      • Airtecnics
      • Frico
      • Tekadoor
      • Stavoklima
      • NHS Air Curtains
  19. Assumptions & Acronyms Used
  20. Research Methodology

List of Tables

  • Table 1: Global Market Value (USD Million) Forecast by Region, 2020 to 2035
  • Table 2: Global Market Value (USD Million) Forecast by Type , 2020 to 2035
  • Table 3: Global Market Value (USD Million) Forecast by Application, 2020 to 2035
  • Table 4: North America Market Value (USD Million) Forecast by Country, 2020 to 2035
  • Table 5: North America Market Value (USD Million) Forecast by Type , 2020 to 2035
  • Table 6: North America Market Value (USD Million) Forecast by Application, 2020 to 2035
  • Table 7: Latin America Market Value (USD Million) Forecast by Country, 2020 to 2035
  • Table 8: Latin America Market Value (USD Million) Forecast by Type , 2020 to 2035
  • Table 9: Latin America Market Value (USD Million) Forecast by Application, 2020 to 2035
  • Table 10: Western Europe Market Value (USD Million) Forecast by Country, 2020 to 2035
  • Table 11: Western Europe Market Value (USD Million) Forecast by Type , 2020 to 2035
  • Table 12: Western Europe Market Value (USD Million) Forecast by Application, 2020 to 2035
  • Table 13: Eastern Europe Market Value (USD Million) Forecast by Country, 2020 to 2035
  • Table 14: Eastern Europe Market Value (USD Million) Forecast by Type , 2020 to 2035
  • Table 15: Eastern Europe Market Value (USD Million) Forecast by Application, 2020 to 2035
  • Table 16: East Asia Market Value (USD Million) Forecast by Country, 2020 to 2035
  • Table 17: East Asia Market Value (USD Million) Forecast by Type , 2020 to 2035
  • Table 18: East Asia Market Value (USD Million) Forecast by Application, 2020 to 2035
  • Table 19: South Asia and Pacific Market Value (USD Million) Forecast by Country, 2020 to 2035
  • Table 20: South Asia and Pacific Market Value (USD Million) Forecast by Type , 2020 to 2035
  • Table 21: South Asia and Pacific Market Value (USD Million) Forecast by Application, 2020 to 2035
  • Table 22: Middle East & Africa Market Value (USD Million) Forecast by Country, 2020 to 2035
  • Table 23: Middle East & Africa Market Value (USD Million) Forecast by Type , 2020 to 2035
  • Table 24: Middle East & Africa Market Value (USD Million) Forecast by Application, 2020 to 2035

List of Figures

  • Figure 1: Global Market Pricing Analysis
  • Figure 2: Global Market Value (USD Million) Forecast 2020-2035
  • Figure 3: Global Market Value Share and BPS Analysis by Type , 2025 and 2035
  • Figure 4: Global Market Y-o-Y Growth Comparison by Type , 2025-2035
  • Figure 5: Global Market Attractiveness Analysis by Type
  • Figure 6: Global Market Value Share and BPS Analysis by Application, 2025 and 2035
  • Figure 7: Global Market Y-o-Y Growth Comparison by Application, 2025-2035
  • Figure 8: Global Market Attractiveness Analysis by Application
  • Figure 9: Global Market Value (USD Million) Share and BPS Analysis by Region, 2025 and 2035
  • Figure 10: Global Market Y-o-Y Growth Comparison by Region, 2025-2035
  • Figure 11: Global Market Attractiveness Analysis by Region
  • Figure 12: North America Market Incremental Dollar Opportunity, 2025-2035
  • Figure 13: Latin America Market Incremental Dollar Opportunity, 2025-2035
  • Figure 14: Western Europe Market Incremental Dollar Opportunity, 2025-2035
  • Figure 15: Eastern Europe Market Incremental Dollar Opportunity, 2025-2035
  • Figure 16: East Asia Market Incremental Dollar Opportunity, 2025-2035
  • Figure 17: South Asia and Pacific Market Incremental Dollar Opportunity, 2025-2035
  • Figure 18: Middle East & Africa Market Incremental Dollar Opportunity, 2025-2035
  • Figure 19: North America Market Value Share and BPS Analysis by Country, 2025 and 2035
  • Figure 20: North America Market Value Share and BPS Analysis by Type , 2025 and 2035
  • Figure 21: North America Market Y-o-Y Growth Comparison by Type , 2025-2035
  • Figure 22: North America Market Attractiveness Analysis by Type
  • Figure 23: North America Market Value Share and BPS Analysis by Application, 2025 and 2035
  • Figure 24: North America Market Y-o-Y Growth Comparison by Application, 2025-2035
  • Figure 25: North America Market Attractiveness Analysis by Application
  • Figure 26: Latin America Market Value Share and BPS Analysis by Country, 2025 and 2035
  • Figure 27: Latin America Market Value Share and BPS Analysis by Type , 2025 and 2035
  • Figure 28: Latin America Market Y-o-Y Growth Comparison by Type , 2025-2035
  • Figure 29: Latin America Market Attractiveness Analysis by Type
  • Figure 30: Latin America Market Value Share and BPS Analysis by Application, 2025 and 2035
  • Figure 31: Latin America Market Y-o-Y Growth Comparison by Application, 2025-2035
  • Figure 32: Latin America Market Attractiveness Analysis by Application
  • Figure 33: Western Europe Market Value Share and BPS Analysis by Country, 2025 and 2035
  • Figure 34: Western Europe Market Value Share and BPS Analysis by Type , 2025 and 2035
  • Figure 35: Western Europe Market Y-o-Y Growth Comparison by Type , 2025-2035
  • Figure 36: Western Europe Market Attractiveness Analysis by Type
  • Figure 37: Western Europe Market Value Share and BPS Analysis by Application, 2025 and 2035
  • Figure 38: Western Europe Market Y-o-Y Growth Comparison by Application, 2025-2035
  • Figure 39: Western Europe Market Attractiveness Analysis by Application
  • Figure 40: Eastern Europe Market Value Share and BPS Analysis by Country, 2025 and 2035
  • Figure 41: Eastern Europe Market Value Share and BPS Analysis by Type , 2025 and 2035
  • Figure 42: Eastern Europe Market Y-o-Y Growth Comparison by Type , 2025-2035
  • Figure 43: Eastern Europe Market Attractiveness Analysis by Type
  • Figure 44: Eastern Europe Market Value Share and BPS Analysis by Application, 2025 and 2035
  • Figure 45: Eastern Europe Market Y-o-Y Growth Comparison by Application, 2025-2035
  • Figure 46: Eastern Europe Market Attractiveness Analysis by Application
  • Figure 47: East Asia Market Value Share and BPS Analysis by Country, 2025 and 2035
  • Figure 48: East Asia Market Value Share and BPS Analysis by Type , 2025 and 2035
  • Figure 49: East Asia Market Y-o-Y Growth Comparison by Type , 2025-2035
  • Figure 50: East Asia Market Attractiveness Analysis by Type
  • Figure 51: East Asia Market Value Share and BPS Analysis by Application, 2025 and 2035
  • Figure 52: East Asia Market Y-o-Y Growth Comparison by Application, 2025-2035
  • Figure 53: East Asia Market Attractiveness Analysis by Application
  • Figure 54: South Asia and Pacific Market Value Share and BPS Analysis by Country, 2025 and 2035
  • Figure 55: South Asia and Pacific Market Value Share and BPS Analysis by Type , 2025 and 2035
  • Figure 56: South Asia and Pacific Market Y-o-Y Growth Comparison by Type , 2025-2035
  • Figure 57: South Asia and Pacific Market Attractiveness Analysis by Type
  • Figure 58: South Asia and Pacific Market Value Share and BPS Analysis by Application, 2025 and 2035
  • Figure 59: South Asia and Pacific Market Y-o-Y Growth Comparison by Application, 2025-2035
  • Figure 60: South Asia and Pacific Market Attractiveness Analysis by Application
  • Figure 61: Middle East & Africa Market Value Share and BPS Analysis by Country, 2025 and 2035
  • Figure 62: Middle East & Africa Market Value Share and BPS Analysis by Type , 2025 and 2035
  • Figure 63: Middle East & Africa Market Y-o-Y Growth Comparison by Type , 2025-2035
  • Figure 64: Middle East & Africa Market Attractiveness Analysis by Type
  • Figure 65: Middle East & Africa Market Value Share and BPS Analysis by Application, 2025 and 2035
  • Figure 66: Middle East & Africa Market Y-o-Y Growth Comparison by Application, 2025-2035
  • Figure 67: Middle East & Africa Market Attractiveness Analysis by Application
  • Figure 68: Global Market - Tier Structure Analysis
  • Figure 69: Global Market - Company Share Analysis
Dashboard
Dashboard
Dashboard
Dashboard
Dashboard
Dashboard

Our Research Products

Full Research Suite

The "Full Research Suite" delivers actionable market intel, deep dives on markets or technologies, so clients act faster, cut risk, and unlock growth.

Competitor Leaderboard Report

The Leaderboard benchmarks and ranks top vendors, classifying them as Established Leaders, Leading Challengers, or Disruptors & Challengers.

Future Leaders Index

Locates where complements amplify value and substitutes erode it, forecasting net impact by horizon

Market Data & Forecasts

We deliver granular, decision-grade intel: market sizing, 5-year forecasts, pricing, adoption, usage, revenue, and operational KPIs—plus competitor tracking, regulation, and value chains—across 60 countries broadly.

Market Focus Report

Spot the shifts before they hit your P&L. We track inflection points, adoption curves, pricing moves, and ecosystem plays to show where demand is heading, why it is changing, and what to do next across high-growth markets and disruptive tech

Survey Report

Real-time reads of user behavior. We track shifting priorities, perceptions of today’s and next-gen services, and provider experience, then pace how fast tech moves from trial to adoption, blending buyer, consumer, and channel inputs with social signals (#WhySwitch, #UX).

Bespoke Reports

Partner with our analyst team to build a custom report designed around your business priorities. From analysing market trends to assessing competitors or crafting bespoke datasets, we tailor insights to your needs.

Supplier Intelligence

Discovery & Profiling

Capacity & Footprint

Performance & Risk

Compliance & Governance

Commercial Readiness

Who Supplies Whom

Scorecards & Shortlists

Playbooks & Docs

Category Intelligence

Definition & Scope

Demand & Use Cases

Cost Drivers

Market Structure

Supply Chain Map

Trade & Policy

Operating Norms

Deliverables

Buyer Intelligence

Account Basics

Spend & Scope

Procurement Model

Vendor Requirements

Terms & Policies

Entry Strategy

Pain Points & Triggers

Outputs

Pricing Analysis

Benchmarks

Trends

Should-Cost

Indexation

Landed Cost

Commercial Terms

Deliverables

Brand Analysis

Positioning & Value Prop

Share & Presence

Customer Evidence

Go-to-Market

Digital & Reputation

Compliance & Trust

KPIs & Gaps

Outputs

Full Research Suite comprises of:

Market outlook & trends analysis

Market outlook & trends analysis

Interviews & case studies

Interviews & case studies

Strategic recommendations

Strategic recommendations

Vendor profiles & capabilities analysis

Vendor profiles & capabilities analysis

5-year forecasts

5-year forecasts

8 regions and 60+ country-level data splits

8 regions and 60+ country-level data splits

Market segment data splits

Market segment data splits

12 months of continuous data updates

12 months of continuous data updates

DELIVERED AS:

PDF EXCEL ONLINE

Full Research Suite


$5000

$7500

$10000

Buy Report Now
Similar Industry Reports

Similar Industry Reports

Reverse Tuck Box Market

Reverse Tuck Box Market Size and Share Forecast Outlook 2025 to 2035

Reverse Osmosis Pump Market

Reverse Osmosis Pump Market Size and Share Forecast Outlook 2025 to 2035

Revenue Assurance Market

Revenue Assurance Market Size and Share Forecast Outlook 2025 to 2035

Revenue Management Software Market

Revenue Management Software Market Size and Share Forecast Outlook 2025 to 2035

Revenue Management Solutions Market

Revenue Management Solutions Market Size and Share Forecast Outlook 2025 to 2035

Revolutionary Moisture Locking Systems Market

Revolutionary Moisture Locking Systems Market Size and Share Forecast Outlook 2025 to 2035

Reverse Cap Bottles Market

Reverse Cap Bottles Market Size and Share Forecast Outlook 2025 to 2035

Reverse Logistics Market

Reverse Logistics Market Size and Share Forecast Outlook 2025 to 2035

Revision Knee Replacement Market

Revision Knee Replacement Market Size and Share Forecast Outlook 2025 to 2035

Reverse Transcriptase Enzymes Market

Reverse Transcriptase Enzymes Market Size and Share Forecast Outlook 2025 to 2035

Reverse Osmosis (RO) Pump Market Share Analysis

Market Share Insights for Reverse Osmosis (RO) Pump Providers

Revivable Yeast Market

Revivable Yeast Market Outlook - Growth, Demand & Forecast 2024 to 2034

RevOps Platform Market

RevOps Platform Market Insights – Growth & Forecast 2023-2033

Reverse Tuck Cartons Market

Reverse Tuck Cartons Market

Preventive Medicine Market

Preventive Medicine Market Growth - Trends & Forecast 2025 to 2035

3D Reverse Engineering Software Market

3D Reverse Engineering Software Market Forecast and Outlook 2025 to 2035

Customer Revenue Optimization (CRO) Software Market

Customer Revenue Optimization (CRO) Software Market Size and Share Forecast Outlook 2025 to 2035

On-site Preventive Care Market

On-site Preventive Care Market Analysis - Size, Share, and Forecast Outlook 2025 to 2035

Embolic Prevention Systems Market

Embolic Prevention Systems Market

Blowout Preventers Market

Blowout Preventers Market

Future Market Insights

REV Air Curtain Market

Chat With MaRIA

Chat With

MaRIA

Hi There, I am MaRIA, Your Market Research Intelligence Assistant. How may I help you?