Reverse Tuck Box Market Size and Share Forecast Outlook From 2025 to 2035

The reverse tuck box market is experiencing sustained growth, supported by evolving packaging preferences across industries and increasing demand for customizable, eco-friendly solutions. Industry publications and packaging company press releases have emphasized the importance of reverse tuck boxes in streamlining product presentation, enhancing shelf appeal, and reducing material waste.

Their structure allows for easy assembly and secure closure, making them an efficient choice for high-speed packaging lines. Moreover, the market has benefited from advancements in digital printing and die-cutting technologies, enabling rapid prototyping and short-run customization across various sectors.

Sustainability-focused brands have also adopted reverse tuck boxes due to their recyclable nature and reduced use of adhesives. As global retail activity expands and e-commerce continues to grow, reverse tuck boxes are being adopted for their durability, branding potential, and cost-effective production. Looking forward, rising demand from sectors like food and beverage, pharmaceuticals, and personal care is expected to drive continued innovation and adoption, particularly in formats that support premium aesthetics and sustainable sourcing.
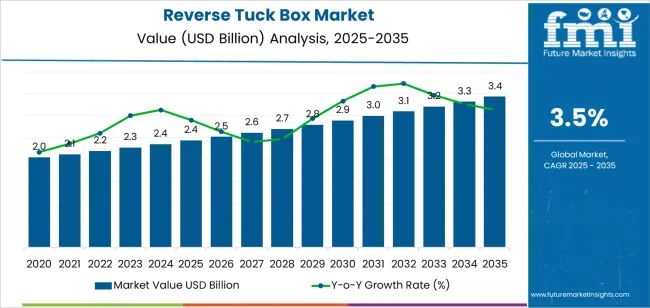
Quick Stats for Reverse Tuck Box Market

  • Reverse Tuck Box Market Industry Value (2025): USD 2.4 billion
  • Reverse Tuck Box Market Forecast Value (2035): USD 3.4 billion
  • Reverse Tuck Box Market Forecast CAGR: 3.5%
  • Leading Segment in Reverse Tuck Box Market in 2025: Standard (48.2%)
  • Key Growth Region in Reverse Tuck Box Market: North America, Asia-Pacific, Europe
  • Top Key Players in Reverse Tuck Box Market: Georgia Pacific, International Paper, Smurfit Kappa, Mondi Group, Cascades, Rose City Box, Lindquist & Co., LDC Packaging, E Molding International

Reverse Tuck Box Market Market Value Analysis

Metric Value
Reverse Tuck Box Market Estimated Value in (2025 E) USD 2.4 billion
Reverse Tuck Box Market Forecast Value in (2035 F) USD 3.4 billion
Forecast CAGR (2025 to 2035) 3.5%

Segmental Analysis

The market is segmented by Product Type, Application, and End Use and region. By Product Type, the market is divided into Standard, Double Reverse, Triple Reverse, Quadruple Reverse, Collapsible Reverse, and Others (Pillow Style, Telescoping, Modular). In terms of Application, the market is classified into Retail Packaging, E-Commerce Shipping, Storage & Inventory, and Gift Packing. Based on End Use, the market is segmented into Food & Beverage, Industrial, Pharmaceutical, and Medical. Regionally, the market is classified into North America, Latin America, Western Europe, Eastern Europe, Balkan & Baltic Countries, Russia & Belarus, Central Asia, East Asia, South Asia & Pacific, and the Middle East & Africa.
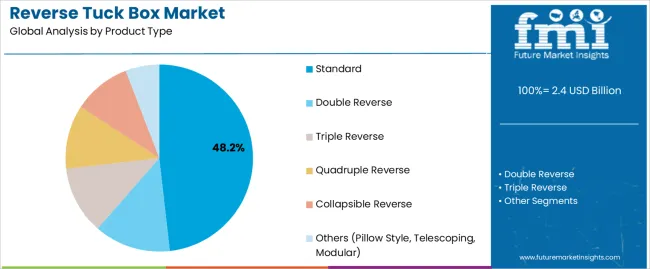
Insights into the Product Type Segment: Standard

Reverse Tuck Box Market Analysis By Product Type

The Standard segment is projected to account for 48.2% of the reverse tuck box market revenue in 2025, establishing itself as the leading product type. This dominance has been supported by the segment’s versatility, ease of use, and widespread compatibility with automated packaging systems.

Manufacturers have favored standard reverse tuck boxes for their simple design, which reduces production time and supports efficient storage and transport. Packaging engineers have also preferred this format due to its structural strength and adaptability across various product dimensions.

Additionally, brands in competitive retail environments have utilized standard reverse tuck boxes to optimize branding space without compromising packaging speed or cost. As production runs scale up and demand for shelf-ready packaging increases, the Standard segment is expected to maintain its market leadership due to its balance of performance, functionality, and cost-efficiency.
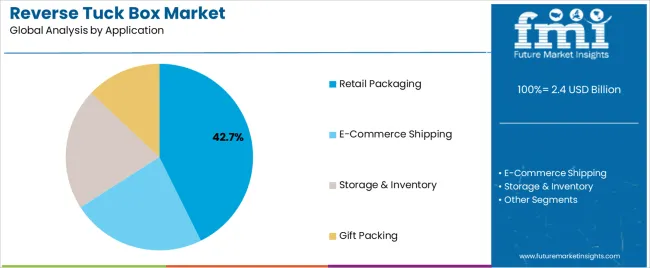
Insights into the Application Segment: Retail Packaging

Reverse Tuck Box Market Analysis By Application

The Retail Packaging segment is forecasted to contribute 42.7% of the reverse tuck box market revenue in 2025, continuing its lead among application categories. Growth in this segment has been driven by the increasing emphasis on product visibility, shelf differentiation, and brand communication in retail environments.

Retailers and product manufacturers have prioritized packaging that enhances unboxing experience while also being easy to stack and display. Reverse tuck boxes have proven effective in accommodating these needs, offering a compact and protective solution that supports high-quality printing and custom design.

Consumer goods companies have increasingly adopted this packaging for items such as cosmetics, electronics, and accessories, where presentation and structural integrity are critical. Furthermore, the proliferation of premium and niche retail brands has reinforced demand for packaging that aligns with brand aesthetics and sustainability goals. These factors are expected to ensure the continued prominence of the Retail Packaging segment in the market.
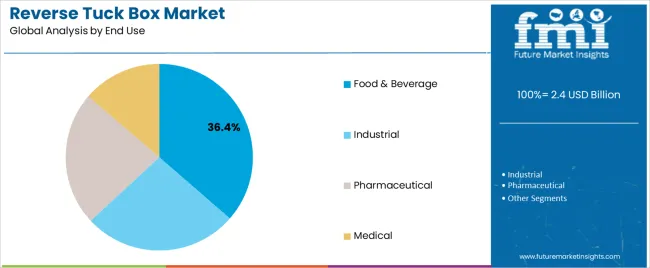
Insights into the End Use Segment: Food & Beverage

Reverse Tuck Box Market Analysis By End Use

The Food & Beverage segment is projected to represent 36.4% of the reverse tuck box market revenue in 2025, positioning it as the leading end-use industry. This growth has been fueled by the rising need for safe, tamper-evident, and visually appealing packaging formats in the highly regulated food sector.

Producers of teas, snacks, confectionery, and nutritional supplements have increasingly relied on reverse tuck boxes for secondary packaging due to their ability to accommodate detailed labeling, barcoding, and branding elements. Industry regulations have further emphasized packaging hygiene and traceability, both of which are supported by the structural integrity of reverse tuck formats.

In addition, the shift toward premium and organic food products has driven adoption of packaging that combines sustainability with a high-end appearance. As consumer demand for recyclable and functional food packaging continues to rise, the Food & Beverage segment is expected to remain a primary driver of reverse tuck box utilization.

Top Reverse Tuck Box Market Dynamics and Industry Trends

Reverse Tuck Box Trend Cultivates in the Gift Packaging Industry

Reverse tuck boxes are a popular choice in the gift packaging market because of how well they can package a wide range of goods, including drinks, food, jewelry, electronics, and cosmetics.

These boxes are a desirable option for shielding goods from harm because of their strength, reusability, and appealing look. Gift boxes are becoming more and more in demand in the upcoming decade.

Leading brands like Karl Knauer KG and DS Smith plc are pioneers in gift wrapping and personalized printing on tuck boxes, offering customizable options to cater to diverse customer preferences. Meanwhile, Zazzle and Etsy focus on minimalist designs for their tuck boxes, catering to a different market segment that values simplicity and elegance.

The corporate gifting culture is also anticipated to evolve as companies increasingly use these boxes to market themselves and build stronger relationships with their clients and employees.

This shift towards corporate giving is foreseen to compel further market expansion. The growing ubiquity of corrugated reverse tuck boxes, known for their strength, reusability, and visual appeal, is set to bolster market growth.

Given their usefulness and aesthetic appeal, which make them a popular option for both customers and businesses, reverse tuck boxes are anticipated to play a significant part in the gift packaging sector.

Incorporation of Sustainable Alternatives to Benefit the Reverse Tuck Box Industry

The increased need for consumer goods, paper boxes for medical components, and ecological products is driving the reverse tuck box business.

Growth in sales is anticipated to be pushed by government limitations on the use of plastic and public awareness of the advantages of eco-friendly packaging, underscoring the need for workable and environmentally acceptable packaging solutions.

The reverse tuck box industry is boosting as a result of betterment in packaging, environmental concerns, and the growing need for thin, recyclable, reusable paper boxes made of materials like paperboard and kraft paper. Because these eco-friendly alternatives follow the global trend toward greener practices, they attract more clients and businesses.

Consumers prefer stiff paper packaging, so there should be more development potential for the reverse tuck box business. Such a trend is predicted to spur innovation and expansion in the packaging sector because of its robustness and visual appeal.

Due to rising environmental concerns, regulatory compliance, and demand for sustainable packaging, the reverse tuck box market is augmenting significantly. Expansion is being manipulated by improvements in packaging technologies and a demand for recyclable materials. The market is poised to benefit from these prospects as stiff, paper-based packaging gains popularity.

E-commerce Integration of Reverse Tuck Boxes Boost Industry

The e-commerce sector is predicted to increase demand for reverse tuck boxes because of the growing quantity of online purchases throughout the globe. These adaptable, sturdy, and flexible packaging options guarantee safe and effective product transportation for a variety of sectors.

Their versatile design guarantees product integrity, which makes them an essential choice for a range of packaging requirements.

As companies and customers grow more ecologically, conscientious, multi-use tuck boxes are foreseen to become common. Packaging waste may be decreased by using reusable packaging options, such as reverse tuck cartons. Tuck boxes are still often used as one-time-use objects, which raises questions about packaging waste and its effects on the environment.

Environmental consciousness in the e-commerce industry is driving the adoption of sustainable packaging options. Businesses are spending money on packaging that satisfies requirements for product protection and supports ecological objectives.

Reverse tuck boxes, with their reputation for durability and versatility, are an important part of this change. Promoting recycling and reuse of this kind of packaging can assist the sector in lessening its environmental impact and advancing a more sustainable future.

Comparison of Historical vs Forecast Outlook for Reverse Tuck Box Sales (2020 to 2024 vs 2025 to 2035)

The reverse tuck box industry heavily relies on the general population's changing consumer preferences and lifestyle trends. Increasing emphasis on sustainability and reusability is also likely to impact the demand for reusable boxes.

Besides this, technological developments such as hide and lock tuck, waterproof paper, and easy stick lids in the production processes and increasing research and development have also impacted the industry in the past.

The industry in the period between 2020 to 2025 exhibited a CAGR of 2.9%. Reverse tuck boxes are positioned to benefit from the growing trend of food delivery because of their reputation for efficiently using space in shipping, transit, and retailing during points of sale.

The future is bright for producers and merchants of reverse tuck boxes since millennials are driving this trend with their need for simple purchasing and quick delivery. The reverse tuck box market size expects a considerable valuation bump from USD 1,978.3 million in 2020 to USD 2,282.3 million in 2025.

After 2025, consumers and major industry players are anticipated to be embracing biodegradable packaging options more and more. Paper boxes are a common option because of their easy recycling and eco-friendliness. Reverse tuck boxes are growing more prevalent than alternatives made of plastic, and such a trend is fueling the sales of reverse tuck boxes.

Consumer desire for environmentally friendly packaging and growing environmental consciousness are the enterprising forces behind reusable tuck boxes.

Businesses provide reusable packaging options, and stringent policies and initiatives minimize the usage of single-use plastics. Recyclable tuck boxes are being used because of a mix of customer needs, legal restrictions, and company sustainability objectives.

Analysis of Top Countries Manufacturing and Using Reverse Tuck Boxes

The section discusses the region-wise analysis of the reverse tuck box industry. Data on key countries in several regions of the globe, including North America, Asia Pacific, Europe, and others, is provided.

Canada is anticipated to remain at the forefront in North America, with a CAGR of 3.4% through 2035. In South Asia and the Pacific, India is projected to witness a CAGR of 4.1% by 2035, leaving behind China at 3.6%.

Countries Value CAGR (2025 to 2035)
United States 3.3%
Canada 3.4%
Germany 3.2%
United Kingdom 3.1%
India 4.1%
China 3.6%

Rise of Visually Appealing Boxes in India

The Indian reverse tuck box industry is showcasing a healthy CAGR of 4.1% for the forecast period of 2025 to 2035. Sustainable practices are equally as important in India's food and beverage packaging industry as innovation. Food packaging makers are driving the market for reverse tuck boxes by developing unique designs.

Producing their goods in visually appealing structures, confectionery manufacturers are also contributing to the market's anticipated increase in profitability. In response to the movement toward sustainability, regional developers are increasing the need for tuck boxes and ensuring a bright future for the sector.

Chinese Reverse Tuck Box Industry to Exhibit Decent Growth Rate

China is also a lucrative marketplace for the reverse tuck box industry. It is slated to showcase a CAGR of 3.6% through 2035. China's booming online retail industry notably impacts the need for reverse tuck boxes. The need for efficient and eco-friendly packaging solutions to manage the rise in package delivery is growing as more consumers make purchases online.

Reverse tuck box designs that are creative and tailored specifically for e-commerce logistics are gaining popularity. These designs incorporate features like customizable branding possibilities, collapsibility for easy return shipment, and durable materials ideal for repeated use to satisfy the unique demands of the rapidly growing Chinese online retail business.

Eco-friendly Trend to Upsurge the Adoption in the Canada

The reverse tuck box industry in Canada is estimated to report a CAGR of 3.4% for the forecast period of 2025 to 2035. An exciting opportunity for sustainable packaging solutions exists in Canada's reverse tuck box market, which is ideally positioned to gain from a combination of creative packaging concepts and the nation's varied ecosystems.

Leading the way in the creation of biodegradable materials from our abundant local resources, such as plant-based fibers and organic polymers, Canadian firms are exemplifying the principle of natural selection and driving a worldwide trend towards sustainable packaging.

In Canada, environmental organizations have concentrated on teaching the public to reuse resources like paper and wooden crates. The Canadian government is taking a proactive approach in encouraging its residents to reuse materials. This is anticipated to significantly boost the reverse tuck box business and provide assurances for its sustainable growth.

Reverse Tuck Box Industry Analysis by Top Investment Segments

The reverse tuck box sector is augmenting the demand based on various factors across the globe. In 2025, on the basis of product type, standard reverse tuck boxes are in demand, whereas the retail packaging segment is developing a larger consumer base for reverse tuck boxes.

Standard Reverse Tuck Boxes to Take the Lion’s Share

The majority of the general population shows a strong preference for standard reverse tuck boxes. It is projected that in 2025, these types of boxes will account for 24% of the revenue share in the global market.

Product Standard Reverse Tuck Box
Value Share (2025) 24%

With the introduction of unique standard reverse tuck boxes, manufacturers are not just entering the market but also creating a new wave in the packaging sector. These boxes are meticulously designed with a focus on detail and are crafted from high-quality materials, ensuring their sturdiness and durability.

Manufacturers go beyond just providing standard reverse tuck boxes. Several times, they offer a range of additional features such as lamination services, die-cut boxes, and window boxes.

Along with that, sometimes the manufacturers also provide complimentary doorstep delivery and three-dimensional mock-ups, all aimed at ensuring clients' satisfaction.

Reverse Tuck Boxes find their Place in the Retail Packaging

Reverse tuck boxes are utilized for various applications, such as retail packaging, e-commerce shipping, storage and inventory as well as gift packing. The retail packaging segment, as of 2025, holds the maximum share of 23% in the reverse tuck box industry.

End Use Retail Packaging
Value Share (2025) 23%

By using e-commerce platforms and websites to sell items directly to customers online, direct-to-consumer (D2C) firms are transforming the retail packaging sector. Among the many benefits of this approach are its ability to provide outstanding customer service, foster brand loyalty, and make investments in all consumer touchpoints, including retail packaging.

Retail packaging is a powerful tool for marketing, and direct-to-consumer (D2C) firms understand this. As such, they prioritize high-quality, practical, and visually pleasing packaging that reflects their values, personality, and target market.

The retailers concentrate on the retail segment's packaging functionality, creating solutions that safeguard the goods in transportation, taking special needs like fragility or perishability into account, raising customer satisfaction levels, and lowering the possibility of returns or unfavorable reviews.
Key Reverse Tuck Box Market Players and Competitive Outlook

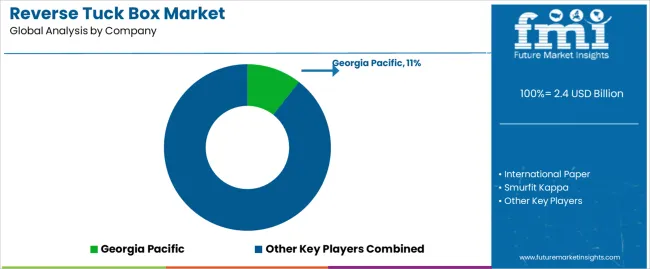
Reverse Tuck Box Market Analysis By Company

A number of companies are vying for global supremacy in the reverse tuck box market. These businesses understand the amount of local market expertise, customer preferences, and developing trends that domestic leaders and start-ups possess, and they frequently find value in working with them.

Such cooperative projects highlight the value of local knowledge in a global ecosystem while also providing access to greater production capacity and more effective manufacturing techniques.

Market players in the reverse tuck box market are concentrating on developing innovative products utilizing particular sustainable and eco-friendly materials, such as natural fibers and recycled paper. In addition to boosting sales in the e-commerce and retail sectors, leading manufacturers will be able to comply with stringent environmental regulations.

Some of the most prominent companies in the industry are Georgia Pacific, International Paper, Smurfit Kappa, and Mondi Group.

Industry Updates

  • In May 2025, Supremex, a North American packaging and envelopes provider, acquired the assets of Canada-based folding carton packaging provider Graf-Pak. The deal was financed through Supremex's existing credit facility and is subject to customary adjustments.

Leading Reverse Tuck Box Brands by Market Share

  • Georgia Pacific
  • International Paper
  • Smurfit Kappa
  • Mondi Group
  • Cascades Inc.
  • Rose City Box
  • Lindquist and Co.
  • LDC Packaging
  • E Molding International.
  • PakFactory
  • Elixir Packaging

Top Investment Segments Studied in the Reverse Tuck Box Market

By Product Type:

In terms of product type, reverse tuck boxes are commonly available as standard, double reverse, triple reverse, quadruple reverse, collapsible reverse, and other boxes, such as pillow style, telescoping, and modular.

By Application:

Reverse tuck boxes are classified based on applications into retail packaging, e-commerce shipping, storage and inventory, and gift packing.

By End Use:

As per the end-use, the industry is segmented into food and beverages, pharmaceuticals, industrials, and medical.

By Region:

As per region, the industry is divided into North America, Latin America, Europe, Asia-Pacific, and the Middle East and Africa.

Frequently Asked Questions

How big is the reverse tuck box market in 2025?

The global reverse tuck box market is estimated to be valued at USD 2.4 billion in 2025.

What will be the size of reverse tuck box market in 2035?

The market size for the reverse tuck box market is projected to reach USD 3.4 billion by 2035.

How much will be the reverse tuck box market growth between 2025 and 2035?

The reverse tuck box market is expected to grow at a 3.5% CAGR between 2025 and 2035.

What are the key product types in the reverse tuck box market?

The key product types in reverse tuck box market are standard, double reverse, triple reverse, quadruple reverse, collapsible reverse and others (pillow style, telescoping, modular).

Which application segment to contribute significant share in the reverse tuck box market in 2025?

In terms of application, retail packaging segment to command 42.7% share in the reverse tuck box market in 2025.

Table of Content

  1. Executive Summary
    • Global Market Outlook
    • Demand to side Trends
    • Supply to side Trends
    • Technology Roadmap Analysis
    • Analysis and Recommendations
  2. Market Overview
    • Market Coverage / Taxonomy
    • Market Definition / Scope / Limitations
  3. Market Background
    • Market Dynamics
      • Drivers
      • Restraints
      • Opportunity
      • Trends
    • Scenario Forecast
      • Demand in Optimistic Scenario
      • Demand in Likely Scenario
      • Demand in Conservative Scenario
    • Opportunity Map Analysis
    • Product Life Cycle Analysis
    • Supply Chain Analysis
    • Investment Feasibility Matrix
    • Value Chain Analysis
    • PESTLE and Porter’s Analysis
    • Regulatory Landscape
    • Regional Parent Market Outlook
    • Production and Consumption Statistics
    • Import and Export Statistics
  4. Global Market Analysis 2020 to 2024 and Forecast, 2025 to 2035
    • Historical Market Size Value (USD Million) Analysis, 2020 to 2024
    • Current and Future Market Size Value (USD Million) Projections, 2025 to 2035
      • Y to o to Y Growth Trend Analysis
      • Absolute $ Opportunity Analysis
  5. Global Market Pricing Analysis 2020 to 2024 and Forecast 2025 to 2035
  6. Global Market Analysis 2020 to 2024 and Forecast 2025 to 2035, By Product Type
    • Introduction / Key Findings
    • Historical Market Size Value (USD Million) Analysis By Product Type , 2020 to 2024
    • Current and Future Market Size Value (USD Million) Analysis and Forecast By Product Type , 2025 to 2035
      • Standard
      • Double Reverse
      • Triple Reverse
      • Quadruple Reverse
      • Collapsible Reverse
      • Others (Pillow Style, Telescoping, Modular)
    • Y to o to Y Growth Trend Analysis By Product Type , 2020 to 2024
    • Absolute $ Opportunity Analysis By Product Type , 2025 to 2035
  7. Global Market Analysis 2020 to 2024 and Forecast 2025 to 2035, By Application
    • Introduction / Key Findings
    • Historical Market Size Value (USD Million) Analysis By Application, 2020 to 2024
    • Current and Future Market Size Value (USD Million) Analysis and Forecast By Application, 2025 to 2035
      • Retail Packaging
      • E-Commerce Shipping
      • Storage & Inventory
      • Gift Packing
    • Y to o to Y Growth Trend Analysis By Application, 2020 to 2024
    • Absolute $ Opportunity Analysis By Application, 2025 to 2035
  8. Global Market Analysis 2020 to 2024 and Forecast 2025 to 2035, By End Use
    • Introduction / Key Findings
    • Historical Market Size Value (USD Million) Analysis By End Use, 2020 to 2024
    • Current and Future Market Size Value (USD Million) Analysis and Forecast By End Use, 2025 to 2035
      • Food & Beverage
      • Industrial
      • Pharmaceutical
      • Medical
    • Y to o to Y Growth Trend Analysis By End Use, 2020 to 2024
    • Absolute $ Opportunity Analysis By End Use, 2025 to 2035
  9. Global Market Analysis 2020 to 2024 and Forecast 2025 to 2035, By Region
    • Introduction
    • Historical Market Size Value (USD Million) Analysis By Region, 2020 to 2024
    • Current Market Size Value (USD Million) Analysis and Forecast By Region, 2025 to 2035
      • North America
      • Latin America
      • Western Europe
      • Eastern Europe
      • East Asia
      • South Asia and Pacific
      • Middle East & Africa
    • Market Attractiveness Analysis By Region
  10. North America Market Analysis 2020 to 2024 and Forecast 2025 to 2035, By Country
    • Historical Market Size Value (USD Million) Trend Analysis By Market Taxonomy, 2020 to 2024
    • Market Size Value (USD Million) Forecast By Market Taxonomy, 2025 to 2035
      • By Country
        • USA
        • Canada
        • Mexico
      • By Product Type
      • By Application
      • By End Use
    • Market Attractiveness Analysis
      • By Country
      • By Product Type
      • By Application
      • By End Use
    • Key Takeaways
  11. Latin America Market Analysis 2020 to 2024 and Forecast 2025 to 2035, By Country
    • Historical Market Size Value (USD Million) Trend Analysis By Market Taxonomy, 2020 to 2024
    • Market Size Value (USD Million) Forecast By Market Taxonomy, 2025 to 2035
      • By Country
        • Brazil
        • Chile
        • Rest of Latin America
      • By Product Type
      • By Application
      • By End Use
    • Market Attractiveness Analysis
      • By Country
      • By Product Type
      • By Application
      • By End Use
    • Key Takeaways
  12. Western Europe Market Analysis 2020 to 2024 and Forecast 2025 to 2035, By Country
    • Historical Market Size Value (USD Million) Trend Analysis By Market Taxonomy, 2020 to 2024
    • Market Size Value (USD Million) Forecast By Market Taxonomy, 2025 to 2035
      • By Country
        • Germany
        • UK
        • Italy
        • Spain
        • France
        • Nordic
        • BENELUX
        • Rest of Western Europe
      • By Product Type
      • By Application
      • By End Use
    • Market Attractiveness Analysis
      • By Country
      • By Product Type
      • By Application
      • By End Use
    • Key Takeaways
  13. Eastern Europe Market Analysis 2020 to 2024 and Forecast 2025 to 2035, By Country
    • Historical Market Size Value (USD Million) Trend Analysis By Market Taxonomy, 2020 to 2024
    • Market Size Value (USD Million) Forecast By Market Taxonomy, 2025 to 2035
      • By Country
        • Russia
        • Poland
        • Hungary
        • Balkan & Baltic
        • Rest of Eastern Europe
      • By Product Type
      • By Application
      • By End Use
    • Market Attractiveness Analysis
      • By Country
      • By Product Type
      • By Application
      • By End Use
    • Key Takeaways
  14. East Asia Market Analysis 2020 to 2024 and Forecast 2025 to 2035, By Country
    • Historical Market Size Value (USD Million) Trend Analysis By Market Taxonomy, 2020 to 2024
    • Market Size Value (USD Million) Forecast By Market Taxonomy, 2025 to 2035
      • By Country
        • China
        • Japan
        • South Korea
      • By Product Type
      • By Application
      • By End Use
    • Market Attractiveness Analysis
      • By Country
      • By Product Type
      • By Application
      • By End Use
    • Key Takeaways
  15. South Asia and Pacific Market Analysis 2020 to 2024 and Forecast 2025 to 2035, By Country
    • Historical Market Size Value (USD Million) Trend Analysis By Market Taxonomy, 2020 to 2024
    • Market Size Value (USD Million) Forecast By Market Taxonomy, 2025 to 2035
      • By Country
        • India
        • ASEAN
        • Australia & New Zealand
        • Rest of South Asia and Pacific
      • By Product Type
      • By Application
      • By End Use
    • Market Attractiveness Analysis
      • By Country
      • By Product Type
      • By Application
      • By End Use
    • Key Takeaways
  16. Middle East & Africa Market Analysis 2020 to 2024 and Forecast 2025 to 2035, By Country
    • Historical Market Size Value (USD Million) Trend Analysis By Market Taxonomy, 2020 to 2024
    • Market Size Value (USD Million) Forecast By Market Taxonomy, 2025 to 2035
      • By Country
        • Kingdom of Saudi Arabia
        • Other GCC Countries
        • Turkiye
        • South Africa
        • Other African Union
        • Rest of Middle East & Africa
      • By Product Type
      • By Application
      • By End Use
    • Market Attractiveness Analysis
      • By Country
      • By Product Type
      • By Application
      • By End Use
    • Key Takeaways
  17. Key Countries Market Analysis
    • USA
      • Pricing Analysis
      • Market Share Analysis, 2024
        • By Product Type
        • By Application
        • By End Use
    • Canada
      • Pricing Analysis
      • Market Share Analysis, 2024
        • By Product Type
        • By Application
        • By End Use
    • Mexico
      • Pricing Analysis
      • Market Share Analysis, 2024
        • By Product Type
        • By Application
        • By End Use
    • Brazil
      • Pricing Analysis
      • Market Share Analysis, 2024
        • By Product Type
        • By Application
        • By End Use
    • Chile
      • Pricing Analysis
      • Market Share Analysis, 2024
        • By Product Type
        • By Application
        • By End Use
    • Germany
      • Pricing Analysis
      • Market Share Analysis, 2024
        • By Product Type
        • By Application
        • By End Use
    • UK
      • Pricing Analysis
      • Market Share Analysis, 2024
        • By Product Type
        • By Application
        • By End Use
    • Italy
      • Pricing Analysis
      • Market Share Analysis, 2024
        • By Product Type
        • By Application
        • By End Use
    • Spain
      • Pricing Analysis
      • Market Share Analysis, 2024
        • By Product Type
        • By Application
        • By End Use
    • France
      • Pricing Analysis
      • Market Share Analysis, 2024
        • By Product Type
        • By Application
        • By End Use
    • India
      • Pricing Analysis
      • Market Share Analysis, 2024
        • By Product Type
        • By Application
        • By End Use
    • ASEAN
      • Pricing Analysis
      • Market Share Analysis, 2024
        • By Product Type
        • By Application
        • By End Use
    • Australia & New Zealand
      • Pricing Analysis
      • Market Share Analysis, 2024
        • By Product Type
        • By Application
        • By End Use
    • China
      • Pricing Analysis
      • Market Share Analysis, 2024
        • By Product Type
        • By Application
        • By End Use
    • Japan
      • Pricing Analysis
      • Market Share Analysis, 2024
        • By Product Type
        • By Application
        • By End Use
    • South Korea
      • Pricing Analysis
      • Market Share Analysis, 2024
        • By Product Type
        • By Application
        • By End Use
    • Russia
      • Pricing Analysis
      • Market Share Analysis, 2024
        • By Product Type
        • By Application
        • By End Use
    • Poland
      • Pricing Analysis
      • Market Share Analysis, 2024
        • By Product Type
        • By Application
        • By End Use
    • Hungary
      • Pricing Analysis
      • Market Share Analysis, 2024
        • By Product Type
        • By Application
        • By End Use
    • Kingdom of Saudi Arabia
      • Pricing Analysis
      • Market Share Analysis, 2024
        • By Product Type
        • By Application
        • By End Use
    • Turkiye
      • Pricing Analysis
      • Market Share Analysis, 2024
        • By Product Type
        • By Application
        • By End Use
    • South Africa
      • Pricing Analysis
      • Market Share Analysis, 2024
        • By Product Type
        • By Application
        • By End Use
  18. Market Structure Analysis
    • Competition Dashboard
    • Competition Benchmarking
    • Market Share Analysis of Top Players
      • By Regional
      • By Product Type
      • By Application
      • By End Use
  19. Competition Analysis
    • Competition Deep Dive
      • Georgia Pacific
        • Overview
        • Product Portfolio
        • Profitability by Market Segments (Product/Age /Sales Channel/Region)
        • Sales Footprint
        • Strategy Overview
          • Marketing Strategy
          • Product Strategy
          • Channel Strategy
      • International Paper
      • Smurfit Kappa
      • Mondi Group
      • Cascades
      • Rose City Box
      • Lindquist & Co.
      • LDC Packaging
      • E Molding International
  20. Assumptions & Acronyms Used
  21. Research Methodology

List of Tables

  • Table 1: Global Market Value (USD Million) Forecast by Region, 2020 to 2035
  • Table 2: Global Market Value (USD Million) Forecast by Product Type , 2020 to 2035
  • Table 3: Global Market Value (USD Million) Forecast by Application, 2020 to 2035
  • Table 4: Global Market Value (USD Million) Forecast by End Use, 2020 to 2035
  • Table 5: North America Market Value (USD Million) Forecast by Country, 2020 to 2035
  • Table 6: North America Market Value (USD Million) Forecast by Product Type , 2020 to 2035
  • Table 7: North America Market Value (USD Million) Forecast by Application, 2020 to 2035
  • Table 8: North America Market Value (USD Million) Forecast by End Use, 2020 to 2035
  • Table 9: Latin America Market Value (USD Million) Forecast by Country, 2020 to 2035
  • Table 10: Latin America Market Value (USD Million) Forecast by Product Type , 2020 to 2035
  • Table 11: Latin America Market Value (USD Million) Forecast by Application, 2020 to 2035
  • Table 12: Latin America Market Value (USD Million) Forecast by End Use, 2020 to 2035
  • Table 13: Western Europe Market Value (USD Million) Forecast by Country, 2020 to 2035
  • Table 14: Western Europe Market Value (USD Million) Forecast by Product Type , 2020 to 2035
  • Table 15: Western Europe Market Value (USD Million) Forecast by Application, 2020 to 2035
  • Table 16: Western Europe Market Value (USD Million) Forecast by End Use, 2020 to 2035
  • Table 17: Eastern Europe Market Value (USD Million) Forecast by Country, 2020 to 2035
  • Table 18: Eastern Europe Market Value (USD Million) Forecast by Product Type , 2020 to 2035
  • Table 19: Eastern Europe Market Value (USD Million) Forecast by Application, 2020 to 2035
  • Table 20: Eastern Europe Market Value (USD Million) Forecast by End Use, 2020 to 2035
  • Table 21: East Asia Market Value (USD Million) Forecast by Country, 2020 to 2035
  • Table 22: East Asia Market Value (USD Million) Forecast by Product Type , 2020 to 2035
  • Table 23: East Asia Market Value (USD Million) Forecast by Application, 2020 to 2035
  • Table 24: East Asia Market Value (USD Million) Forecast by End Use, 2020 to 2035
  • Table 25: South Asia and Pacific Market Value (USD Million) Forecast by Country, 2020 to 2035
  • Table 26: South Asia and Pacific Market Value (USD Million) Forecast by Product Type , 2020 to 2035
  • Table 27: South Asia and Pacific Market Value (USD Million) Forecast by Application, 2020 to 2035
  • Table 28: South Asia and Pacific Market Value (USD Million) Forecast by End Use, 2020 to 2035
  • Table 29: Middle East & Africa Market Value (USD Million) Forecast by Country, 2020 to 2035
  • Table 30: Middle East & Africa Market Value (USD Million) Forecast by Product Type , 2020 to 2035
  • Table 31: Middle East & Africa Market Value (USD Million) Forecast by Application, 2020 to 2035
  • Table 32: Middle East & Africa Market Value (USD Million) Forecast by End Use, 2020 to 2035

List of Figures

  • Figure 1: Global Market Pricing Analysis
  • Figure 2: Global Market Value (USD Million) Forecast 2020-2035
  • Figure 3: Global Market Value Share and BPS Analysis by Product Type , 2025 and 2035
  • Figure 4: Global Market Y to o to Y Growth Comparison by Product Type , 2025-2035
  • Figure 5: Global Market Attractiveness Analysis by Product Type
  • Figure 6: Global Market Value Share and BPS Analysis by Application, 2025 and 2035
  • Figure 7: Global Market Y to o to Y Growth Comparison by Application, 2025-2035
  • Figure 8: Global Market Attractiveness Analysis by Application
  • Figure 9: Global Market Value Share and BPS Analysis by End Use, 2025 and 2035
  • Figure 10: Global Market Y to o to Y Growth Comparison by End Use, 2025-2035
  • Figure 11: Global Market Attractiveness Analysis by End Use
  • Figure 12: Global Market Value (USD Million) Share and BPS Analysis by Region, 2025 and 2035
  • Figure 13: Global Market Y to o to Y Growth Comparison by Region, 2025-2035
  • Figure 14: Global Market Attractiveness Analysis by Region
  • Figure 15: North America Market Incremental Dollar Opportunity, 2025-2035
  • Figure 16: Latin America Market Incremental Dollar Opportunity, 2025-2035
  • Figure 17: Western Europe Market Incremental Dollar Opportunity, 2025-2035
  • Figure 18: Eastern Europe Market Incremental Dollar Opportunity, 2025-2035
  • Figure 19: East Asia Market Incremental Dollar Opportunity, 2025-2035
  • Figure 20: South Asia and Pacific Market Incremental Dollar Opportunity, 2025-2035
  • Figure 21: Middle East & Africa Market Incremental Dollar Opportunity, 2025-2035
  • Figure 22: North America Market Value Share and BPS Analysis by Country, 2025 and 2035
  • Figure 23: North America Market Value Share and BPS Analysis by Product Type , 2025 and 2035
  • Figure 24: North America Market Y to o to Y Growth Comparison by Product Type , 2025-2035
  • Figure 25: North America Market Attractiveness Analysis by Product Type
  • Figure 26: North America Market Value Share and BPS Analysis by Application, 2025 and 2035
  • Figure 27: North America Market Y to o to Y Growth Comparison by Application, 2025-2035
  • Figure 28: North America Market Attractiveness Analysis by Application
  • Figure 29: North America Market Value Share and BPS Analysis by End Use, 2025 and 2035
  • Figure 30: North America Market Y to o to Y Growth Comparison by End Use, 2025-2035
  • Figure 31: North America Market Attractiveness Analysis by End Use
  • Figure 32: Latin America Market Value Share and BPS Analysis by Country, 2025 and 2035
  • Figure 33: Latin America Market Value Share and BPS Analysis by Product Type , 2025 and 2035
  • Figure 34: Latin America Market Y to o to Y Growth Comparison by Product Type , 2025-2035
  • Figure 35: Latin America Market Attractiveness Analysis by Product Type
  • Figure 36: Latin America Market Value Share and BPS Analysis by Application, 2025 and 2035
  • Figure 37: Latin America Market Y to o to Y Growth Comparison by Application, 2025-2035
  • Figure 38: Latin America Market Attractiveness Analysis by Application
  • Figure 39: Latin America Market Value Share and BPS Analysis by End Use, 2025 and 2035
  • Figure 40: Latin America Market Y to o to Y Growth Comparison by End Use, 2025-2035
  • Figure 41: Latin America Market Attractiveness Analysis by End Use
  • Figure 42: Western Europe Market Value Share and BPS Analysis by Country, 2025 and 2035
  • Figure 43: Western Europe Market Value Share and BPS Analysis by Product Type , 2025 and 2035
  • Figure 44: Western Europe Market Y to o to Y Growth Comparison by Product Type , 2025-2035
  • Figure 45: Western Europe Market Attractiveness Analysis by Product Type
  • Figure 46: Western Europe Market Value Share and BPS Analysis by Application, 2025 and 2035
  • Figure 47: Western Europe Market Y to o to Y Growth Comparison by Application, 2025-2035
  • Figure 48: Western Europe Market Attractiveness Analysis by Application
  • Figure 49: Western Europe Market Value Share and BPS Analysis by End Use, 2025 and 2035
  • Figure 50: Western Europe Market Y to o to Y Growth Comparison by End Use, 2025-2035
  • Figure 51: Western Europe Market Attractiveness Analysis by End Use
  • Figure 52: Eastern Europe Market Value Share and BPS Analysis by Country, 2025 and 2035
  • Figure 53: Eastern Europe Market Value Share and BPS Analysis by Product Type , 2025 and 2035
  • Figure 54: Eastern Europe Market Y to o to Y Growth Comparison by Product Type , 2025-2035
  • Figure 55: Eastern Europe Market Attractiveness Analysis by Product Type
  • Figure 56: Eastern Europe Market Value Share and BPS Analysis by Application, 2025 and 2035
  • Figure 57: Eastern Europe Market Y to o to Y Growth Comparison by Application, 2025-2035
  • Figure 58: Eastern Europe Market Attractiveness Analysis by Application
  • Figure 59: Eastern Europe Market Value Share and BPS Analysis by End Use, 2025 and 2035
  • Figure 60: Eastern Europe Market Y to o to Y Growth Comparison by End Use, 2025-2035
  • Figure 61: Eastern Europe Market Attractiveness Analysis by End Use
  • Figure 62: East Asia Market Value Share and BPS Analysis by Country, 2025 and 2035
  • Figure 63: East Asia Market Value Share and BPS Analysis by Product Type , 2025 and 2035
  • Figure 64: East Asia Market Y to o to Y Growth Comparison by Product Type , 2025-2035
  • Figure 65: East Asia Market Attractiveness Analysis by Product Type
  • Figure 66: East Asia Market Value Share and BPS Analysis by Application, 2025 and 2035
  • Figure 67: East Asia Market Y to o to Y Growth Comparison by Application, 2025-2035
  • Figure 68: East Asia Market Attractiveness Analysis by Application
  • Figure 69: East Asia Market Value Share and BPS Analysis by End Use, 2025 and 2035
  • Figure 70: East Asia Market Y to o to Y Growth Comparison by End Use, 2025-2035
  • Figure 71: East Asia Market Attractiveness Analysis by End Use
  • Figure 72: South Asia and Pacific Market Value Share and BPS Analysis by Country, 2025 and 2035
  • Figure 73: South Asia and Pacific Market Value Share and BPS Analysis by Product Type , 2025 and 2035
  • Figure 74: South Asia and Pacific Market Y to o to Y Growth Comparison by Product Type , 2025-2035
  • Figure 75: South Asia and Pacific Market Attractiveness Analysis by Product Type
  • Figure 76: South Asia and Pacific Market Value Share and BPS Analysis by Application, 2025 and 2035
  • Figure 77: South Asia and Pacific Market Y to o to Y Growth Comparison by Application, 2025-2035
  • Figure 78: South Asia and Pacific Market Attractiveness Analysis by Application
  • Figure 79: South Asia and Pacific Market Value Share and BPS Analysis by End Use, 2025 and 2035
  • Figure 80: South Asia and Pacific Market Y to o to Y Growth Comparison by End Use, 2025-2035
  • Figure 81: South Asia and Pacific Market Attractiveness Analysis by End Use
  • Figure 82: Middle East & Africa Market Value Share and BPS Analysis by Country, 2025 and 2035
  • Figure 83: Middle East & Africa Market Value Share and BPS Analysis by Product Type , 2025 and 2035
  • Figure 84: Middle East & Africa Market Y to o to Y Growth Comparison by Product Type , 2025-2035
  • Figure 85: Middle East & Africa Market Attractiveness Analysis by Product Type
  • Figure 86: Middle East & Africa Market Value Share and BPS Analysis by Application, 2025 and 2035
  • Figure 87: Middle East & Africa Market Y to o to Y Growth Comparison by Application, 2025-2035
  • Figure 88: Middle East & Africa Market Attractiveness Analysis by Application
  • Figure 89: Middle East & Africa Market Value Share and BPS Analysis by End Use, 2025 and 2035
  • Figure 90: Middle East & Africa Market Y to o to Y Growth Comparison by End Use, 2025-2035
  • Figure 91: Middle East & Africa Market Attractiveness Analysis by End Use
  • Figure 92: Global Market - Tier Structure Analysis
  • Figure 93: Global Market - Company Share Analysis
Dashboard
Dashboard
Dashboard
Dashboard
Dashboard
Dashboard

Full Research Suite comprises of:

Market outlook & trends analysis

Market outlook & trends analysis

Interviews & case studies

Interviews & case studies

Strategic recommendations

Strategic recommendations

Vendor profiles & capabilities analysis

Vendor profiles & capabilities analysis

5-year forecasts

5-year forecasts

8 regions and 60+ country-level data splits

8 regions and 60+ country-level data splits

Market segment data splits

Market segment data splits

12 months of continuous data updates

12 months of continuous data updates

DELIVERED AS:

PDF EXCEL ONLINE

Full Research Suite


$5000

$7500

$10000

Buy Report Now
Similar Industry Reports

Similar Industry Reports

Reverse Osmosis Pump Market

Reverse Osmosis Pump Market Size and Share Forecast Outlook 2025 to 2035

Reverse Cap Bottles Market

Reverse Cap Bottles Market Size and Share Forecast Outlook 2025 to 2035

Reverse Logistics Market

Reverse Logistics Market Size and Share Forecast Outlook 2025 to 2035

Reverse Transcriptase Enzymes Market

Reverse Transcriptase Enzymes Market Size and Share Forecast Outlook 2025 to 2035

Reverse Osmosis (RO) Pump Market Share Analysis

Market Share Insights for Reverse Osmosis (RO) Pump Providers

Reverse Tuck Cartons Market

Reverse Tuck Cartons Market

3D Reverse Engineering Software Market

3D Reverse Engineering Software Market Forecast and Outlook 2025 to 2035

Q-Commerce Last-Mile Thermal Packs & Reverse Logistics Market

Q-Commerce Last-Mile Thermal Packs & Reverse Logistics Market Analysis - Size, Share, and Forecast Outlook 2025 to 2035

Tuck Top Box Market
Tuck Top Box Market

Tuck Top Box Market

Box Liners Market
Box Liners Market

Box Liners Market Size and Share Forecast Outlook 2025 to 2035

Boxboard Packaging Market

Boxboard Packaging Market Analysis - Size, Share, and Forecast Outlook 2025 to 2035

Box Compression Tester Market

Box Compression Tester Market Size and Share Forecast Outlook 2025 to 2035

Box Latch Market
Box Latch Market

Box Latch Market Size and Share Forecast Outlook 2025 to 2035

Box Pouch Market
Box Pouch Market

Box Pouch Market by Pouch Type from 2025 to 2035

Box Filling Machine Market

Box Filling Machine Market from 2025 to 2035

Box and Carton Overwrap Films Market

Box and Carton Overwrap Films Market Demand and Growth

Box and Carton Overwrapping Machines Market

Box and Carton Overwrapping Machines Market Insights and Growth 2025 to 2035

Boxcar Scars Market
Boxcar Scars Market

Boxcar Scars Market – Demand, Growth & Forecast 2025 to 2035

Box Sealing Machines Market

Box Sealing Machines Market Trends – Growth & Forecast 2025 to 2035

Box Pouch Market Share Analysis

Competitive Breakdown of Box Pouch Providers

Future Market Insights

Reverse Tuck Box Market

Chat With MaRIA

Chat With

MaRIA

Hi There, I am MaRIA, Your Market Research Intelligence Assistant. How may I help you?