

- Market Size (2026)
- USD 375.0 Mn
- Forecast (2036)
- USD 3492.0 Mn
- CAGR (2026 to 2036)
- 25.0%
How big is Robotic Returns and Reverse Logistics Market in 2026?
USD 375.0 million in 2026 and USD 3,492.0 million by 2036 at a 25.0% CAGR.
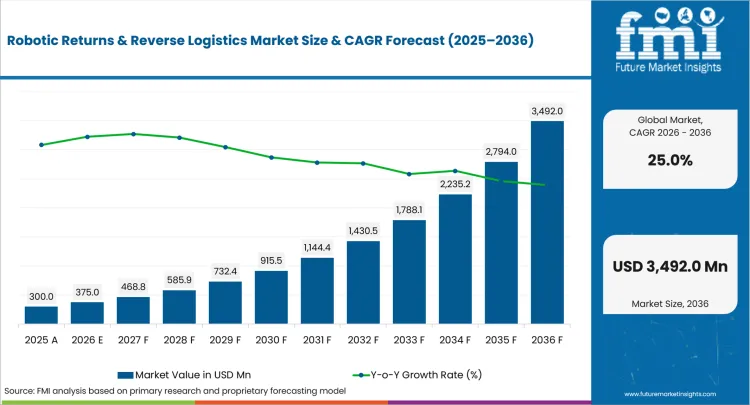
Sales of robotic returns and reverse logistics are projected to expand at 25.0% CAGR from 2026 to 2036, expanding the industry valuation from USD 375.0 million in 2026 to USD 3,492.0 million during the forecast period. The industry is driven by the need to process returned products before resale value declines. For instance, KNAPP reported in January 2026 that fashion return rates often range from 30% to 50%, explaining why apparel facilities need repeatable intake before receiving queues widen and recovery windows narrow. Faster aggregation across the reverse logistics network gives robotic cells steadier parcel batches and clearer inspection priorities. Automated intake creates commercial value by shortening the interval between parcel receipt and a documented disposition decision.
United States distribution centers face large parcel flows and sharp seasonal labor swings during return peaks. Japanese facilities place more weight on compact cells and careful identity checks for returned electronics. The USA Census Bureau reported in May 2026 that e-commerce accounted for 16.9% of total retail sales during the first quarter. Activity across e-commerce logistics creates a broad pool of parcels that may re-enter warehouse networks without store-based inspection. Each installation must connect image capture with order data and a clearly defined exception route. American sites can justify higher-throughput lines, whereas Japanese sites may prioritize footprint and inspection depth. Investment becomes easier to assess when robotic throughput and grading accuracy are measured as separate operational outcomes.
| Metric | Value |
|---|---|
| 2025 Market Size | USD 300.0 million |
| 2026 Market Size | USD 375.0 million |
| 2036 Market Size | USD 3,492.0 million |
| Forecast CAGR (2026-2036) | 25.0% |
| Technology Focus | AI Triage and Sortation Cells |
| AI Triage and Sortation Cells Share (2026) | 36.0% |
| Application Focus | Returns Triage |
| Returns Triage Share (2026) | 40.0% |
| Component Focus | Hardware |
| Hardware Share (2026) | 52.0% |
Summary of the Robotic Returns and Reverse Logistics Market
| Market Signal | Commercial Impact |
|---|---|
| Demand and Growth Drivers | Return operations create value when facilities identify each item quickly and direct it toward a defined recovery path before recovery value declines across the network.
|
| Product and Segment View | The technology stack begins with physical handling and adds software that determines the next route for each returned product.
|
| Geography and Growth Outlook | Country growth depends on parcel density and facility economics together with local support for warehouse automation.
|
| Competitive Landscape | Competition spans robotic cell developers and warehouse integrators together with logistics groups that control return volume and daily operations within large return facilities.
|
| Analyst Perspective | The commercial test is whether a robotic system improves recovery value across mixed products and uncertain packaging across changing facility conditions.
|
Source: FMI's proprietary forecasting model and primary research
How is the robotic returns and reverse logistics market segmented?
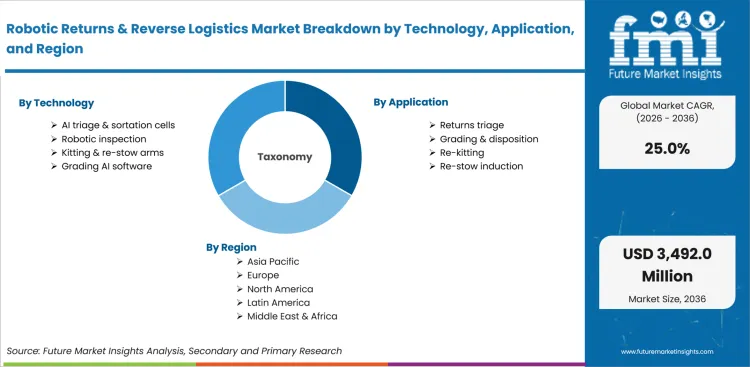
The robotic returns and reverse logistics industry is segmented by technology, application, component, end use, business model, and region.
The segmentation framework separates machine methods from the work performed and the contracts used to fund installations. Technology covers AI triage cells and grading software together with robotic arms and mobile systems for physical movement. Application analysis follows intake and inspection through sortation and disposal routing so each operating step remains distinct. Component analysis separates hardware from software and services across one return-processing system and investment plan.
End-use categories cover e-commerce and retail operations alongside third-party logistics and product-specific processing facilities worldwide. Business models compare direct purchase with leasing and managed services that shift cost and support responsibilities. Regional analysis shows how warehouse scale and return rules affect adoption across countries with different logistics networks.
What supports demand for AI Triage and Sortation Cells within the Technology category?
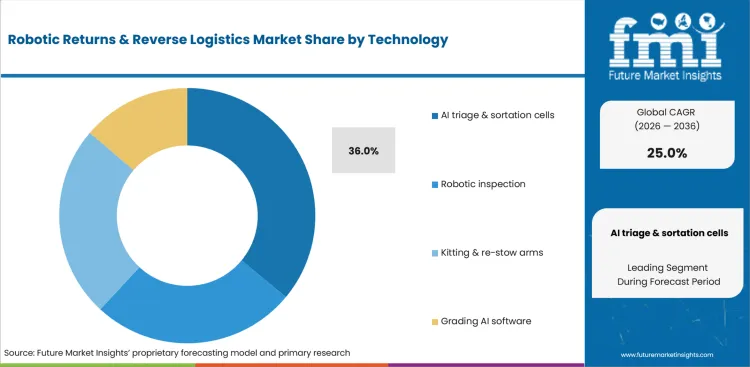
Returned parcels arrive with uncertain packaging and product condition that weaken identification quality at the receiving point. Intake cells create the first structured record through scanning and imaging before robotic movement begins. NIST published research in May 2025 that examined robotic bin-picking throughput and current performance measures. The research supports testing across mixed objects instead of relying on controlled sample boxes during vendor validation. Comparable logistics robots deployments show why throughput and exception rates need separate measurement during production.
- AI Triage and Sortation Cells are expected to hold 36.0% share in 2026, driven by their control over item capture and immediate routing. Each cell directs products toward inspection or resale preparation while preserving a linked record for later actions. Facilities gain commercial value when intake decisions remain traceable across the complete return workflow and recovery record.
- E-commerce fulfillment centers use AI triage cells to process mixed products without proportional growth in manual receiving teams. Effective systems identify uncertain items early and direct them toward structured review before routing errors spread downstream. The design protects throughput and reduces incorrect disposition decisions across the wider return operation and recovery workflow.
How does Returns Triage shape demand within the Application category?
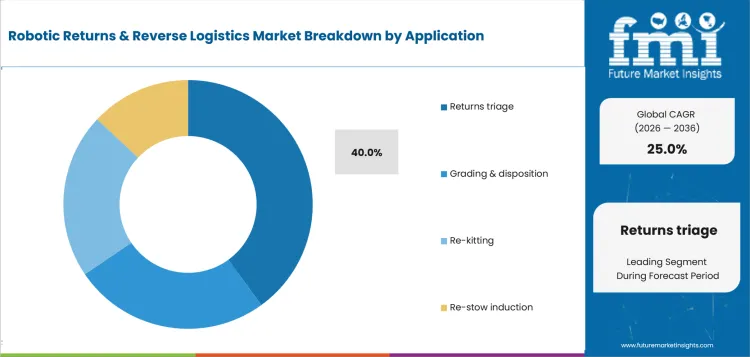
The first classification decision determines whether a product can return to stock or needs further inspection. FedEx reported in December 2025 that its supply chain operation processes more than 475 million returns each year. The scale shows why small intake savings can affect large operating budgets and shorten delays before products return to resale. Returns Triage connects parcel receiving with refund timing and inventory recovery across retail logistics networks.
- In 2026, returns triage is projected to account for 40.0% share, attributable to its control over every later facility path. Incorrect first decisions create repeat handling and reduce recovery value across high-volume return operations and resale channels. Accurate triage gives managers a clearer basis for selecting automation before investing in downstream repair or repackaging stations.
- Retail chains and third-party logistics companies favor Returns Triage because it shortens refund cycles and releases sellable stock. Initial systems can begin with imaging and identity checks before broader robotic handling expands across the receiving area. Early deployment produces operating evidence without forcing the complete reverse flow into one capital project or service contract.
How is Hardware positioned within the Component category?
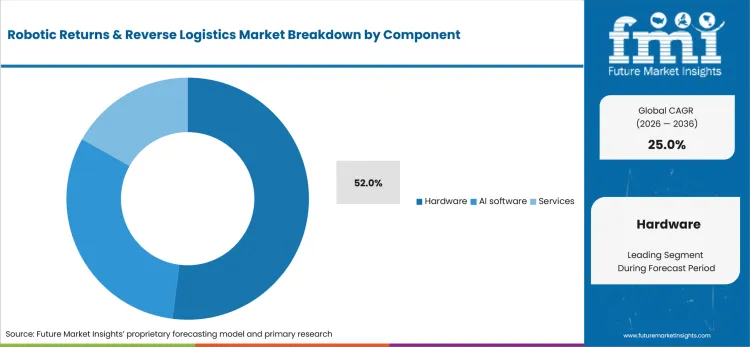
Robotic return handling requires physical contact with irregular products and damaged packaging across mixed receiving streams. Hardware spending covers robotic arms and grippers alongside cameras and conveyor controls across protected work areas. UPS reported in January 2025 that Geek+ robots reduced the typical time to ship returned items back to retailers by 35%. The result shows why robotic hardware must work with scanning and sortation rather than operate as an isolated arm. Comparable automated material handling systems projects show why integration costs remain material beside the robot price.
- By component, hardware is forecast to represent 52.0% share in 2026, owing to the capital needed for robotic movement and protected work areas. Cameras and controls must operate with conveyors and warehouse software throughout the same return process. A practical budget includes installation and safety validation rather than treating one robot arm as a complete processing system.
- Distribution centers favor modular hardware that allows new stations without rebuilding the complete receiving area or control architecture. Replaceable grippers and configurable conveyors extend product coverage across the same site and preserve earlier equipment investments. The investment case improves when expansion follows measured return volumes instead of a fixed design built for one seasonal peak.
What makes E-commerce central to the End Use category?
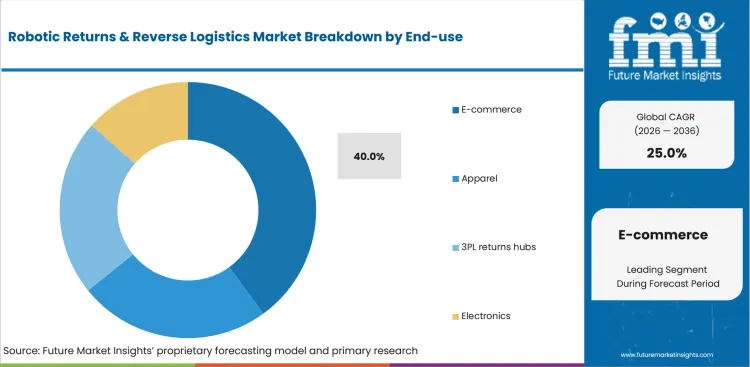
Online purchases create return flows without store employees checking product condition during the customer handoff process. FedEx announced in March 2025 that FedEx Easy Returns would launch with about 3,000 drop-off locations and route consolidated items through a reverse logistics facility. The model concentrates parcels before warehouse intake and improves the information available for refund and recovery decisions. Intralogistics automation solutions show why return cells must preserve identity across storage and warehouse control systems.
- Based on end use, e-commerce is likely to capture 40.0% share in 2026, supported by parcel fragmentation and limited inspection at the delivery point. Reliable identification must occur before a refund or resale choice becomes commercially sound for the merchant. Online merchants gain value from evidence capture that links product condition with the customer order and warehouse location.
- Digital retailers use robotic return systems during peak volumes that can exceed fixed manual capacity across several facilities. Automation supports repeatable intake across promotions and holiday periods within apparel and electronics return streams. Commercial value depends on flexible handling because a cell designed for uniform cartons may fail on apparel bags or opened electronics.
How do operators evaluate Robotics as a Service within the Business Model category?
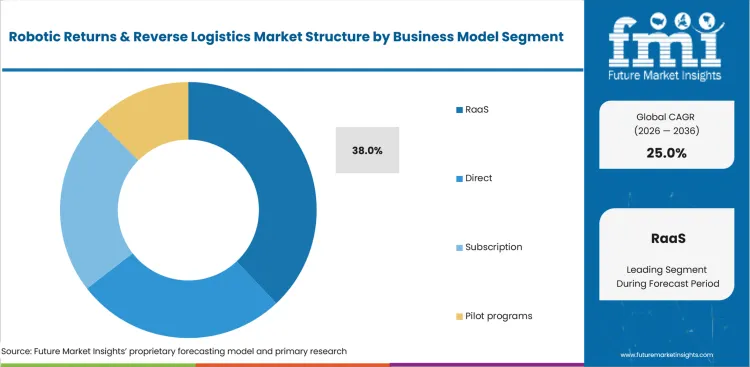
Return volumes change sharply across seasons and retail campaigns within the same processing site and staffing plan. A service contract spreads equipment cost while linking recurring payments with technical support and defined uptime obligations. GXO reported in January 2025 that its Calliope partnership included reverse logistics and three-dimensional sortation that triples peak throughput. The partnership shows how managed operations can combine equipment with clear process accountability and service-level ownership. The robotics as a service market provides a broader comparison for performance-linked pricing and support terms.
- Robotics as a Service is expected to lead by business model with 38.0% share in 2026, underpinned by seasonal capacity needs and limited technical staffing. Operators can add processing capacity without carrying the full purchase cost during an uncertain commercial launch. Contract terms still need clear measures for uptime and product coverage so service fees reflect usable production capacity.
- Third-party logistics companies use RaaS for new return programs through contracts that combine installation with maintenance and software updates. The model can shorten internal approval for operations with uncertain volume profiles and limited technical staffing. Commercial risk rises whenever promised throughput excludes difficult items or support response times remain undefined during peak processing.
What are the drivers, restraints, and opportunities in the robotic returns and reverse logistics market?
High return volumes and inconsistent product conditions are accelerating demand for traceable, evidence-based return processing and decision-making.
- Driver: High return volumes shorten the time available for identity capture and resale decisions during seasonal peaks.
- Restraint: Variable packaging and uncertain product condition limit automated grading reliability without structured human review.
- Opportunity: Product-level evidence can support fraud review and disposal records through one linked history for every returned item.
High return volume is a factor supporting market growth because delayed intake reduces resale value and extends refund cycles. The National Retail Federation reported in October 2025 that retailers expected USD 849.9 billion in returns and an online return rate of 19.3%. The return figures support robotic receiving at facilities that can keep equipment active during seasonal peaks. Investment becomes defensible when each cell improves labor output and inventory recovery across the same workflow.
Inspection uncertainty is a factor limiting growth since returned products rarely arrive in a controlled presentation. NIST published an April 2026 metric for measuring depth resolution across three-dimensional sensors used in industrial applications. The research explains why sensing performance needs defined tests before cameras support automated grading decisions. Facilities still need human review for unclear damage and incomplete packaging conditions during normal production runs. Adoption slows whenever an integrator cannot state which product classes meet the required confidence level during production.
Product-level evidence creates an emerging opportunity for systems that record images and weights together with serial numbers and routing decisions. The European Commission announced in February 2026 that a standard reporting format for discarded unsold consumer goods applies from February 2027. Operators can use one item record for resale descriptions and disposal reporting across several recovery paths. Trade-in and buy-back logistics programs management shows how documented condition supports recovery activity beyond standard retail returns.
Which country CAGRs are profiled in the robotic returns and reverse logistics market?
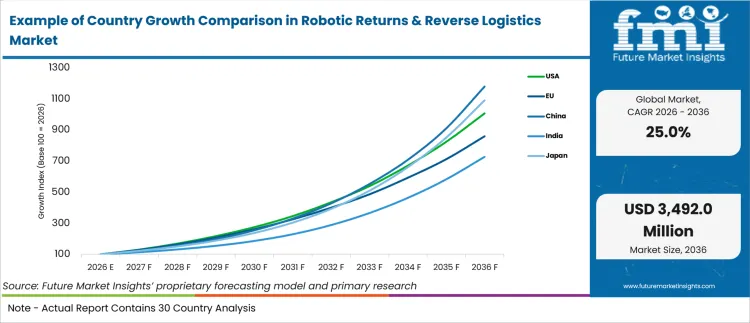
| Country | CAGR |
|---|---|
| China | 28.0% |
| Japan | 27.0% |
| USA | 26.0% |
| South Korea | 25.2% |
| Germany | 24.6% |
| EU (Regional) | 24.0% |
| India | 22.0% |
How do country-level CAGRs compare in the robotic returns and reverse logistics market?
The country comparison shows a gradual step-down in growth across the markets covered. China and Japan sit at the upper end of the range, while the United States and South Korea form a closely grouped second tier. Germany and the European Union follow with slightly lower growth. India remains at the lower end of the comparison. The six-point spread shows that these markets share a strong growth outlook, although their relative positions indicate different levels of market momentum. The European Union figure represents a regional average, so individual member countries may record higher or lower growth.
- China and Japan lead the comparison and establish East Asia as the notable growth cluster among the markets shown.
- The United States and South Korea follow closely, which indicates that neither market falls far behind the leading group.
- Germany and the European Union form the next growth band and maintain a relatively small gap from the middle tier.
- India records the slowest growth among the listed markets, yet its forecast remains strong within the wider market context.
- The pattern resembles a gradual downward slope rather than a sharp separation between high-growth and low-growth markets.
Markets with broadly similar CAGRs can still present different entry conditions due to local infrastructure and automation readiness. The full report provides country-level analysis across North America, Latin America, Europe, East Asia, South Asia, Oceania and the Middle East and Africa.
Country-wise Analysis
- China combines high parcel density with distribution centers that can aggregate returns into large processing batches. Robotic returns demand in China is forecast to rise at 28.0% CAGR from 2026 to 2036, driven by express delivery scale and centralized e-commerce activity. China’s State Council reported in April 2026 that express delivery volume reached 47.73 billion items during the first quarter. The figure supports sustained utilization for robotic intake and sortation at major processing hubs throughout the year. The State Post Bureau provides the national operating context for parcel networks and their service standards. Investment plans should include repair and resale capacity because faster intake creates limited value whenever downstream recovery channels remain congested.
- Japanese facilities often work within tight footprints and handle return streams with a high share of electronics. Adoption in Japan is estimated to expand at 27.0% CAGR through 2036, supported by compact automation and careful product identification. The Ministry of Economy, Trade and Industry reported in August 2025 that Japan’s B2C e-commerce market grew 5.1% in 2024, while the B2C e-commerce penetration rate reached 9.8%. The e-commerce scale creates steady return workloads across electronics and other consumer product categories. Robotics developers need dependable serial capture and battery screening for returned electronics before products enter resale or repair channels. System selection should favor configurable cells that add inspection depth without requiring a complete receiving-area rebuild.
- United States distribution networks combine parcel collection with contract logistics sites and centralized return programs. The USA is projected to post 26.0% CAGR over the forecast period, aided by mature fulfillment infrastructure and high online sales. The USA Census Bureau reported in May 2026 that e-commerce accounted for 16.9% of retail sales during the first quarter. The share indicates a steady flow of products that can bypass store-based inspection before warehouse receiving. FedEx Supply Chain and GXO Logistics provide operating scale for managed return programs across multiple facilities. Commercial contracts should separate robotic throughput from grading accuracy so each performance gap has a clearly accountable owner.
- South Korea has dense parcel infrastructure and consumers who use mobile channels across frequent retail transactions. Robotic return sales in South Korea are predicted to advance at 25.2% CAGR by 2036, reinforced by online shopping activity and short delivery expectations. The Ministry of Data and Statistics reported in February 2026 that online shopping transactions in December 2025 rose 6.2% from December 2024. The same release showed mobile shopping also rose 6.2%, supporting rapid intake and refund processing across dense urban fulfillment networks. Local integrators can use compact robotic cells without major building changes or extended construction schedules. Equipment choices should prioritize flexible vision and packaging tolerance because high-speed parcel networks produce mixed return presentations.
- Germany offers a dense parcel network and an established base of warehouse automation integrators across major logistics corridors. The German sector is projected to record 24.6% CAGR during the forecast period, underpinned by parcel flows and formal handling requirements. Bundesnetzagentur reported in April 2025 that parcel volume reached 4.36 billion items during 2023. The official parcel count shows the throughput available to support automated intake at major logistics hubs. KNAPP can connect return stations with storage systems and warehouse controls across local return-processing facilities. Investment teams should require documented reintegration workflows because faster receiving can create another queue between grading and available inventory.
- European Union adoption is shaped by cross-border commerce and stronger documentation requirements for unsold goods. The regional market is forecast to record 24.0% CAGR through 2036, owing to e-commerce participation and disposal reporting requirements. Eurostat reported in February 2026 that 78% of European Union internet users bought goods or services online during 2025. The online participation rate widens the potential return base across member states and product categories. The European Commission provides a shared policy framework for product treatment records across member states. Automation providers need exportable data fields because national operations may use different warehouse systems and compliance processes.
- India combines expanding digital commerce with logistics networks that vary widely by city and product category. Returns automation demand in India is anticipated to advance at 22.0% CAGR during the forecast period, shaped by digital order growth and uneven facility scale. The Press Information Bureau reported in December 2025 that ONDC had processed more than 326 million cumulative orders and average daily transactions had reached more than 590,000. The order base can create return flows across a broad network of merchants and logistics partners. ONDC gives local logistics operators a defined digital transaction framework for multi-merchant order flows. Modular cells and service contracts can reduce investment risk where parcel density differs sharply between cities.
Who are the notable companies in the robotic returns and reverse logistics market?
Ambi Robotics, Berkshire Grey, Dematic, GXO Logistics, FedEx Supply Chain, UPS and Happy Returns, AutoStore, and KNAPP are the notable companies shaping this market.
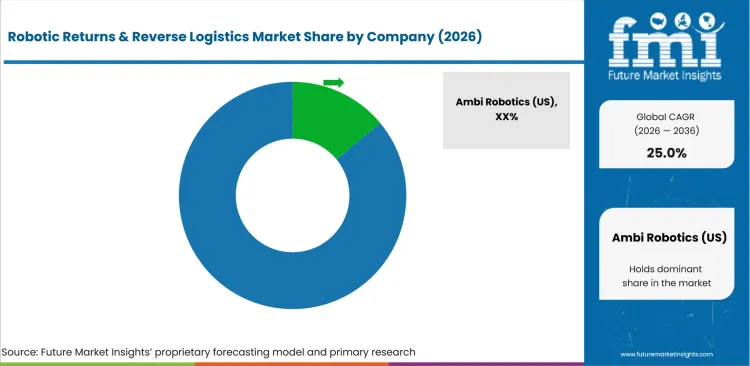
The competitive outlook combines equipment specialists with companies that control return volume and warehouse operations across several sites. Robotic cell developers compete through item coverage and repeatable handling across mixed parcels and damaged packaging. Warehouse platform companies compete through integration with storage systems and control software across the same facility. Logistics groups compete through collection scale and daily operating accountability across several regional processing sites. The contract logistics market analysis provides a useful comparison for service responsibility and performance terms within managed operations. Commercial success depends on clear ownership of exceptions because one weak handoff can erase gains created by a faster robotic cell.
- Ambi Robotics and Berkshire Grey compete for robotic induction and sortation across mixed return categories. Ambi emphasizes production-tested manipulation skills while Berkshire Grey combines robotic picking with parcel sortation across mixed warehouse flows. Their commercial test is consistent item coverage rather than peak speed on one controlled product set.
- GXO Logistics and FedEx Supply Chain operate managed networks that aggregate return volume across several facilities. UPS and Happy Returns add collection scale before products reach centralized return-processing facilities across the United States. The logistics groups can support operating contracts that combine parcel intake with daily accountability for service levels and exception handling.
- AutoStore and KNAPP connect return handling with storage automation and warehouse software across distribution centers. Dematic documented automated return receiving and reverse logistics processing for retail facilities in October 2025. Platform selection depends on integration depth and the ability to preserve product identity through each recovery step.
Competitive Benchmarking: Robotic Returns and Reverse Logistics Market
| Company | Robotic Intake and Sortation | Inspection and Triage | Managed Reverse Operations | Geographic Reach |
|---|---|---|---|---|
| Ambi Robotics | High | High | Low | North America |
| Berkshire Grey | High | Medium | Low | North America and Europe |
| Dematic | Medium | High | Medium | Global |
| GXO Logistics | Medium | Medium | High | Global |
| FedEx Supply Chain | Medium | Medium | High | North America |
| UPS and Happy Returns | Low | Medium | High | United States |
| AutoStore | Medium | Low | Low | Global |
| KNAPP | Medium | Medium | Medium | Global |
Scoring basis: High indicates a documented core capability within the exact workflow and a dedicated commercial offer. Medium indicates direct support through an adjacent platform or a managed service with documented market use. Low indicates limited direct evidence that the company supports the named capability within return operations.
Source basis: Official corporate announcements and investor materials supported by company service descriptions.
Key Developments in the Robotic Returns and Reverse Logistics Market
- In February 2026, Ambi Robotics: Ambi Robotics introduced its AI Skill Suite through the AmbiOS platform. The company stated that the underlying model used more than 250,000 production hours and 150 million processed packages. The licensed skills cover inspection and robotic placement across third-party warehouse systems used for mixed parcel handling. The release gives warehouse operators a path to add tested manipulation functions without replacing every existing robot platform.
- In June 2025, GXO Logistics: GXO introduced GXO IQ as a cloud-based operating platform for logistics workflows. The execution layer includes return workflows and connects warehouse actions with operating data across multiple facilities. GXO stated that the platform processes more than 200 million operating signals across its network each day. The development gives multi-site operators a common data layer for comparing return processing performance and exception volumes.
- In April 2026, UPS and Happy Returns: UPS announced that the Return Bar network had passed 10,000 United States drop-off locations. The expansion added more than 1,700 locations through new retail and shipping partners across the United States. UPS stated that consolidated returns can move from drop-off to retailers in as little as 3.6 days. Greater collection density can support steadier inbound parcel batches for robotic processing hubs during normal operations.
- In June 2026, Berkshire Grey: Berkshire Grey expanded its European operations and opened a customer innovation center in Haarlem. The center supports solution validation and technical work for regional customers considering mixed-product automation projects. The company supplies robotic picking and sortation systems used across warehouse and distribution operations. Local testing capacity can reduce implementation risk for return facilities handling mixed parcels across several European markets.
Key Players in the Robotic Returns and Reverse Logistics Market
Robotic and Warehouse Automation Providers
- Ambi Robotics
- Berkshire Grey
- Dematic
Managed Logistics and Returns Operators
- GXO Logistics
- FedEx Supply Chain
- UPS and Happy Returns
Warehouse Automation Platform Providers
- AutoStore
- KNAPP
Robotic Returns and Reverse Logistics Market - Report Scope
| Coverage field | Report scope |
|---|---|
| Market breakdown | Technology, application, component, end use, business model, and region. |
| Quantitative Units | Revenue in USD Million, CAGR in %. |
| Market Definition | Robotic systems and managed automation used to receive, identify, inspect, sort, route, and prepare returned products within reverse logistics operations. |
| Regions Covered | North America, Latin America, Europe, East Asia, South Asia, Oceania, and Middle East and Africa. |
| Countries Covered | China, Japan, USA, South Korea, Germany, and India, with the European Union included as a regional benchmark. |
| Key Companies Profiled | Ambi Robotics, Berkshire Grey, Dematic, GXO Logistics, FedEx Supply Chain, UPS and Happy Returns, AutoStore, and KNAPP |
| Forecast Period | 2026 to 2036. |
| Approach | Hybrid bottom-up and top-down market sizing supported by primary interviews and official desk research. |
Robotic Returns and Reverse Logistics Market - Research Methodology
| Method | Approach |
|---|---|
| Primary Research | FMI analysts gathered input from manufacturers, service providers, technology developers, distributors, end users, procurement teams, and subject-matter experts. Interviews examined purchasing decisions, product or service evaluation, adoption barriers, approval requirements, pricing considerations, and expectations for technical or commercial support. Respondents were also asked what evidence is required before a trial, pilot, or initial order develops into regular purchasing. |
| Desk Research | Desk research covered government statistics, regulatory publications, trade data, industry associations, technical literature, standards, company filings, product information, and official corporate announcements. Sources were reviewed for relevance, publication date, geographic coverage, and consistency with the defined market scope. Claims relating to performance, applications, approvals, capacity, investment, and commercial activity were retained only when supported by credible public evidence. |
| Market Sizing and Forecasting | The market model combined the baseline value with historical performance, segment structure, pricing and volume indicators, adoption levels, company participation, and country-level demand conditions. Forecast assumptions considered economic activity, investment trends, regulatory developments, technology adoption, purchasing cycles, supply availability, and barriers to wider market use. Segment and regional estimates were reconciled before the final market total was calculated. |
| Data Validation | Estimates were checked against multiple independent indicators, including public data, company activity, trade patterns, industry developments, and findings from primary interviews. Validation also tested whether products, services, applications, and company revenues fell within the defined market boundaries. Adjacent categories, unsupported claims, overlapping revenues, and activities without direct market relevance were excluded to reduce double counting and maintain consistency across segments and countries. |
Robotic Returns and Reverse Logistics Market by Segments
Robotic Returns and Reverse Logistics Market segmented by Technology:
- AI Triage and Sortation Cells
- Machine Vision Grading Systems
- Robotic Picking and Re-kitting Arms
- Autonomous Mobile Robots
- Identification and Data-Capture Systems
Robotic Returns and Reverse Logistics Market segmented by Application:
- Returns Triage
- Inspection and Grading
- Sortation and Routing
- Re-kitting and Repackaging
- Repair, Recycling, and Disposal Routing
Robotic Returns and Reverse Logistics Market segmented by Component:
- Hardware
- Software
- Services
Robotic Returns and Reverse Logistics Market segmented by End Use:
- E-commerce
- Retail Chains
- Third-Party Logistics
- Consumer Electronics
- Apparel and Footwear
Robotic Returns and Reverse Logistics Market segmented by Business Model:
- Direct Purchase
- Equipment Lease
- Pilot Program
- Managed Service
- Robotics as a Service (RaaS)
Robotic Returns and Reverse Logistics Market by Region:
- North America
- United States
- Canada
- Latin America
- Brazil
- Mexico
- Argentina
- Chile
- Western Europe
- Germany
- France
- United Kingdom
- Italy
- Spain
- Benelux
- Nordics
- Eastern Europe
- Poland
- Czech Republic
- Romania
- Hungary
- East Asia
- China
- Japan
- South Korea
- South Asia and Pacific
- India
- ASEAN
- Australia and New Zealand
- Middle East and Africa
- GCC Countries
- South Africa
- Türkiye
- Israel
Research Sources and Bibliography
- National Retail Federation. (2025, October 15). 2025 Retail Returns Landscape.
- UPS. (2026, April 21). UPS and Happy Returns Cement Position as Largest Box-Free, Label-Free Return Network with Expansion to 10,000 USA Locations.
- USA Census Bureau. (2026, May 18). Quarterly Retail E-Commerce Sales Report.
- National Institute of Standards and Technology. (2025, May 22). Towards an Understanding of Robotic Bin-Picking Throughput.
- National Institute of Standards and Technology. (2026, April 27). Bootstrap Metric for Quantifying the Depth Resolution of 3D Sensors.
- FedEx. (2025, March 25). FedEx to Launch FedEx Easy Returns at 3,000 Locations Across the US, Supported by Blue Yonder.
- FedEx. (2025, December 4). FedEx Supply Chain E-Waste Collection Pilot Recognized with SPLC Circularity Leadership Award.
- UPS. (2025, January 5). How We Are Making Customer Returns Easy: Happy Returns and UPS.
- GXO Logistics. (2025, January 9). GXO Signs a New Partnership with Calliope in Italy.
- European Commission. (2026, February 9). New EU Rules to Stop the Destruction of Unsold Clothes and Shoes.
- State Council of the People’s Republic of China. (2026, April 22). China’s Postal Sector Logs Steady Growth in Q1.
- Ministry of Economy, Trade and Industry. (2025, August 26). Results of FY2024 E-Commerce Market Survey Compiled.
- Ministry of Data and Statistics. (2026, February 2). Online Shopping in December 2025.
- Bundesnetzagentur. (2025, April 2). Publication of Postal Market Figures.
- Eurostat. (2026, February). E-Commerce Statistics for Individuals.
- Press Information Bureau. (2025, December 10). 2025 Year End Review for the Department for Promotion of Industry and Internal Trade.
- Ambi Robotics. (2026, February 16). Ambi Robotics Introduces AI Skill Suite Powered by AmbiOS.
- GXO Logistics. (2025, June 26). GXO launches GXO IQ, a first-of-its-kind AI-first platform to power global supply chain operations.
- Berkshire Grey. (2026, June 17). Berkshire Grey Expands European Operations as Demand for Physical AI Accelerates.
- KNAPP. (2026, January 7). Reverse Logistics: Strategies and Technologies for Common Challenges.
- Dematic. (2025, October 1). Turning returns into revenue: Mastering reverse logistics at scale.
This bibliography is provided for reader reference and is not exhaustive. The full report contains the complete reference list and detailed citations
This Report Answers
- How large is the robotic returns and reverse logistics market in 2026 and 2036?
- Which operating pressures support investment in robotic return intake and sortation?
- Why do AI Triage and Sortation Cells hold a 36.0% Technology share in 2026?
- How does Returns Triage influence later grading and recovery decisions?
- Why does Hardware account for 52.0% of Component spending in 2026?
- How do country growth rates differ across China, Japan, the USA, Europe, and India?
- Which companies provide robotic cells, warehouse platforms, or managed return operations?
- What limits automated inspection across damaged packaging and mixed product conditions?
- How can RaaS contracts align capacity with seasonal return volumes?
Frequently Asked Questions
What is driving growth in the robotic returns and reverse logistics market?
High return volumes are increasing the need for faster intake and routing across mixed-product facilities. Robotic cells protect resale value by shortening delays before inspection and recovery decisions.
Who are the key players in the robotic returns and reverse logistics market?
Ambi Robotics, Berkshire Grey, and Dematic provide automation platforms for return handling. GXO Logistics, FedEx Supply Chain, UPS and Happy Returns, AutoStore, and KNAPP support managed or integrated workflows.
What is a notable restraint in the robotic returns and reverse logistics market?
Variable packaging reduces confidence in automated grading across products with uncertain condition. Facilities still need clear exception rules and human review beyond validated inspection limits.
Why should executives track the robotic returns and reverse logistics market?
Returns affect working capital and recovery margin across retail networks. Automation can shorten refund cycles and show which products justify repair, resale, or recycling investment.
What business problem does the robotic returns and reverse logistics market address?
The market addresses slow and inconsistent return intake across facilities handling varied product conditions. Robotic systems create structured records and route goods before warehouse delays reduce recovery value.
What should logistics and retail teams evaluate in the robotic returns and reverse logistics market?
Teams should compare robotic throughput with grading accuracy across the product classes they process. They should test coverage and support terms before expanding a pilot across several facilities.
What limits return on investment in the robotic returns and reverse logistics market?
Low equipment use and weak downstream recovery capacity reduce returns on capital. Unclear support terms can increase downtime during the peak periods that justify automation investment.
What supports long-term confidence in the robotic returns and reverse logistics market?
Documented performance across mixed products supports confidence during expansion decisions. Clear ownership of exceptions and maintenance gives operators a practical basis for adding robotic capacity.
Preview the report firsthand - request a free sample
Get SampleGet the brochure for pricing and purchase details.
Get PDFTable of Content
- Key Takeaways
- Market Size and CAGR
- Top Growth Driver
- Fastest Growing Segment
- Leading Region
- Key Companies
- Emerging Opportunities
- Executive Summary
- Global Market Outlook
- Demand-side Trends
- Supply-side Trends
- Technology Roadmap Analysis
- Analysis and Recommendations
- Analyst Perspective (What is happening? Why now? What should investors know?)
- Key Questions Answered
- How large is the market?
- What is the CAGR?
- What are key trends?
- Which region dominates?
- Who are the leaders?
- Market Overview
- Market Coverage / Taxonomy
- Market Definition / Scope / Limitations
- Research Methodology
- Chapter Orientation
- Analytical Lens and Working Hypotheses
- Market Structure, Signals, and Trend Drivers
- Benchmarking and Cross-market Comparability
- Market Sizing, Forecasting, and Opportunity Mapping
- Research Design and Evidence Framework
- Desk Research Programme (Secondary Evidence)
- Expert Input and Fieldwork (Primary Evidence)
- Tooling, Models, and Reference Databases
- Data Engineering and Model Build
- Quality Assurance and Audit Trail
- Market Background
- Market Dynamics (Drivers, Restraints, Opportunity, Trends)
- Scenario Forecast (Optimistic, Likely, Conservative)
- Impact Analysis
- AI Impact
- Sustainability Impact
- Regulatory Impact
- Technology Impact
- Consumer / Buyer Analysis
- Purchase Drivers
- Adoption Barriers
- Buyer Journey
- Opportunity Map Analysis
- Product Life Cycle Analysis
- Supply Chain Analysis
- Investment Feasibility Matrix
- Value Chain Analysis
- PESTLE and Porter's Analysis
- Regulatory Landscape
- Regional Parent Market Outlook
- Production and Consumption Statistics
- Import and Export Statistics
- Global Market Analysis and Forecast, 2021 to 2036
- Historical Market Size Value (USD Mn) Analysis, 2021 to 2025
- Current and Future Market Size Value (USD Mn) Projections, 2026 to 2036
- Y-o-Y Growth Trend Analysis
- Absolute $ Opportunity Analysis
- Global Market Pricing Analysis, 2021 to 2036
- Global Market Analysis and Forecast, By Technology, 2021 to 2036
- Introduction / Key Findings
- Historical Market Size Value (USD Mn) Analysis By Technology, 2021 to 2025
- Current and Future Market Size Value (USD Mn) Analysis and Forecast By Technology, 2026 to 2036
- AI Triage and Sortation Cells
- Machine Vision Grading Systems
- Robotic Picking and Re-kitting Arms
- Autonomous Mobile Robots
- Identification and Data-Capture Systems
- Y-o-Y Growth Trend Analysis By Technology, 2021 to 2025
- Absolute $ Opportunity Analysis By Technology, 2026 to 2036
- Global Market Analysis and Forecast, By Application, 2021 to 2036
- Introduction / Key Findings
- Historical Market Size Value (USD Mn) Analysis By Application, 2021 to 2025
- Current and Future Market Size Value (USD Mn) Analysis and Forecast By Application, 2026 to 2036
- Returns Triage
- Inspection and Grading
- Sortation and Routing
- Re-kitting and Repackaging
- Repair, Recycling, and Disposal Routing
- Y-o-Y Growth Trend Analysis By Application, 2021 to 2025
- Absolute $ Opportunity Analysis By Application, 2026 to 2036
- Global Market Analysis and Forecast, By Component, 2021 to 2036
- Introduction / Key Findings
- Historical Market Size Value (USD Mn) Analysis By Component, 2021 to 2025
- Current and Future Market Size Value (USD Mn) Analysis and Forecast By Component, 2026 to 2036
- Hardware
- AI software
- Services
- Hardware
- Y-o-Y Growth Trend Analysis By Component, 2021 to 2025
- Absolute $ Opportunity Analysis By Component, 2026 to 2036
- Global Market Analysis and Forecast, By End-use, 2021 to 2036
- Introduction / Key Findings
- Historical Market Size Value (USD Mn) Analysis By End-use, 2021 to 2025
- Current and Future Market Size Value (USD Mn) Analysis and Forecast By End-use, 2026 to 2036
- E-commerce
- Retail Chains
- Third-Party Logistics
- Consumer Electronics
- Apparel and Footwear
- Y-o-Y Growth Trend Analysis By End-use, 2021 to 2025
- Absolute $ Opportunity Analysis By End-use, 2026 to 2036
- Global Market Analysis and Forecast, By Business Model, 2021 to 2036
- Introduction / Key Findings
- Historical Market Size Value (USD Mn) Analysis By Business Model, 2021 to 2025
- Current and Future Market Size Value (USD Mn) Analysis and Forecast By Business Model, 2026 to 2036
- Direct Purchase
- Equipment Lease
- Pilot Program
- Managed Service
- Robotics as a Service (RaaS)
- Y-o-Y Growth Trend Analysis By Business Model, 2021 to 2025
- Absolute $ Opportunity Analysis By Business Model, 2026 to 2036
- Global Market Analysis and Forecast, By Region, 2021 to 2036
- Introduction
- Historical Market Size Value (USD Mn) Analysis By Region, 2021 to 2025
- Current Market Size Value (USD Mn) Analysis and Forecast By Region, 2026 to 2036
- North America
- Latin America
- Western Europe
- Eastern Europe
- East Asia
- South Asia and Pacific
- Middle East & Africa
- Market Attractiveness Analysis By Region
- North America Market Analysis and Forecast, By Country, 2021 to 2036
- Historical Market Size Value (USD Mn) Trend Analysis By Market Taxonomy, 2021 to 2025
- Market Size Value (USD Mn) Forecast By Market Taxonomy, 2026 to 2036
- By Country
- USA
- Canada
- By Technology
- By Application
- By Component
- By End-use
- By Business Model
- By Country
- Market Attractiveness Analysis
- By Country
- By Technology
- By Application
- By Component
- By End-use
- By Business Model
- Key Takeaways
- Latin America Market Analysis and Forecast, By Country
- Historical Market Size Value (USD Mn) Trend Analysis By Market Taxonomy, 2021 to 2025
- Market Size Value (USD Mn) Forecast By Market Taxonomy, 2026 to 2036
- By Country
- Brazil
- Mexico
- Chile
- Rest of Latin America
- By Technology
- By Application
- By Component
- By End-use
- By Business Model
- By Country
- Market Attractiveness Analysis
- By Country
- By Technology
- By Application
- By Component
- By End-use
- By Business Model
- Key Takeaways
- Western Europe Market Analysis and Forecast, By Country
- Historical Market Size Value (USD Mn) Trend Analysis By Market Taxonomy, 2021 to 2025
- Market Size Value (USD Mn) Forecast By Market Taxonomy, 2026 to 2036
- By Country
- Germany
- UK
- Italy
- Spain
- France
- Nordic
- BENELUX
- Rest of Western Europe
- By Technology
- By Application
- By Component
- By End-use
- By Business Model
- By Country
- Market Attractiveness Analysis
- By Country
- By Technology
- By Application
- By Component
- By End-use
- By Business Model
- Key Takeaways
- Eastern Europe Market Analysis and Forecast, By Country
- Historical Market Size Value (USD Mn) Trend Analysis By Market Taxonomy, 2021 to 2025
- Market Size Value (USD Mn) Forecast By Market Taxonomy, 2026 to 2036
- By Country
- Russia
- Poland
- Hungary
- Balkan & Baltic
- Rest of Eastern Europe
- By Technology
- By Application
- By Component
- By End-use
- By Business Model
- By Country
- Market Attractiveness Analysis
- By Country
- By Technology
- By Application
- By Component
- By End-use
- By Business Model
- Key Takeaways
- East Asia Market Analysis and Forecast, By Country
- Historical Market Size Value (USD Mn) Trend Analysis By Market Taxonomy, 2021 to 2025
- Market Size Value (USD Mn) Forecast By Market Taxonomy, 2026 to 2036
- By Country
- China
- Japan
- South Korea
- By Technology
- By Application
- By Component
- By End-use
- By Business Model
- By Country
- Market Attractiveness Analysis
- By Country
- By Technology
- By Application
- By Component
- By End-use
- By Business Model
- Key Takeaways
- South Asia and Pacific Market Analysis and Forecast, By Country
- Historical Market Size Value (USD Mn) Trend Analysis By Market Taxonomy, 2021 to 2025
- Market Size Value (USD Mn) Forecast By Market Taxonomy, 2026 to 2036
- By Country
- India
- ASEAN
- Australia & New Zealand
- Rest of South Asia and Pacific
- By Technology
- By Application
- By Component
- By End-use
- By Business Model
- By Country
- Market Attractiveness Analysis
- By Country
- By Technology
- By Application
- By Component
- By End-use
- By Business Model
- Key Takeaways
- Middle East & Africa Market Analysis and Forecast, By Country
- Historical Market Size Value (USD Mn) Trend Analysis By Market Taxonomy, 2021 to 2025
- Market Size Value (USD Mn) Forecast By Market Taxonomy, 2026 to 2036
- By Country
- Kingdom of Saudi Arabia
- Other GCC Countries
- Türkiye
- South Africa
- Other African Union
- Rest of Middle East & Africa
- By Technology
- By Application
- By Component
- By End-use
- By Business Model
- By Country
- Market Attractiveness Analysis
- By Country
- By Technology
- By Application
- By Component
- By End-use
- By Business Model
- Key Takeaways
- Key Countries Market Analysis
- USA
- Pricing Analysis
- Market Share Analysis, 2025
- By Technology
- By Application
- By Component
- By End-use
- By Business Model
- Canada
- Pricing Analysis
- Market Share Analysis, 2025
- By Technology
- By Application
- By Component
- By End-use
- By Business Model
- Mexico
- Pricing Analysis
- Market Share Analysis, 2025
- By Technology
- By Application
- By Component
- By End-use
- By Business Model
- Brazil
- Pricing Analysis
- Market Share Analysis, 2025
- By Technology
- By Application
- By Component
- By End-use
- By Business Model
- Chile
- Pricing Analysis
- Market Share Analysis, 2025
- By Technology
- By Application
- By Component
- By End-use
- By Business Model
- Germany
- Pricing Analysis
- Market Share Analysis, 2025
- By Technology
- By Application
- By Component
- By End-use
- By Business Model
- UK
- Pricing Analysis
- Market Share Analysis, 2025
- By Technology
- By Application
- By Component
- By End-use
- By Business Model
- Italy
- Pricing Analysis
- Market Share Analysis, 2025
- By Technology
- By Application
- By Component
- By End-use
- By Business Model
- Spain
- Pricing Analysis
- Market Share Analysis, 2025
- By Technology
- By Application
- By Component
- By End-use
- By Business Model
- France
- Pricing Analysis
- Market Share Analysis, 2025
- By Technology
- By Application
- By Component
- By End-use
- By Business Model
- India
- Pricing Analysis
- Market Share Analysis, 2025
- By Technology
- By Application
- By Component
- By End-use
- By Business Model
- ASEAN
- Pricing Analysis
- Market Share Analysis, 2025
- By Technology
- By Application
- By Component
- By End-use
- By Business Model
- Australia & New Zealand
- Pricing Analysis
- Market Share Analysis, 2025
- By Technology
- By Application
- By Component
- By End-use
- By Business Model
- China
- Pricing Analysis
- Market Share Analysis, 2025
- By Technology
- By Application
- By Component
- By End-use
- By Business Model
- Japan
- Pricing Analysis
- Market Share Analysis, 2025
- By Technology
- By Application
- By Component
- By End-use
- By Business Model
- South Korea
- Pricing Analysis
- Market Share Analysis, 2025
- By Technology
- By Application
- By Component
- By End-use
- By Business Model
- Russia
- Pricing Analysis
- Market Share Analysis, 2025
- By Technology
- By Application
- By Component
- By End-use
- By Business Model
- Poland
- Pricing Analysis
- Market Share Analysis, 2025
- By Technology
- By Application
- By Component
- By End-use
- By Business Model
- Hungary
- Pricing Analysis
- Market Share Analysis, 2025
- By Technology
- By Application
- By Component
- By End-use
- By Business Model
- Kingdom of Saudi Arabia
- Pricing Analysis
- Market Share Analysis, 2025
- By Technology
- By Application
- By Component
- By End-use
- By Business Model
- Türkiye
- Pricing Analysis
- Market Share Analysis, 2025
- By Technology
- By Application
- By Component
- By End-use
- By Business Model
- South Africa
- Pricing Analysis
- Market Share Analysis, 2025
- By Technology
- By Application
- By Component
- By End-use
- By Business Model
- USA
- Market Structure Analysis
- Competition Dashboard
- Competition Benchmarking
- Market Share Analysis of Top Players
- By Regional
- By Technology
- By Application
- By Component
- By End-use
- By Business Model
- Emerging Startups
- Innovation Benchmarking
- Competition Analysis
- Competition Deep Dive
- Ambi Robotics (US)
- Overview
- Product Portfolio
- Profitability by Market Segments
- Sales Footprint
- Strategy Overview
- Marketing Strategy
- Product Strategy
- Channel Strategy
- Nimble (US)
- Covariant lines (US)
- Ambi Robotics (US)
- Case Studies
- Success Stories
- Recent Developments
- Competition Deep Dive
- Assumptions & Acronyms Used


