

- Market Size (2026)
- USD 520.6 Mn
- Forecast (2036)
- USD 941.1 Mn
- CAGR (2026 to 2036)
- 6.1%
How big is the Sand Trap Louver Market in 2026?
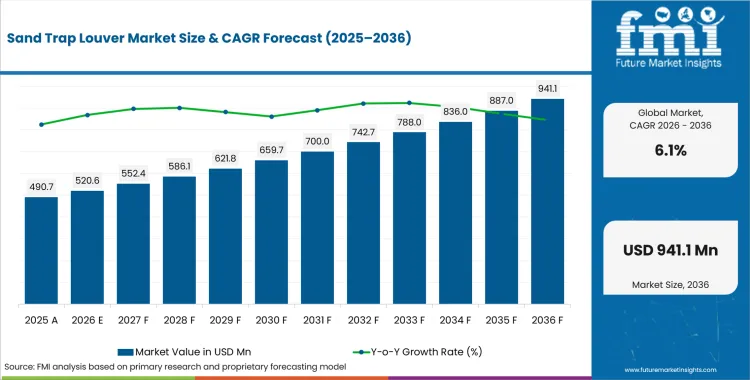
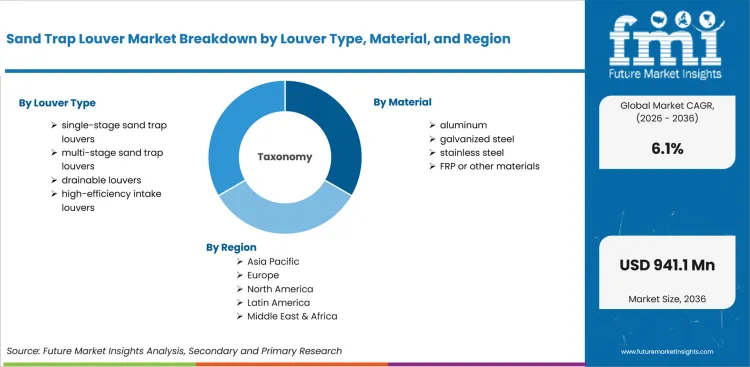
USD 520.6 million in 2026 and USD 941.1 million by 2036 at a 6.1% CAGR.
Sales of sand trap louvers are estimated to rise at 6.1% CAGR through 2036, increasing valuation from USD 520.6 million in 2026 to USD 941.1 million by 2036. Construction and industrial ventilation projects are keeping intake protection visible in dusty outdoor locations. USA Census Bureau reported April 2026 construction spending at USD 2,172.4 billion on a seasonally adjusted annual basis. That spending keeps specification risk visible in large project pipelines. Contractors now evaluate sand trap louvers beside HVAC equipment outlook as pre-filter hardware for dusty outdoor intake locations.
India and China are estimated to expand faster as infrastructure work and industrial ventilation needs increase demand for intake protection. The United States, Germany and the United Kingdom are expected to grow through tested airflow evidence, wind-driven sand rejection and documented contractor submittals. Safe Work Australia strengthened crystalline silica rules from September 2024 for substances containing at least 1.0% crystalline silica, which keeps dust exposure visible beyond factory sites. Mechanical contractors are projected to specify sand trap louvers at sites exposed to desert wind, process dust or outdoor intake contamination.
Mechanical contractors and OEM account teams are expected to specify sand trap louvers at sites exposed to desert wind or process dust. Project engineers need intake hardware that separates sand early and protects air-handling units before maintenance cost rises. EPA air-sensor quality guidance updated in April 2026 placed quality assurance planning inside monitoring work, which reinforces the need for tested intake protection near dusty sites. Specification teams compare air handling units beside louvers before approving direct supply routes.
Key Takeaways
-
Demand for sand trap louvers is driven by the need for dust control and intake uptime, with documentation requirements shifting sourcing away from price-only comparisons toward tested louver files.
-
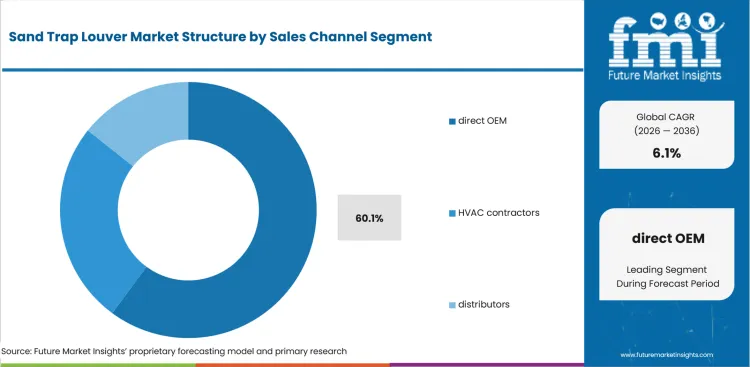
By sales channel, direct OEM is expected to lead with 60.1% share in 2026, supported by order control and direct technical support accountability.
-
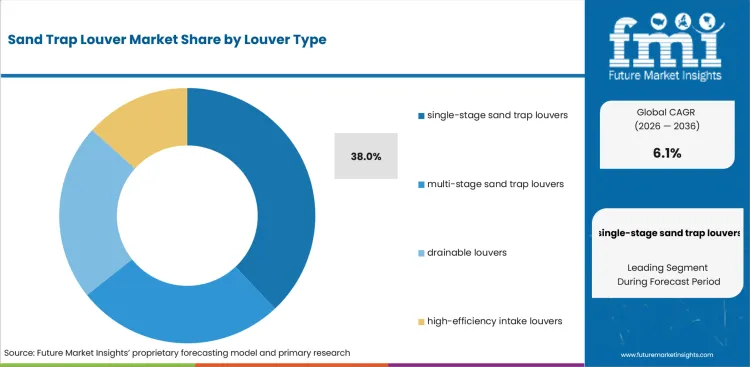
Single-stage sand trap louvers are the dominant louver type, projected to hold 38.0% share in 2026, reflecting simpler intake layouts and easier replacement planning.
-
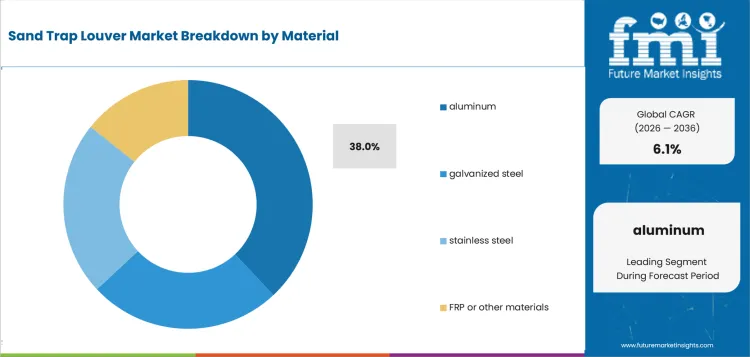
Aluminum is estimated to lead the material category with 38.0% share in 2026, driven by corrosion resistance and lighter installation handling.
-
HVAC air intakes are anticipated to lead the application segment with 35.7% share in 2026, attributable to visible filter-loading risk in dusty buildings.
-
Integration into existing intake designs, variable dust and sand conditions, and specification/testing requirements remain key factors shaping vendor selection over price-only comparisons.
-
Competition centers on Greenheck, Ruskin, TROX, Systemair, Construction Specialties, Swegon, and Air Master Equipments Emirates, with vendors differentiating through louver testing evidence, order routes, and regional job-site support.
Analyst Perspective
"Commercial preference in the sand trap louver market is increasingly shaped by a supplier's ability to demonstrate effective sand separation while maintaining the required airflow for demanding environments. Contractors and OEMs are placing greater emphasis on proven performance data, complete technical documentation, and dependable support throughout project execution. Suppliers that simplify installation, maintenance planning, and replacement scheduling are more likely to strengthen long-term customer relationships."
- Nikhil Kaitwade, Principal Analyst at Future Market Insights
Source: FMI's proprietary forecasting model and primary research
How is the Sand Trap Louver Market segmented?
The sand trap louver industry is segmented by louver type, material, application, end use, sales channel, and region.
The sand trap louver market is segmented by louver type, material, application, end use, sales channel, and region. By louver type, the market covers single-stage sand trap louvers, multi-stage sand trap louvers, drainable louvers, and high-efficiency intake louvers. By material, it covers aluminum, galvanized steel, stainless steel, and FRP or other materials. By application, it covers HVAC air intakes, gas turbine inlets, industrial ventilation, and data center or telecom sites. By end use, it covers oil and gas, power generation, commercial buildings, and industrial facilities. By sales channel, it covers direct OEM, HVAC contractors, and distributors. Regional coverage includes North America, Latin America, Europe, East Asia, South Asia and Pacific, and Middle East and Africa aligned to mechanical ventilation equipment.
How does direct OEM shape sales channel demand?
Direct OEM purchasing is tied to drawings, submittals and response time during construction schedules. Project managers use direct routes to keep design clarifications close to fabrication schedules during staged construction work
- By sales channel, direct OEM is projected to account for 60.1% of demand in 2026 driven by order control and fewer approval handoffs. EPA quality assurance planning updated in April 2026 makes responsibility assignment more visible, which supports direct technical communication before site delivery and equipment commissioning. Direct routes also reduce the risk of drawing mismatches during staged packaged equipment release cycles.
- Direct OEM demand is expected to grow among OEM account teams attributable to specification control and faster issue resolution. Contractors comparing building automation systems also expect intake products to arrive with drawings and installation records that reduce coordination work during staged project delivery. The route fits accounts that link purchase approval to clear ownership after installation workflows.
What supports demand for single-stage sand trap louvers within louver type?
Single-stage designs are often selected for exposed intakes where project teams need sand separation without complex access requirements.The category fits projects where installation simplicity and service access remain central during retrofit or plant-room work. Engineers also use this format when maintenance teams need direct inspection access at the intake face.
- By louver type, single-stage sand trap louvers are estimated to hold 38.0% of demand in 2026 owing to simpler intake layouts and easier service planning. TROX states that AWSL units separate sand and large dust particles, which gives engineers a clear pre-filter function before conventional filtration. The format also fits projects that need straightforward replacement access during routine service work.
- Single-stage adoption is gaining momentum in exposed commercial intake projects supported by lower maintenance complexity and simpler louver banks. Engineers reviewing acoustic louver panels often compare airflow, noise and dust protection together before selecting a louver package for façade or plant-room openings. Maintenance teams value designs that do not add access burden after installation work begins.
How do engineers evaluate aluminum within the material category?
Material choice is driven by corrosion exposure, weight limits and coating expectations at the building face. Aluminum gains attention due to lighter handling and corrosion control needs that do not widen approval work. Contractors also prefer material choices that keep façade alignment simple during site installation and final inspection.
- By material, aluminum is forecast to represent 38.0% of demand in 2026 supported by corrosion resistance and lower handling burden. Greenheck listed 27 standard louver colors in April 2025, which makes coating choice easier for contractors matching façade requirements and intake duty. Aluminum supports project teams that need lighter panels and predictable finish records during approval.
- Aluminum is drawing attention from contractors shaped by site handling limits and coating review cycles at exposed building faces. Facility teams using marine HVAC systems in coastal or dust-prone locations also assess corrosion risk before approving replacement louvers for intake zones. The material fits accounts that want simpler installation without losing protective finish options on exposed façades.
What drives HVAC air intakes within application demand?
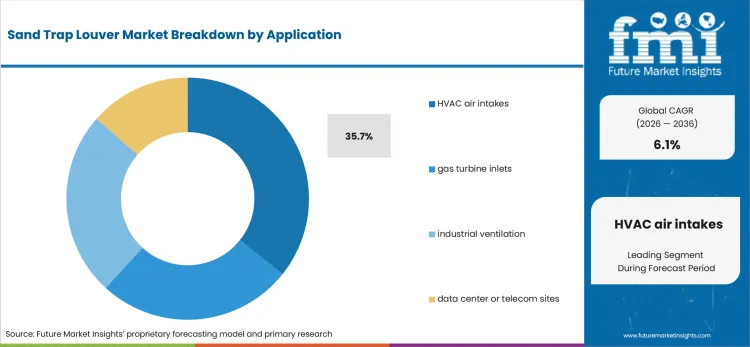
Filter loading creates visible service cost and downtime exposure once sand reaches outdoor ducts or equipment rooms. HVAC intake decisions then become commercial because operators must protect coils, filters and fan sections. Systemair states that louvres safeguard ventilation duct ends from dust and sand ingress, which links the product directly to air filtration burden.
- By application, HVAC air intakes are likely to capture 35.7% of demand in 2026 attributable to filter protection and service access. Systemair states that louvres reduce the load on ventilation filtration equipment, which supports louver use at outdoor duct openings exposed to sand. The application also gives facility teams a visible maintenance-cost argument during budget review planning.
- Purchase activity for HVAC air intake louvers is anticipated to rise driven by dust exposure at plant rooms and rooftops. Operators specifying cleanroom air handling units need intake separation records before accepting products near controlled airflow environments and service-sensitive spaces. Project teams also test whether access panels support routine cleaning without disrupting scheduled maintenance.
How is oil and gas positioned within end use demand?
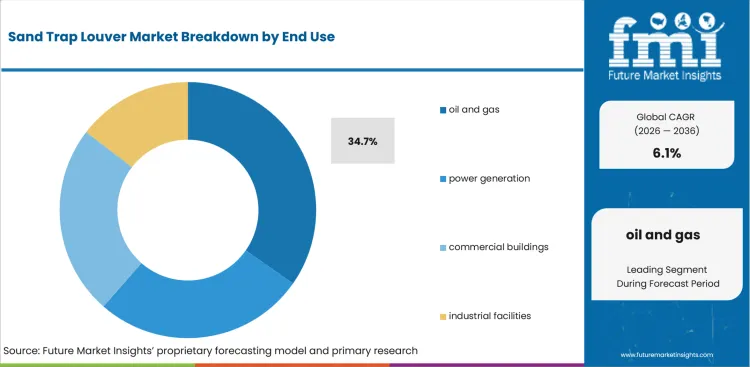
Oil and gas facilities use louvers where intake protection connects to compressor rooms, turbine packages and site ventilation. The USA Energy Information Administration reported marketed natural gas production of 118.5 Bcf/d in 2025, which keeps intake uptime visible across energy infrastructure. Product qualification centers on duty rating, corrosion exposure and replacement access for remote sites. Harsh operating sites also raise the value of documented sand separation before supplier approval.
- Oil and gas end use is set to lead its category with 34.7% share in 2026 due to uptime exposure and harsh intake locations.
- Oil and gas operators are expected to favor documented louver packages due to sand exposure and maintenance-access risk. Engineers connecting louvers to critical power cooling also review airflow loss and site service before approving the same supplier across multiple energy assets. The end-use case depends on reducing service exposure without adding inspection complexity at remote facilities.
What are the drivers, restraints, and opportunities in the Sand Trap Louver Market?
Near-term purchases are being shaped by outdoor-air protection and approval evidence gaps. Retrofit-led channel access is outlined below.
- Driver: Dust exposure and intake uptime are expected to push project teams toward louvers that reduce downstream filter loading.
- Restraint: Adoption is anticipated to slow where contractors lack test records and local service ownership during qualification.
- Opportunity: Retrofit work in dust-prone assets is projected to open account access for suppliers that document installation and replacement support.
Outdoor-air protection is expected to receive more budget attention in sites exposed to silica dust and wind-borne sand. Safe Work Australia strengthened crystalline silica regulation from September 2024 for materials containing at least 1.0% crystalline silica. Dust-control scrutiny gives engineers a clearer reason to review intake separation before filters and coils carry the maintenance burden. Specification files that explain sand removal and airflow loss are expected to shorten internal approval cycles.
Project teams are likely to delay product change if test data, coating records and field support remain unclear. EPA quality assurance guidance updated in April 2026 explains that a quality assurance project plan defines how data are used and reviewed. A similar governance approach is expected to influence louver qualification because engineers need evidence that matches the site condition. Local service ownership then decides whether a trial product reaches repeat ordering in exposed intake projects.
Retrofit channels are projected to convert service friction into a practical entry route for louver manufacturers. Air Master Equipments Emirates lists high-efficiency sand trap louvers and stainless steel sand trap variants in its 2026 product range. The range points to demand for configured intake protection across Gulf project environments with heavy dust exposure. Suppliers linking product variants to AI data center cooling are expected to receive closer review where dusty air threatens continuous cooling duty.
Which country CAGRs are profiled in the Sand Trap Louver Market?
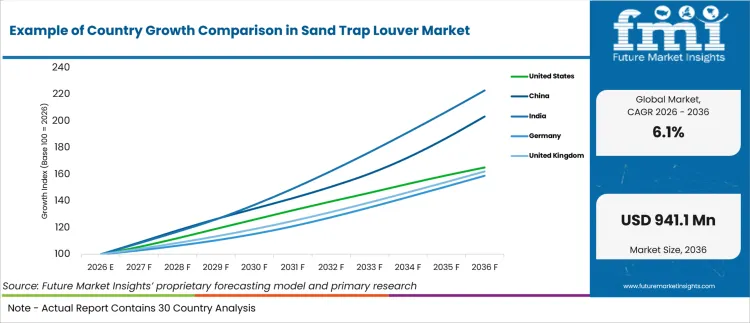
| Country | CAGR |
|---|---|
| United States | 5.15% |
| China | 7.35% |
| India | 8.35% |
| Germany | 4.75% |
| United Kingdom | 4.95% |
| Japan | 4.55% |
| South Korea | 5.95% |
Source: FMI's proprietary forecasting model and primary research
How do country-level CAGRs compare in the Sand Trap Louver Market?
The country comparison spans 3.8 percentage points and highlights three distinct growth groups across the Sand Trap Louver Market. India and China form the upper growth tier with only 1.0 percentage point separating the two markets. South Korea and the United States create a closely aligned middle group, while the United Kingdom, Germany and Japan remain within a 0.4-point band, reflecting a relatively concentrated lower-growth segment. Countries with expanding commercial construction activity, industrial infrastructure development and greater investment in HVAC systems generally demonstrate stronger market growth.
-
India holds the leading position within the comparison as rapid commercial construction, industrial expansion and rising demand for efficient ventilation systems continue to support the installation of sand trap louvers.
-
China remains 1.0 percentage point below India and reflects a market where large-scale infrastructure projects and continued investment in industrial facilities sustain demand for sand trap louvers.
-
South Korea stands 1.4 percentage points below China, highlighting the role of advanced manufacturing facilities and modern commercial buildings in supporting the adoption of high-performance ventilation components.
-
The United States remains 0.8 percentage points below South Korea as demand for durable air intake systems continues across industrial buildings, data centers and critical infrastructure projects.
-
The United Kingdom sits 0.2 percentage points below the United States, reflecting steady replacement activity and continued emphasis on energy-efficient ventilation solutions in commercial buildings.
-
Germany remains 0.2 percentage points below the United Kingdom as industrial engineering standards and demand for reliable air filtration systems continue to support market expansion.
-
Japan records a CAGR 0.2 percentage points below Germany, reflecting a mature market where demand is supported by high-performance building ventilation systems and long-term investment in facility efficiency.
Comparable CAGRs can still produce different market entry conditions. Differences in construction activity, industrial investment, building regulations and HVAC performance requirements influence adoption patterns and long-term market development. The full report provides country-level CAGR analysis across North America, Latin America, Europe, East Asia, South Asia, Oceania and the Middle East and Africa.
Country-wise Analysis
Country growth is expected to reflect project exposure, service access and documentation discipline across each construction base. India is projected at 8.35% CAGR and China is forecast at 7.35% CAGR due to infrastructure scale and exposed-site sourcing . South Korea is estimated at 5.95% CAGR, supported by industrial project screening. The United States is anticipated at 5.15% CAGR under replacement-led demand across public and institutional assets. The United Kingdom and Germany are projected at 4.95% and 4.75% CAGR under evidence-led retrofit cycles. Japan is predicted at 4.55% CAGR due to selective urban building work.
- Public construction work keeps United States louver demand tied to replacement schedules and documented service response. The United States is anticipated to record 5.15% CAGR by 2036 supported by established HVAC service networks and formal specification review. The USA Census Bureau reported public construction spending at USD 532.7 billion annualized in April 2026, which keeps infrastructure intake protection visible for municipal and institutional assets. Facility managers often require AMCA-style test files and local stocking before changing approved louvers in retrofit work.
- China’s building pipeline keeps air-intake protection tied to project scale and supplier delivery discipline. Sand trap louver demand in China is forecast to rise at 7.35% CAGR over the forecast period driven by high construction volume and fast equipment scheduling. The National Bureau of Statistics of China reported floor space under construction at 6.599 billion square meters in 2025. The scale raises the value of dependable intake components for towers, industrial parks and utility buildings.
- India’s formal capital spending cycle is creating more visible demand for intake hardware in public and industrial projects. Adoption of sand trap louvers in India is estimated to expand at 8.35% CAGR through 2036 owing to infrastructure capex and dust-exposed sites. India’s Press Information Bureau reported effective capital expenditure at about 4.0% of GDP for FY25, which supports larger public works pipelines where ventilation protection enters tender packages. Cost remains a strict filter during approval, so local installer support becomes part of the purchase case.
- Germany’s specification culture gives sand trap louvers a slower but evidence-heavy path into retrofit and new-build work. The Germany sector is projected to record 4.75% CAGR during the assessment period reinforced by documentation needs in nonresidential construction. Destatis reported 149.7 thousand building permits for building construction in 2025, which keeps product qualification connected to formal approval records.
- Repair work in the United Kingdom keeps intake protection linked to asset life extension and controlled maintenance budgets. The United Kingdom outlook is anticipated to advance at 4.95% CAGR over the assessment period supported by repair and maintenance spending. The Office for National Statistics reported construction output grew 1.6% in the three months to April 2026, which keeps retrofit work visible for HVAC intake upgrades. Contractors often need distributor support before switching approved components on live commercial estate projects.
- Japan’s urban office starts create a selective intake protection route for compact building projects and careful design review. Japan is estimated to post 4.55% CAGR over the forecast period shaped by urban office work and strict specification checks. MLIT reported Tokyo gross office building starts of about 1.952 million square meters in 2024, which supports demand for louvers that fit dense city building designs. Engineering teams often prioritize compact depth and coating consistency during equipment-room planning stages for city sites.
- South Korea’s monthly construction data infrastructure supports faster screening of ventilation components for industrial and commercial projects. Sand trap louver sales in South Korea are forecast to expand at 5.95% CAGR by 2036 propelled by export-linked facilities and formal order tracking. The Ministry of Data and Statistics listed Monthly Industrial Statistics for April 2026 with a release date of May 29 2026.
Who are the notable companies in the Sand Trap Louver Market?
Greenheck, Ruskin, TROX, Systemair, Construction Specialties, Swegon, FlaktGroup, Air Master Equipments Emirates, and Holyoake are the notable companies shaping this market.
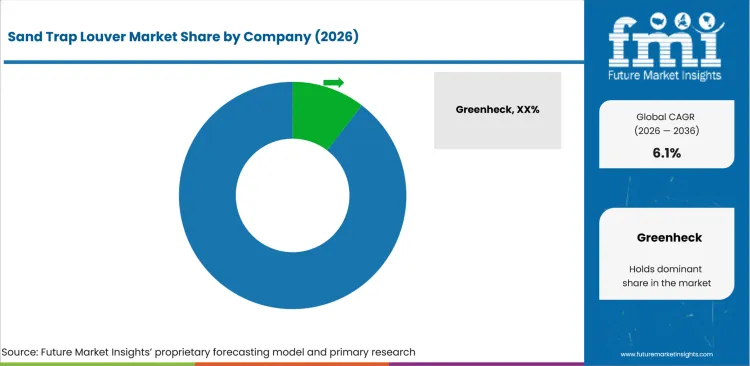
Competition is moderately concentrated around certified louver lines, coating options and local project support. Established multinational brands are expected to hold stronger specification access where consultants require test files and repeatable submittal packages. Regional manufacturers compete where sand exposure, lead time and field coordination carry more weight than global portfolio breadth.
- Specification-led accounts are expected to evaluate Greenheck and Ruskin first where louver testing and submittal discipline decide approval. Greenheck’s louver portfolio gives contractors coating and model depth during façade and intake review workflows. Ruskin adds extreme-weather louver experience for projects that need wind-driven rain and mounting evidence beside dust protection.
- Engineering teams often review TROX and Systemair where intake protection must reduce sand entry before filtration. TROX positions its AWSL unit as a pre-filter for dusty air-conditioning plants and equipment rooms. Systemair frames louvres as a first-stage barrier against water, dust and sand at ventilation duct ends.
- Building-envelope projects give Construction Specialties and Swegon a different competitive route inside façade-linked specifications. Construction Specialties benefits from architectural specification access at the building face during design review workflows. Swegon supports air-handling coordination through AHU Design releases, which helps consultants align intake decisions with wider equipment planning during early design review.
- Regional service access is expected to favor FlaktGroup, Air Master Equipments Emirates and Holyoake where dusty climates require faster replacement support. Air Master offers several sand trap louver variants for Gulf project conditions and exposed-site requirements. Holyoake and FlaktGroup are better suited for accounts that value local engineering support and repeat supply reliability.
Competitive Benchmarking: Sand Trap Louver Market
| Company | Dust Separation Fit | Specification Support | Project Channel Fit | Service Reach |
|---|---|---|---|---|
| Greenheck | High | Strong | Global | Strong |
| Ruskin | High | Strong | Global | Strong |
| TROX | High | Strong | Global | High |
| Systemair | High | Medium | Global | High |
| Construction Specialties | Medium | Strong | Global | Medium |
| Swegon | Medium | Strong | Global | High |
| FlaktGroup | Medium | Medium | Regional | High |
| Air Master Equipments Emirates | Strong | Medium | Regional | Country-specific |
| Holyoake | Medium | Medium | Regional | High |
Source: Future Market Insights competitive analysis, 2026. Ratings reflect relative portfolio relevance and workflow fit across intake protection projects during sourcing review. Service capability and geographic reach shape the remaining comparison for specification teams during supplier screening.
Key Developments in the Sand Trap Louver Market
- In June 2026, Greenheck introduced direct drive plenum fans as standard on ERVe energy recovery ventilators. The update targeted higher airflow in energy recovery units used across commercial ventilation projects.
- In September 2025, Ruskin launched a new flange mounting option for the XP500 aluminum extreme weather louver. The option was designed for projects needing easier installation on severe-weather louver applications at exposed openings.
- In September 2025, Swegon released AHU Design version 4.7.0 to support air-handling unit planning and configuration decisions. The development is expected to make intake coordination more visible during early HVAC design.
- In November 2024, Air Master Equipments Emirates reported penthouse louver supply to Hilton Al Khobar. The work supported a hospitality project in a Gulf environment exposed to heat, dust and service-access constraints.
Key Players in the Sand Trap Louver Market
Global louver and air-control manufacturers
- Greenheck
- Ruskin
- TROX
- Systemair
Building-envelope and air-handling specialists
- Construction Specialties
- Swegon
- FlaktGroup
Regional sand trap louver suppliers
- Air Master Equipments Emirates
- Holyoake
Sand Trap Louver Market - Report Scope
| Coverage field | Report scope |
|---|---|
| Market breakdown | Sand Trap Louver Market Breakdown By Louver Type, Material, Application, End Use, Sales Channel, and Region |
| Market Definition | Sand trap louvers are exterior intake louver assemblies that separate wind-driven sand and large dust particles before incoming air reaches HVAC, turbine or industrial ventilation equipment. |
| Regions Covered | North America, Latin America, Europe, East Asia, South Asia and Pacific, and Middle East and Africa |
| Countries Covered | United States, China, India, Germany, United Kingdom, Japan, South Korea, and 30+ countries |
| Key Companies Profiled | Greenheck, Ruskin, TROX, Systemair, Construction Specialties, Swegon, FlaktGroup, Air Master Equipments Emirates, and Holyoake |
| Forecast Period | 2026 to 2036 |
| Approach | Hybrid bottom-up and top-down methodology using intake exposure, louver type share, sales channel route, end-use risk profile, and supplier portfolio depth |
Source: Future Market Insights - analysis driven by proprietary forecasting models and primary research
Sand Trap Louver Market - Research Methodology
| Method | Approach |
|---|---|
| Primary Research | FMI analysts gathered input from manufacturers, service providers, technology developers, distributors, end users, sourcing teams, and subject-matter experts. Interviews examined purchasing decisions, product or service evaluation, adoption barriers, approval requirements, pricing considerations, and expectations for technical or commercial support. Respondents were also asked what evidence is required before a trial, pilot, or initial order develops into regular purchasing. |
| Desk Research | Desk research covered government statistics, regulatory publications, trade data, industry associations, technical literature, standards, company filings, product information, and official corporate announcements. Sources were reviewed for relevance, publication date, geographic coverage, and consistency with the defined market scope. Claims relating to performance, applications, approvals, capacity, investment, and commercial activity were retained only when supported by credible public evidence. |
| Market Sizing and Forecasting | The market model combined the baseline value with historical performance, segment structure, pricing and volume indicators, adoption levels, company participation, and country-level demand conditions. Forecast assumptions considered economic activity, investment trends, regulatory developments, technology adoption, purchasing cycles, supply availability, and barriers to wider market use. Segment and regional estimates were reconciled before the final market total was calculated. |
| Data Validation | Estimates were checked against multiple independent indicators, including public data, company activity, trade patterns, industry developments, and findings from primary interviews. Validation also tested whether products, services, applications, and company revenues fell within the defined market boundaries. Adjacent categories, unsupported claims, overlapping revenues, and activities without direct market relevance were excluded to reduce double counting and maintain consistency across segments and countries. |
Source: Future Market Insights (FMI) analysis, based on proprietary forecasting model and primary research
Sand Trap Louver Market by Segments
Sand Trap Louver Market segmented by Louver Type:
- Single-stage Sand Trap Louvers
- Multi-stage Sand Trap Louvers
- Drainable Louvers
- High-efficiency Intake Louvers
Sand Trap Louver Market segmented by Material:
- Aluminum
- Galvanized Steel
- Stainless Steel
- FRP / Other
Sand Trap Louver Market segmented by Application:
- HVAC Air Intakes
- Gas Turbine Inlets
- Industrial Ventilation
- Data Center / Telecom
Sand Trap Louver Market segmented by End Use:
- Oil and Gas
- Power Generation
- Commercial Buildings
- Industrial Facilities
Sand Trap Louver Market segmented by Sales Channel:
- Direct OEM
- HVAC Contractors
- Distributors
Sand Trap Louver Market by Region:
- North America
- United States
- Canada
- Europe
- Germany
- United Kingdom
- France
- Italy
- Spain
- Asia Pacific
- China
- Japan
- South Korea
- Taiwan
- Singapore
- Latin America
- Brazil
- Mexico
- Argentina
- Middle East & Africa
- GCC Countries
- South Africa
- Israel
Research Sources and Bibliography
- USA Census Bureau. (2026, June). Monthly Construction Spending, April 2026. USA Census Bureau.
- USA Environmental Protection Agency. (2026, March). Quality Assurance for Air Sensors. USA Environmental Protection Agency.
- Safe Work Australia. (2024, September). Stronger regulation of crystalline silica substances from 1 September 2024. Safe Work Australia.
- Press Information Bureau. (2026, January). Economic Survey 2025-26. Government of India.
- National Bureau of Statistics of China. (2026, January). Investment in Real Estate Development for 2025. National Bureau of Statistics of China.
- National Bureau of Statistics of China. (2026, February). Statistical Communiqué of the People's Republic of China on the 2025 National Economic and Social Development. National Bureau of Statistics of China.
- Federal Statistical Office. (2026, February). Building permits for building construction in Germany. Destatis.
- Office for National Statistics. (2026, June). Construction output in Great Britain: April 2026. Office for National Statistics.
- Ministry of Land, Infrastructure, Transport and Tourism. (2025, September). Fiscal Year 2024 Trends Concerning Land. MLIT.
- Ministry of Data and Statistics. (2026, May). Monthly Survey of Construction Orders Received and Value of Construction Completed. Ministry of Data and Statistics.
- Global Alliance for Buildings and Construction. (2026, May). Global Status Report for Buildings and Construction 2025-2026. UNEP.
- USA Energy Information Administration. (2026, March). USA natural gas production reached a new record in 2025. USA Energy Information Administration.
- Greenheck. (2026, June). Greenheck Energy Recovery Ventilators Deliver More Airflow with Direct Drive Fans. Greenheck.
- Greenheck. (2025, April). Louver Finishes and Colors. Greenheck.
- Ruskin. (2025, September). New Flange Mount Option For Model XP500 Aluminum Extreme Weather Louver. Ruskin.
- TROX. (2026, January). AWSL. TROX.
- Systemair. (2026, January). Louvres. Systemair.
- Air Master Equipments Emirates. (2026, January). High Efficiency Sand Trap Louver. Air Master Equipments Emirates.
- Swegon. (2025, September). Release AHU Design v. 4.7.0. Swegon.
This bibliography is provided for reader reference and uses primary government sources, standards bodies and official company sources.
This Report Answers
- What are the sand trap louver market values in 2026 and 2036?
- What CAGR is expected for the sand trap louver market from 2026 to 2036?
- Which louver type, material, application, end use and sales channel segments shape demand?
- Which dust exposure and intake protection pressures support purchase activity?
- How do country CAGRs differ across the United States, China, India and other profiled markets?
- Which companies compete across specification evidence, project channel access and service reach?
- How does FMI validate forecasts using a hybrid bottom-up and top-down methodology?
- What should sourcing teams address before wider account expansion or supplier commitment?
- How do documentation, coating records and test files affect vendor selection?
Frequently Asked Questions
What is driving growth in the Sand Trap Louver Market?
Growth is being driven by dust control and intake uptime requirements. Mechanical contractors need louvers that protect HVAC intakes, turbine inlets and industrial ventilation systems.
Who are the key players in the Sand Trap Louver Market?
Key players include Greenheck and Ruskin; TROX and Systemair; Construction Specialties and Swegon; Air Master Equipments Emirates. Competition centers on test evidence, order route and jobsite support.
What is a significant restraint in the Sand Trap Louver Market?
A significant restraint is poor site matching. Adoption slows when sand separation evidence, airflow loss and coating records do not match actual exposure conditions.
Why should executives track the Sand Trap Louver Market?
Executives should track the category due to outdoor-air protection affecting service cost and project approval in dusty locations. The category also connects HVAC reliability to coating quality, airflow planning and channel support across exposed intake projects.
What business problem does the Sand Trap Louver Market address?
The market addresses sand and large dust entry before incoming air reaches filters, coils or turbine inlet packages. The product reduces maintenance burden by placing separation at the building or equipment intake.
What should procurement leaders evaluate before selecting suppliers?
Procurement leaders should evaluate test files and coating records before reviewing airflow loss and local service ownership. Direct OEM routes also need drawing support and replacement access before larger account commitments across exposed intake projects.
What limits return on investment for purchasers?
Return on investment is limited by weak site matching, poor installation support and unclear maintenance ownership. A louver that captures sand but disrupts airflow planning creates new service risk.
How do suppliers build long-term account confidence?
Suppliers build account confidence by keeping submittals, drawings and coating data ready during tender review. Field support and replacement guidance help facility teams approve repeat orders after the first installation in dusty locations.
Preview the report firsthand - request a free sample
Get SampleGet the brochure for pricing and purchase details.
Get PDFTable of Content
- Key Takeaways
- Market Size and CAGR
- Top Growth Driver
- Fastest Growing Segment
- Leading Region
- Key Companies
- Emerging Opportunities
- Executive Summary
- Global Market Outlook
- Demand-side Trends
- Supply-side Trends
- Technology Roadmap Analysis
- Analysis and Recommendations
- Analyst Perspective (What is happening? Why now? What should investors know?)
- Key Questions Answered
- How large is the market?
- What is the CAGR?
- What are key trends?
- Which region dominates?
- Who are the leaders?
- Market Overview
- Market Coverage / Taxonomy
- Market Definition / Scope / Limitations
- Research Methodology
- Chapter Orientation
- Analytical Lens and Working Hypotheses
- Market Structure, Signals, and Trend Drivers
- Benchmarking and Cross-market Comparability
- Market Sizing, Forecasting, and Opportunity Mapping
- Research Design and Evidence Framework
- Desk Research Programme (Secondary Evidence)
- Expert Input and Fieldwork (Primary Evidence)
- Tooling, Models, and Reference Databases
- Data Engineering and Model Build
- Quality Assurance and Audit Trail
- Market Background
- Market Dynamics (Drivers, Restraints, Opportunity, Trends)
- Scenario Forecast (Optimistic, Likely, Conservative)
- Impact Analysis
- AI Impact
- Sustainability Impact
- Regulatory Impact
- Technology Impact
- Consumer / Buyer Analysis
- Purchase Drivers
- Adoption Barriers
- Buyer Journey
- Opportunity Map Analysis
- Product Life Cycle Analysis
- Supply Chain Analysis
- Investment Feasibility Matrix
- Value Chain Analysis
- PESTLE and Porter's Analysis
- Regulatory Landscape
- Regional Parent Market Outlook
- Production and Consumption Statistics
- Import and Export Statistics
- Global Market Analysis and Forecast, 2021 to 2036
- Historical Market Size Value (USD Mn) Analysis, 2021 to 2025
- Current and Future Market Size Value (USD Mn) Projections, 2026 to 2036
- Y-o-Y Growth Trend Analysis
- Absolute $ Opportunity Analysis
- Global Market Pricing Analysis, 2021 to 2036
- Global Market Analysis and Forecast, By Louver Type, 2021 to 2036
- Introduction / Key Findings
- Historical Market Size Value (USD Mn) Analysis By Louver Type, 2021 to 2025
- Current and Future Market Size Value (USD Mn) Analysis and Forecast By Louver Type, 2026 to 2036
- single-stage sand trap louvers
- multi-stage sand trap louvers
- drainable louvers
- high-efficiency intake louvers
- single-stage sand trap louvers
- Y-o-Y Growth Trend Analysis By Louver Type, 2021 to 2025
- Absolute $ Opportunity Analysis By Louver Type, 2026 to 2036
- Global Market Analysis and Forecast, By Material, 2021 to 2036
- Introduction / Key Findings
- Historical Market Size Value (USD Mn) Analysis By Material, 2021 to 2025
- Current and Future Market Size Value (USD Mn) Analysis and Forecast By Material, 2026 to 2036
- aluminum
- galvanized steel
- stainless steel
- FRP or other materials
- aluminum
- Y-o-Y Growth Trend Analysis By Material, 2021 to 2025
- Absolute $ Opportunity Analysis By Material, 2026 to 2036
- Global Market Analysis and Forecast, By Application, 2021 to 2036
- Introduction / Key Findings
- Historical Market Size Value (USD Mn) Analysis By Application, 2021 to 2025
- Current and Future Market Size Value (USD Mn) Analysis and Forecast By Application, 2026 to 2036
- HVAC air intakes
- gas turbine inlets
- industrial ventilation
- data center or telecom sites
- HVAC air intakes
- Y-o-Y Growth Trend Analysis By Application, 2021 to 2025
- Absolute $ Opportunity Analysis By Application, 2026 to 2036
- Global Market Analysis and Forecast, By End Use, 2021 to 2036
- Introduction / Key Findings
- Historical Market Size Value (USD Mn) Analysis By End Use, 2021 to 2025
- Current and Future Market Size Value (USD Mn) Analysis and Forecast By End Use, 2026 to 2036
- oil and gas
- power generation
- commercial buildings
- industrial facilities
- oil and gas
- Y-o-Y Growth Trend Analysis By End Use, 2021 to 2025
- Absolute $ Opportunity Analysis By End Use, 2026 to 2036
- Global Market Analysis and Forecast, By Sales Channel, 2021 to 2036
- Introduction / Key Findings
- Historical Market Size Value (USD Mn) Analysis By Sales Channel, 2021 to 2025
- Current and Future Market Size Value (USD Mn) Analysis and Forecast By Sales Channel, 2026 to 2036
- direct OEM
- HVAC contractors
- distributors
- direct OEM
- Y-o-Y Growth Trend Analysis By Sales Channel, 2021 to 2025
- Absolute $ Opportunity Analysis By Sales Channel, 2026 to 2036
- Global Market Analysis and Forecast, By Region, 2021 to 2036
- Introduction
- Historical Market Size Value (USD Mn) Analysis By Region, 2021 to 2025
- Current Market Size Value (USD Mn) Analysis and Forecast By Region, 2026 to 2036
- North America
- Latin America
- Western Europe
- Eastern Europe
- East Asia
- South Asia and Pacific
- Middle East & Africa
- Market Attractiveness Analysis By Region
- North America Market Analysis and Forecast, By Country, 2021 to 2036
- Historical Market Size Value (USD Mn) Trend Analysis By Market Taxonomy, 2021 to 2025
- Market Size Value (USD Mn) Forecast By Market Taxonomy, 2026 to 2036
- By Country
- USA
- Canada
- By Louver Type
- By Material
- By Application
- By End Use
- By Sales Channel
- By Country
- Market Attractiveness Analysis
- By Country
- By Louver Type
- By Material
- By Application
- By End Use
- By Sales Channel
- Key Takeaways
- Latin America Market Analysis and Forecast, By Country
- Historical Market Size Value (USD Mn) Trend Analysis By Market Taxonomy, 2021 to 2025
- Market Size Value (USD Mn) Forecast By Market Taxonomy, 2026 to 2036
- By Country
- Brazil
- Mexico
- Chile
- Rest of Latin America
- By Louver Type
- By Material
- By Application
- By End Use
- By Sales Channel
- By Country
- Market Attractiveness Analysis
- By Country
- By Louver Type
- By Material
- By Application
- By End Use
- By Sales Channel
- Key Takeaways
- Western Europe Market Analysis and Forecast, By Country
- Historical Market Size Value (USD Mn) Trend Analysis By Market Taxonomy, 2021 to 2025
- Market Size Value (USD Mn) Forecast By Market Taxonomy, 2026 to 2036
- By Country
- Germany
- UK
- Italy
- Spain
- France
- Nordic
- BENELUX
- Rest of Western Europe
- By Louver Type
- By Material
- By Application
- By End Use
- By Sales Channel
- By Country
- Market Attractiveness Analysis
- By Country
- By Louver Type
- By Material
- By Application
- By End Use
- By Sales Channel
- Key Takeaways
- Eastern Europe Market Analysis and Forecast, By Country
- Historical Market Size Value (USD Mn) Trend Analysis By Market Taxonomy, 2021 to 2025
- Market Size Value (USD Mn) Forecast By Market Taxonomy, 2026 to 2036
- By Country
- Russia
- Poland
- Hungary
- Balkan & Baltic
- Rest of Eastern Europe
- By Louver Type
- By Material
- By Application
- By End Use
- By Sales Channel
- By Country
- Market Attractiveness Analysis
- By Country
- By Louver Type
- By Material
- By Application
- By End Use
- By Sales Channel
- Key Takeaways
- East Asia Market Analysis and Forecast, By Country
- Historical Market Size Value (USD Mn) Trend Analysis By Market Taxonomy, 2021 to 2025
- Market Size Value (USD Mn) Forecast By Market Taxonomy, 2026 to 2036
- By Country
- China
- Japan
- South Korea
- By Louver Type
- By Material
- By Application
- By End Use
- By Sales Channel
- By Country
- Market Attractiveness Analysis
- By Country
- By Louver Type
- By Material
- By Application
- By End Use
- By Sales Channel
- Key Takeaways
- South Asia and Pacific Market Analysis and Forecast, By Country
- Historical Market Size Value (USD Mn) Trend Analysis By Market Taxonomy, 2021 to 2025
- Market Size Value (USD Mn) Forecast By Market Taxonomy, 2026 to 2036
- By Country
- India
- ASEAN
- Australia & New Zealand
- Rest of South Asia and Pacific
- By Louver Type
- By Material
- By Application
- By End Use
- By Sales Channel
- By Country
- Market Attractiveness Analysis
- By Country
- By Louver Type
- By Material
- By Application
- By End Use
- By Sales Channel
- Key Takeaways
- Middle East & Africa Market Analysis and Forecast, By Country
- Historical Market Size Value (USD Mn) Trend Analysis By Market Taxonomy, 2021 to 2025
- Market Size Value (USD Mn) Forecast By Market Taxonomy, 2026 to 2036
- By Country
- Kingdom of Saudi Arabia
- Other GCC Countries
- Türkiye
- South Africa
- Other African Union
- Rest of Middle East & Africa
- By Louver Type
- By Material
- By Application
- By End Use
- By Sales Channel
- By Country
- Market Attractiveness Analysis
- By Country
- By Louver Type
- By Material
- By Application
- By End Use
- By Sales Channel
- Key Takeaways
- Key Countries Market Analysis
- USA
- Pricing Analysis
- Market Share Analysis, 2025
- By Louver Type
- By Material
- By Application
- By End Use
- By Sales Channel
- Canada
- Pricing Analysis
- Market Share Analysis, 2025
- By Louver Type
- By Material
- By Application
- By End Use
- By Sales Channel
- Mexico
- Pricing Analysis
- Market Share Analysis, 2025
- By Louver Type
- By Material
- By Application
- By End Use
- By Sales Channel
- Brazil
- Pricing Analysis
- Market Share Analysis, 2025
- By Louver Type
- By Material
- By Application
- By End Use
- By Sales Channel
- Chile
- Pricing Analysis
- Market Share Analysis, 2025
- By Louver Type
- By Material
- By Application
- By End Use
- By Sales Channel
- Germany
- Pricing Analysis
- Market Share Analysis, 2025
- By Louver Type
- By Material
- By Application
- By End Use
- By Sales Channel
- UK
- Pricing Analysis
- Market Share Analysis, 2025
- By Louver Type
- By Material
- By Application
- By End Use
- By Sales Channel
- Italy
- Pricing Analysis
- Market Share Analysis, 2025
- By Louver Type
- By Material
- By Application
- By End Use
- By Sales Channel
- Spain
- Pricing Analysis
- Market Share Analysis, 2025
- By Louver Type
- By Material
- By Application
- By End Use
- By Sales Channel
- France
- Pricing Analysis
- Market Share Analysis, 2025
- By Louver Type
- By Material
- By Application
- By End Use
- By Sales Channel
- India
- Pricing Analysis
- Market Share Analysis, 2025
- By Louver Type
- By Material
- By Application
- By End Use
- By Sales Channel
- ASEAN
- Pricing Analysis
- Market Share Analysis, 2025
- By Louver Type
- By Material
- By Application
- By End Use
- By Sales Channel
- Australia & New Zealand
- Pricing Analysis
- Market Share Analysis, 2025
- By Louver Type
- By Material
- By Application
- By End Use
- By Sales Channel
- China
- Pricing Analysis
- Market Share Analysis, 2025
- By Louver Type
- By Material
- By Application
- By End Use
- By Sales Channel
- Japan
- Pricing Analysis
- Market Share Analysis, 2025
- By Louver Type
- By Material
- By Application
- By End Use
- By Sales Channel
- South Korea
- Pricing Analysis
- Market Share Analysis, 2025
- By Louver Type
- By Material
- By Application
- By End Use
- By Sales Channel
- Russia
- Pricing Analysis
- Market Share Analysis, 2025
- By Louver Type
- By Material
- By Application
- By End Use
- By Sales Channel
- Poland
- Pricing Analysis
- Market Share Analysis, 2025
- By Louver Type
- By Material
- By Application
- By End Use
- By Sales Channel
- Hungary
- Pricing Analysis
- Market Share Analysis, 2025
- By Louver Type
- By Material
- By Application
- By End Use
- By Sales Channel
- Kingdom of Saudi Arabia
- Pricing Analysis
- Market Share Analysis, 2025
- By Louver Type
- By Material
- By Application
- By End Use
- By Sales Channel
- Türkiye
- Pricing Analysis
- Market Share Analysis, 2025
- By Louver Type
- By Material
- By Application
- By End Use
- By Sales Channel
- South Africa
- Pricing Analysis
- Market Share Analysis, 2025
- By Louver Type
- By Material
- By Application
- By End Use
- By Sales Channel
- USA
- Market Structure Analysis
- Competition Dashboard
- Competition Benchmarking
- Market Share Analysis of Top Players
- By Regional
- By Louver Type
- By Material
- By Application
- By End Use
- By Sales Channel
- Emerging Startups
- Innovation Benchmarking
- Competition Analysis
- Competition Deep Dive
- Greenheck
- Overview
- Product Portfolio
- Profitability by Market Segments
- Sales Footprint
- Strategy Overview
- Marketing Strategy
- Product Strategy
- Channel Strategy
- Ruskin
- TROX
- Systemair
- Construction Specialties
- Swegon
- FlaktGroup
- Air Master Equipments Emirates
- Holyoake
- Greenheck
- Case Studies
- Success Stories
- Recent Developments
- Competition Deep Dive
- Assumptions & Acronyms Used


