Scapula Reconstruction Market Size and Share Forecast Outlook 2025 to 2035

The global scapula reconstruction market is projected to grow from USD 103.8 million in 2025 to USD 152.2 million by 2035, representing an absolute value addition of USD 48.3 million. This indicates a total growth of approximately 50.4% over the decade and reflects a compound annual growth rate (CAGR) of 3.9% during the forecast period. The market is expected to expand by 1.5X between 2025 and 2035, supported by material advancements and precision surgical technologies.
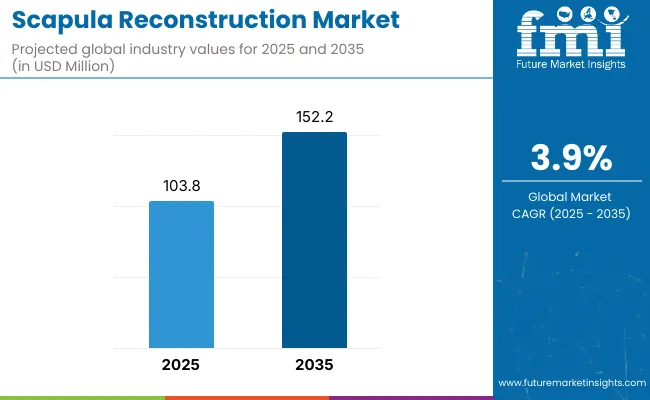
Scapula Reconstruction Market

Metric Value
Industry Size (2025E) USD 103.8 million
Industry Size (2035F) USD 152.2 million
CAGR (2025 to 2035) 3.9%

From 2025 to 2030, the market is projected to rise from USD 103.8 million to USD 128.2 million, adding approximately USD 24.4 million in value. Growth during this phase will be propelled by the wider adoption of 3D-printed scapular implants, rising incidences of bone tumors and traumatic injuries, and increased integration of patient-specific anatomical modelling into surgical planning.

During the 2030 to 2035 period, the market is forecast to expand further from USD 128.2 million to USD 152.2 million. This phase will benefit from improvements in bio-compatible polymers, expansion of orthopedic robotic-assisted surgeries, and a rise in reimbursement coverage for complex skeletal reconstructions across developed healthcare markets.

Between 2020 and 2025, the global scapula reconstruction market expanded from USD 93.1 million to USD 103.8 million, recording a total absolute increase of USD 10.7 million. This reflects a cumulative growth of 11.5% over five years, translating into a moderate CAGR of 2.2% during the period. The demand during this phase was largely shaped by rising awareness around limb-sparing surgeries and the increasing role of orthopedic oncology.

Medical centres specializing in musculoskeletal cancer began integrating modular scapula prosthetics into complex surgical workflows, especially in North America and Europe. Use of patient-specific implants saw early traction, particularly for tumors of the shoulder girdle requiring partial or total scapula resections. The adoption of 3D-printing technologies started gaining ground with initial FDA approvals and CE-marked devices supporting better anatomical matching and operative outcomes.

Growth was also supported by cross-disciplinary innovation involving orthopedic surgeons, biomechanical engineers, and radiologists. The use of CT-based modelling and additive manufacturing helped reduce surgery time and improved implant compatibility, laying the groundwork for broader adoption in the forecast period.

What is Driving the Market?

The global scapula reconstruction market is being driven by advancements in surgical oncology, precision implant development, and the integration of digital modelling in preoperative planning. As bone tumor resection rates increase and surgical outcomes become more data-driven, manufacturers are intensifying efforts to deliver scapular prosthetics that are lightweight, anatomically customized, and bio-compatible. The adoption of additive manufacturing and growing investments in personalized orthopaedics are reinforcing product-level differentiation across key markets.

Surge in Complex Shoulder Girdle Tumor Cases Demands Customized Solutions

An increase in diagnoses of chondrosarcoma, Ewing’s sarcoma, and metastatic shoulder girdle lesions is creating demand for reliable reconstructive options. Scapula resections, which were traditionally associated with poor functional outcomes, are now being addressed with advanced prosthetic systems. This is fueling clinical preference for modular or segmental scapular implants that can be tailored to the patient’s residual anatomy.

Digital Imaging and 3D Printing Enhance Implant Precision

Preoperative imaging advancements such as CT/MRI fusion modelling and virtual surgical planning have enabled highly personalized designs in scapula reconstruction. The rising incorporation of 3D-printed implants-often developed using titanium and PEEK-has improved surgical alignment and post-operative range of motion. These developments are fostering better integration between surgical oncology and reconstructive orthopaedics.

Rise in Limb-Sparing Surgeries Supports Market Expansion

A strong clinical shift toward limb-sparing surgeries over amputations is supporting the deployment of scapular endoprostheses, especially among pediatric and geriatric patients. Hospitals are increasingly seeking implant options that provide both structural restoration and functional mobility. This trend is particularly relevant in tertiary cancer centers across the USA, Germany, and Japan.

Cross-Disciplinary Collaborations Are Accelerating Product Approvals

Collaborative efforts between surgeons, medical device designers, and biomechanical labs have reduced product development timelines and enabled more precise surgical tools. Regulatory bodies such as the FDA and EMA are increasingly evaluating patient-specific implants for orphan indications, allowing faster market entry and clinical experimentation, especially in rare skeletal reconstructions.

Segmentation Overview

The scapula reconstruction market is segmented based on type of plates, procedure type, and end-user. Plate types include lateral border plates, medial border plates, glenoid plates, acromion plates, and clavicle-to-scapula fixation plates, reflecting the anatomical fixation needs across scapular regions. Procedures are categorized into partial scapulectomy with reconstruction, total scapulectomy with reconstruction, resection with humeral suspension, and reconstructive fixation using plate-based techniques. End-user segmentation comprises hospitals, ambulatory surgical centers (ASCs), orthopedic and oncologic specialty clinics, and academic or research institutes, covering the full range of clinical settings involved in scapular repair and reconstruction.
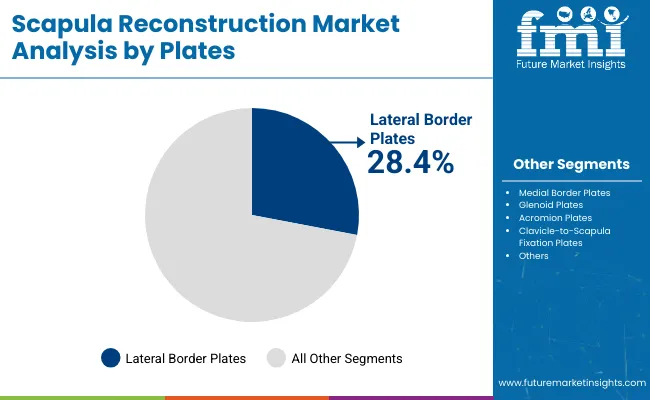
Lateral Border Plates to Remain Widely Adopted in Scapula Fixation Procedures

Scapula Reconstruction Market By Plates

By Type of Plates 2025
Lateral Border Plates 28.4%
Medial Border Plates 12.3%
Glenoid Plates 20.1%
Acromion Plates 21.8%
Clavicle-to-Scapula Fixation Plates 17.4%

Lateral border plates are estimated to hold the largest share of 28.4% in 2025, driven by their critical role in stabilizing the scapula’s outer edge during complex reconstructions. Their biomechanical advantage in fracture alignment and ease of contouring makes them suitable for a wide range of scapular injuries and oncologic resections. The growing number of trauma cases and advancements in pre-contoured implants are supporting their continued clinical preference.
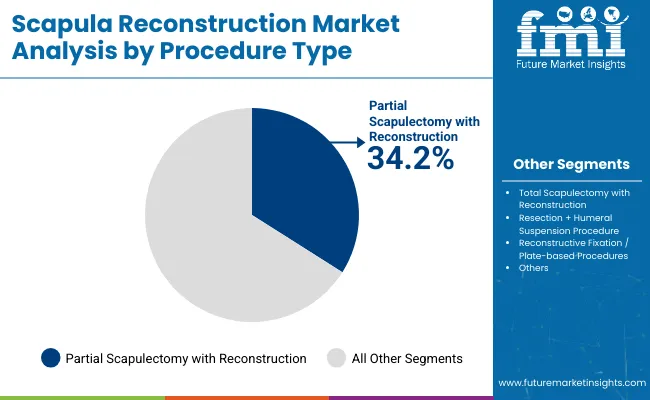
Partial Scapulectomy with Reconstruction Leads Among Surgical Procedures

Scapula Reconstruction Market By Procedure

By Procedure type 2025
Partial Scapulectomy with Reconstruction 34.2%
Total Scapulectomy with Reconstruction 22.5%
Resection + Humeral Suspension Procedure 10.8%
Reconstructive Fixation / Plate-based Procedures 32.5%

Partial scapulectomy with reconstruction is projected to account for 34.2% of procedures in 2025. This dominance is attributed to the increasing incidence of localized scapular tumors and segmental fractures that do not require complete resection. Surgeons prefer this method due to its relatively lower complexity, faster recovery timelines, and growing access to modular and 3D-printed implants designed for partial scapula replacement.
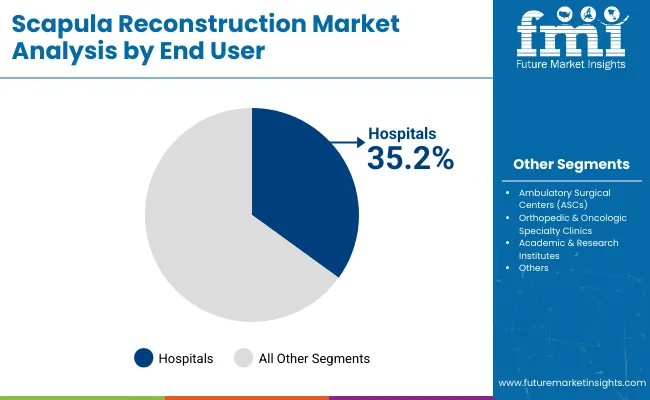
Hospitals Represent the Primary End-Use Setting for Scapula Reconstructions

Scapula Reconstruction Market By End User

By End User 2025
Hospitals 35.2%
Ambulatory Surgical Centers (ASCs) 28.5%
Orthopedic & Oncologic Specialty Clinics 21.3%
Academic & Research Institutes 14.9%

Hospitals are expected to constitute 35.2% of the end-user base in 2025, reflecting their infrastructure capabilities for complex orthopedic and oncologic surgeries. The availability of multidisciplinary surgical teams, post-operative care, and imaging technologies such as 3D CT scans and MRIs reinforces the hospital segment’s role. Rising trauma admissions and bone tumor resections further support the hospital-based adoption of scapula reconstruction implants.

Key Trends Shaping the Market

The scapula reconstruction market is advancing steadily due to the combined influence of surgical innovation, enhanced imaging techniques, and increasing acceptance of limb-salvage procedures. While adoption remains largely confined to specialized orthopedic and oncology centers, global interest in anatomical reconstruction solutions is growing. These drivers are shaping both product development and procurement behaviors across institutions.

Growing Adoption of Limb-Salvage Surgeries Over Amputation

The medical community is showing growing preference for limb-sparing techniques in managing shoulder girdle tumors and traumatic scapular injuries. As surgical oncology improves, clinicians are avoiding amputations and favoring partial or total scapular reconstructions. This has created consistent demand for prostheses that preserve joint mobility while ensuring oncological safety. Advancements in surgical margin control and resection planning are reinforcing this trend, especially in the USA, Japan, and Western Europe.

Integration of 3D-Printed Custom Implants

The availability of patient-specific 3D-printed scapula implants is driving the market’s growth. These implants, often produced using titanium or composite polymers, allow precise matching with the patient’s bone geometry. Hospitals and surgical centers are increasingly adopting virtual planning software and additive manufacturing platforms to pre-design implants that can be inserted with minimal intraoperative adjustment. This capability is becoming a differentiating factor among top suppliers.

Rise in Multi-Disciplinary Care Pathways

Reconstructive orthopedic surgeries involving the scapula now require coordinated planning across oncologists, radiologists, and orthopedic specialists. This shift has led to the development of hybrid care pathways that combine oncological tumor clearance with biomechanically optimized reconstruction. Vendors are responding by offering integrated solutions that include implants, planning tools, and post-operative rehabilitation kits.

Shift Toward Modular and Lightweight Prosthetic Designs

There is a growing trend toward modular implant systems that allow surgeons to reconstruct partial or total scapular sections with improved flexibility. These systems offer better handling during surgery and post-operative mobility. Additionally, manufacturers are focusing on lightweight materials to minimize shoulder fatigue and aid in muscle.

Europe Market Split by Country

The scapula reconstruction market in Europe is projected to grow from USD 29.1 million in 2025 to USD 38.4 million by 2035, registering a CAGR of 2.8%. Germany will retain its dominant share due to its concentration of orthopedic trauma centers and clinical expertise in limb salvage surgeries. The UK and France are expected to maintain stable growth, driven by continued adoption of 3D-printed and patient-specific scapular implants. Countries like Italy and Spain show a slower pace of transition but benefit from expanding surgical robotics programs. Rest of Western Europe, including smaller economies and Nordic countries, will witness a gradual rise in share due to improved access and public healthcare investments targeting musculoskeletal rehabilitation services.
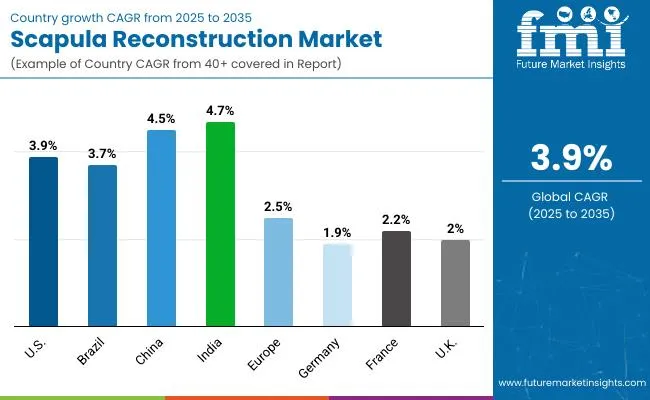
Key Countries Growth Outlook

Scapula Reconstruction Market Country

Countries CAGR
USA 3.9%
Brazil 3.7%
China 4.5%
India 4.7%
Europe 2.5%
Germany 1.9%
France 2.2%
UK 2.0%

The Asia Pacific region is emerging as the fastest-growing market for scapula reconstruction, projected to expand at a CAGR of 4.7% in India and 4.5% in China between 2025 and 2035. In India, growth is driven by increasing investments in specialized orthopediccenters, rising trauma-related injuries, and adoption of advanced reconstructive implants in Tier 1 and Tier 2 cities. Meanwhile, China’s growth is supported by large-scale healthcare infrastructure upgrades under the Healthy China 2030 initiative, coupled with rising procedural volumes for oncology-driven reconstructions. The region benefits from government-backed reimbursement reforms and the rapid availability of custom 3D-printed implants.

Europe is expected to grow steadily at a CAGR of 2.5% through 2035. Germany with 1.9% CAGRleads in procedure volumes but sees slower growth due to market saturation and mature infrastructure. France is expected to grow at 2.2% CAGR and is benefiting from targeted funding for oncology surgeries under national health reforms, while the UK is driving adoption through NHS-led pilot programs focusing on bone cancer treatment and reconstructive procedures and holding a 2.0% CAGR.

North America remains a mature yet innovation-driven market, with the USA projected to grow at a CAGR of 3.9% through 2035. Growth is fueled by the adoption of patient-specific implants, integration of AI-driven preoperative planning, and availability of advanced biomaterials for complex scapular reconstructions. Federal funding for trauma care and cancer treatment programs is also boosting procedural adoption.

Steady Progress in the USA Through Specialized Shoulder Centers

The United States is anticipated to grow at a CAGR of 3.9%, with strong demand for scapula reconstruction procedures in specialized orthopedic and trauma centers. The presence of highly trained reconstructive surgeons and robust referral networks ensures consistent procedure volumes. Personalized surgical planning, supported by advanced imaging, digital modeling, and the availability of custom implants, is further improving patient outcomes. Additionally, favorable reimbursement structures and broader insurance coverage are encouraging hospitals and patients to adopt advanced scapula reconstruction techniques. Growing patient awareness and a preference for limb-salvage surgery following trauma are also reinforcing market expansion.

  • Established base of orthopedic reconstructive surgeons
  • High patient awareness and preference for post-trauma surgery
  • Growth in use of patient-specific implants
  • Reimbursement backing for advanced shoulder surgeries

Robust Expansion in India Driven by Reconstructive Surgical Access

India is set to lead global growth in the scapula reconstruction market with a CAGR of 4.7% between 2025 and 2035. Rising incidence of trauma-related scapular injuries due to urban traffic accidents and industrial mishaps is fostering demand. Alongside, private multi-specialty hospitals and medical tourism hubs are enhancing surgical volumes, particularly in metropolitan areas such as Delhi, Mumbai, and Bangalore. The country is also benefiting from the availability of specialized orthopedic trauma centers and the increasing presence of skilled reconstructive surgeons. In addition, government-backed health coverage for complex surgeries is improving accessibility for middle-income patients, ensuring broader treatment adoption.

  • Orthopedic trauma centers expanding in Tier 1 and Tier 2 cities
  • Medical tourism playing a role in complex shoulder surgeries
  • Increased access to 3D-printed bone implants
  • Public schemes improving affordability for reconstructive care

Growth and Expansion Outlook for Scapula Reconstruction Market in the United Kingdom

The Scapula Reconstruction Market in the United Kingdom is projected to grow at a CAGR of 2.0% through 2035, supported by rising investments in oncology-driven reconstructive surgeries and trauma care advancements. NHS England’s elective recovery funding and targeted programs under the NHS Long-Term Plan are improving access to advanced orthopedic implants and personalized reconstruction solutions. Growing collaborations between hospitals and manufacturers are enhancing patient-specific 3D implant adoption, particularly for bone tumor resections and complex fractures. Demand is also being fueled by central procurement policies that focus on standardized, cost-efficient solutions to address rising surgical site complication risks.

  • NHS Trust hospitals are deploying advanced scapula implants integrated into multidisciplinary cancer care pathways.
  • Specialist trauma and oncology centers are investing in 3D-printed scapular reconstruction systems for high-complexity cases.
  • Clinical commissioning groups (CCGs) are prioritizing vendors with sustainability-focused and cost-optimized implant portfolios.

In-depth Analysis of Scapula Reconstruction Market in Germany

Europe Countries 2025
Germany 24.4%
France 14.5%
Italy 11.0%
BENELUX 7.0%
Nordic Countries 5.4%
Spain 9.3%
Rest of Western Europe 28.4%
Germany 24.4%
Europe Countries 2035
Germany 21.4%
France 14.3%
Italy 11.9%
BENELUX 8.2%
Nordic Countries 6.4%
Spain 9.7%
Rest of Western Europe 28.0%
Germany 21.4%

The Scapula Reconstruction Market in Germany is forecast to grow at a CAGR of 1.9% through 2035, driven by high procedural volumes but tempered by market maturity. Federal investments under the Krankenhauszukunftsgesetz (Hospital Future Act) are improving oncology and trauma care infrastructure, enabling greater adoption of customized scapular reconstruction plates and implants. Germany’s well-established reimbursement framework ensures consistent procedural demand, yet growth is slower due to saturated hospital infrastructure and early-stage adoption of robotic-assisted reconstructive systems. Increasing collaborations between orthopedic centers and engineering firms are accelerating deployment of patient-specific 3D-printed implants for sarcoma resections and trauma-related reconstruction.

  • University hospitals and academic oncology centers are pioneering hybrid workflows combining CAD-based planning and surgical navigation.
  • Regional orthopedic clinics are adopting modular scapular plating systems to streamline low-volume trauma procedures.
  • German med-tech firms are co-developing custom implant solutions aligned with DIN EN ISO standards for surgical precision.
  • Europe Scapula Reconstruction Market Value Analysis By Country

China Advancing with Medical Device Innovation and Hospital Upgrades

China is projected to grow at a CAGR of 4.5% through 2035, supported by increased investment in orthopedic trauma and reconstructive technologies. Leading hospitals are adopting advanced prosthetic solutions, integrating pre-surgical planning platforms that leverage AI and digital imaging. Domestic medical device players are also entering the space with cost-effective scapula implants and guided surgical tools, contributing to affordability and higher adoption rates. Furthermore, continuous upgrades in hospital infrastructure and expansion of trauma centers across provinces are improving access to specialized care. The national government’s emphasis on promoting indigenous medical devices is accelerating innovation and ensuring a stronger local supply chain.

  • High trauma cases from traffic and industrial injuries
  • Tiered healthcare network deploying digital imaging tools
  • Local manufacturers introducing affordable solutions
  • National plans promoting indigenous medical devices

Growth Outlook of Scapula Reconstruction Market in Japan

The Scapula Reconstruction Market in Japan is projected to grow from USD 4.0 million in 2025, expanding at a CAGR of 3.0%. Demand is led by fixation plates, with lateral border plates projected to dominate at 27.6% share in 2025, driven by a high incidence of vehicular injuries and sports-related scapular fractures. Acromion plates, accounting for 21.2%, are increasingly adopted in surgeries focused on restoring shoulder elevation and mobility post-trauma. Clavicle-to-scapula fixation plates represent 19.9% share, reflecting the need for cross-bone stabilization in complex trauma cases. Glenoid plates (19.5%) are mainly applied in joint preservation procedures among elderly patients, while medial border plates (11.9%) remain limited to rare realignment cases.

  • Market in Japan holds 3.9% revenue share of the global market in 2025
  • Specialized trauma and sports medicine clinics are customizing plate-based reconstruction techniques, focusing on mobility restoration in post-fracture cases.
  • Hospital procurement teams are increasingly bundling scapula plates with broader orthopedic implant kits, aligning with Japan’s strict surgical quality and safety standards.

Opportunity Analysis of South Korea in Scapula Reconstruction Market

The Scapula Reconstruction Market in South Korea is estimated at USD 2.9 million in 2025, growing at a CAGR of 5.1%. The market is driven by a preference for reconstructive fixation and plate-based procedures, which hold the highest share at 33.5% in 2025. Partial scapulectomy with reconstruction follows closely at 33.2%, reflecting a clinical emphasis on limb-sparing surgical approaches. Total scapulectomy with reconstruction accounts for 21.8%, usually applied in extensive cancer resections or severely comminuted fractures. Meanwhile, resection with humeral suspension, though niche, contributes 10.5%, primarily in palliative or non-reconstructable trauma cases.

  • South Korea’s market estimated at USD 2.9 million in 2025, reaching USD 4.8 million by 2035.
  • South Korea hold 2.8% of the Overall market in 2025
  • Orthopedic oncology centers are adopting partial scapulectomy with reconstruction, reflecting strong clinical emphasis on limb-sparing surgeries.
  • Local distributors and hospital engineering firms are bundling scapula plates into CSSD retrofits and implant portfolios, ensuring compliance with Korean sterilization and regulatory frameworks.

Competition Landscape

The Scapula Reconstruction Market is moderately consolidated, with global orthopedic implant leaders, trauma-focused device manufacturers, and specialized reconstructive surgery firms competing across fixation plates, scapulectomy reconstruction systems, and plate-based stabilization solutions. DePuy Synthes holds the largest share, leveraging its extensive trauma and orthopedic implant portfolio, with strong distribution in both developed and emerging surgical markets. The company continues to emphasize advanced plate systems, surgeon training programs, and integration with digital surgical planning platforms.

Zimmer Biomet, Exactech, and LIMACORPORATE SPA maintain strong positions through diversified orthopedic portfolios that extend into oncology-driven reconstructions, trauma fixation, and joint-preservation solutions. Their strategies focus on procedural innovation, surgeon engagement, and expanding collaborations with cancer centers and sports medicine clinics. Zimmer Biomet, in particular, is advancing plate technologies designed for complex trauma and elderly fracture stabilization.

Acumed, TST Orthopedics, and Implantcast GmbH represent specialized players catering to complex scapular trauma and tumor-related reconstructions. Acumed is recognized for its trauma fixation expertise, while Implantcast leads in oncology-driven custom prosthetics and modular plate systems. LIMACORPORATE and Exactech are increasingly adopting 3D printing and custom reconstruction workflows, targeting limb-sparing surgeries.

Other regional players and contract manufacturers are entering the space with cost-effective plates and reconstruction kits tailored to local hospital needs. These companies often compete on affordability, rapid availability, and bundled offerings through hospital procurement networks.

As the market evolves, competitive differentiation is shifting from standard plate fixation toward customized 3D-printed implants, oncology-driven reconstructions, and integration with surgical navigation tools. Players that align innovation with surgeon trust, clinical outcomes, and regulatory compliance are expected to lead market growth through 2035.

Key Developments

  • In July 2025, Exactech received FDA 510(k) clearance for its Equinoxe® Scapula Reconstruction System, the first trauma solution designed for acromial and scapular fractures after reverse shoulder arthroplasty (rTSA). The system offers anatomically contoured single and dual plating options with integral hooks, addressing a long-standing unmet surgical need.
  • In February 2024, Exactech partnered with Statera Medical to co-develop the world’s first smart reverse shoulder implant. Using Statera’s Goldilocks technology, the implant provides real-time soft tissue tension data, helping surgeons optimize implant size and offset, improving joint stability, mobility, and reducing risks like scapular stress fractures.

Scope of the Report

Item Value
Market Value USD 103.8 million
Types of Plate Lateral Border Plates, Medial Border Plates, Glenoid Plates, Acromion Plates, Clavicle-to-Scapula Fixation Plates
Procedure type Partial Scapulectomy with Reconstruction, Total Scapulectomy with Reconstruction, Resection + Humeral Suspension Procedure, Reconstructive Fixation / Plate-based Procedures
End User Hospitals, Ambulatory Surgical Centers (ASCs), Orthopedic & Oncologic Specialty Clinics, Academic & Research Institutes
Regions Covered North America, Latin America, Western & Eastern Europe, East Asia, South Asia & Pacific, Middle East & Africa
Countries Covered USA, Brazil, China, India, Germany, France, UK etc.
Key Companies Profiled Acumed, DePuy Synthes, Exactech, Zimmer Biomet, Implantcast GmbH, LIMACORPORATE SPA, TST Orthopedics, Others
Additional Attributes Dollar sales by plate ty pe, procedure type, and regions, Adoption trends of plate-based scapula reconstruction systems, Rising demand in oncology-driven tumor resect ions and limb-sparing surgeries, Growing demand across trauma centers, orthopedic specialty clinics, and academic research hospitals

Key Segments

By Type of Plates:

  • Lateral Border Plates
  • Medial Border Plates
  • Glenoid Plates
  • Acromion Plates
  • Clavicle-to-Scapula Fixation Plates

By Procedure type:

  • Partial Scapulectomy with Reconstruction
  • Total Scapulectomy with Reconstruction
  • Resection + Humeral Suspension Procedure
  • Reconstructive Fixation / Plate-based Procedures

By End User:

  • Hospitals
  • Ambulatory Surgical Centers (ASCs)
  • Orthopedic & Oncologic Specialty Clinics
  • Academic & Research Institutes

By Region:

  • North America
  • Latin America
  • East Asia
  • South Asia & Pacific
  • Western Europe
  • Eastern Europe
  • Middle East & Africa

Table of Content

  1. Executive Summary
    • Global Market Outlook
    • Demand-side Trends
    • Supply-side Trends
    • Technology Roadmap Analysis
    • Analysis and Recommendations
  2. Market Overview
    • Market Coverage / Taxonomy
    • Market Definition / Scope / Limitations
  3. Market Background
    • Market Dynamics
      • Drivers
      • Restraints
      • Opportunity
      • Trends
    • Scenario Forecast
      • Demand in Optimistic Scenario
      • Demand in Likely Scenario
      • Demand in Conservative Scenario
    • Opportunity Map Analysis
    • Product Life Cycle Analysis
    • Supply Chain Analysis
      • Supply Side Participants and their Roles
        • Producers
        • Mid-Level Participants (Traders/ Agents/ Brokers)
        • Wholesalers and Distributors
      • Value Added and Value Created at Node in the Supply Chain
      • List of Raw Material Suppliers
      • List of Existing and Potential Buyer’s
    • Investment Feasibility Matrix
    • Value Chain Analysis
      • Profit Margin Analysis
      • Wholesalers and Distributors
      • Retailers
    • PESTLE and Porter’s Analysis
    • Regulatory Landscape
      • By Key Regions
      • By Key Countries
    • Regional Parent Market Outlook
    • Production and Consumption Statistics
    • Import and Export Statistics
  4. Global Market Analysis 2020 to 2024 and Forecast, 2025 to 2035
    • Historical Market Size Value (USD Million) & Volume (Units) Analysis, 2020 to 2024
    • Current and Future Market Size Value (USD Million) & Volume (Units) Projections, 2025 to 2035
      • Y-o-Y Growth Trend Analysis
      • Absolute $ Opportunity Analysis
  5. Global Market Analysis 2020 to 2024 and Forecast 2025 to 2035, By Type of Plates
    • Introduction / Key Findings
    • Historical Market Size Value (USD Million) & Volume (Units) Analysis By Type of Plates, 2020 to 2024
    • Current and Future Market Size Value (USD Million) & Volume (Units) Analysis and Forecast By Type of Plates, 2025 to 2035
      • Lateral Border Plates
      • Medial Border Plates
      • Glenoid Plates
      • Acromion Plates
      • Clavicle-to-Scapula Fixation Plates
    • Y-o-Y Growth Trend Analysis By Type of Plates, 2020 to 2024
    • Absolute $ Opportunity Analysis By Type of Plates, 2025 to 2035
  6. Global Market Analysis 2020 to 2024 and Forecast 2025 to 2035, By Procedure type
    • Introduction / Key Findings
    • Historical Market Size Value (USD Million) & Volume (Units) Analysis By Procedure type, 2020 to 2024
    • Current and Future Market Size Value (USD Million) & Volume (Units) Analysis and Forecast By Procedure type, 2025 to 2035
      • Partial Scapulectomy with Reconstruction
      • Total Scapulectomy with Reconstruction
      • Resection + Humeral Suspension Procedure
      • Reconstructive Fixation / Plate-based Procedures
    • Y-o-Y Growth Trend Analysis By Procedure type, 2020 to 2024
    • Absolute $ Opportunity Analysis By Procedure type, 2025 to 2035
  7. Global Market Analysis 2020 to 2024 and Forecast 2025 to 2035, By End User
    • Introduction / Key Findings
    • Historical Market Size Value (USD Million) & Volume (Units) Analysis By End User, 2020 to 2024
    • Current and Future Market Size Value (USD Million) & Volume (Units) Analysis and Forecast By End User, 2025 to 2035
      • Hospitals
      • Ambulatory Surgical Centers (ASCs)
      • Orthopedic & Oncologic Specialty Clinics
      • Academic & Research Institutes
    • Y-o-Y Growth Trend Analysis By End User, 2020 to 2024
    • Absolute $ Opportunity Analysis By End User, 2025 to 2035
  8. Global Market Analysis 2020 to 2024 and Forecast 2025 to 2035, By Region
    • Introduction
    • Historical Market Size Value (USD Million) & Volume (Units) Analysis By Region, 2020 to 2024
    • Current Market Size Value (USD Million) & Volume (Units) Analysis and Forecast By Region, 2025 to 2035
      • North America
      • Latin America
      • East Asia
      • South Asia & Pacific
      • Western Europe
      • Eastern Europe
      • Middle East & Africa
    • Market Attractiveness Analysis By Region
  9. North America Market Analysis 2020 to 2024 and Forecast 2025 to 2035, By Country
    • Historical Market Size Value (USD Million) & Volume (Units) Trend Analysis By Market Taxonomy, 2020 to 2024
    • Market Size Value (USD Million) & Volume (Units) Forecast By Market Taxonomy, 2025 to 2035
      • By Country
        • USA
        • Canada
        • Mexico
      • By Type of Plates
      • By Procedure type
      • By End User
    • Market Attractiveness Analysis
      • By Country
      • By Type of Plates
      • By Procedure type
      • By End User
    • Key Takeaways
  10. Latin America Market Analysis 2020 to 2024 and Forecast 2025 to 2035, By Country
    • Historical Market Size Value (USD Million) & Volume (Units) Trend Analysis By Market Taxonomy, 2020 to 2024
    • Market Size Value (USD Million) & Volume (Units) Forecast By Market Taxonomy, 2025 to 2035
      • By Country
        • Brazil
        • Argentina
        • Rest of Latin America
      • By Type of Plates
      • By Procedure type
      • By End User
    • Market Attractiveness Analysis
      • By Country
      • By Type of Plates
      • By Procedure type
      • By End User
    • Key Takeaways
  11. East Asia Market Analysis 2020 to 2024 and Forecast 2025 to 2035, By Country
    • Historical Market Size Value (USD Million) & Volume (Units) Trend Analysis By Market Taxonomy, 2020 to 2024
    • Market Size Value (USD Million) & Volume (Units) Forecast By Market Taxonomy, 2025 to 2035
      • By Country
        • China
        • Japan
        • South Korea
      • By Type of Plates
      • By Procedure type
      • By End User
    • Market Attractiveness Analysis
      • By Country
      • By Type of Plates
      • By Procedure type
      • By End User
    • Key Takeaways
  12. South Asia & Pacific Market Analysis 2020 to 2024 and Forecast 2025 to 2035, By Country
    • Historical Market Size Value (USD Million) & Volume (Units) Trend Analysis By Market Taxonomy, 2020 to 2024
    • Market Size Value (USD Million) & Volume (Units) Forecast By Market Taxonomy, 2025 to 2035
      • By Country
        • India
        • ASEAN Countries
        • Australia& New Zealand
        • Rest of South Asia
      • By Type of Plates
      • By Procedure type
      • By End User
    • Market Attractiveness Analysis
      • By Country
      • By Type of Plates
      • By Procedure type
      • By End User
    • Key Takeaways
  13. Western Europe Market Analysis 2020 to 2024 and Forecast 2025 to 2035, By Country
    • Historical Market Size Value (USD Million) & Volume (Units) Trend Analysis By Market Taxonomy, 2020 to 2024
    • Market Size Value (USD Million) & Volume (Units) Forecast By Market Taxonomy, 2025 to 2035
      • By Country
        • Germany
        • UK
        • France
        • Italy
        • Spain
        • BENELUX
        • Nordic Countries
        • Rest of Western Europe
      • By Type of Plates
      • By Procedure type
      • By End User
    • Market Attractiveness Analysis
      • By Country
      • By Type of Plates
      • By Procedure type
      • By End User
    • Key Takeaways
  14. Eastern Europe Market Analysis 2020 to 2024 and Forecast 2025 to 2035, By Country
    • Historical Market Size Value (USD Million) & Volume (Units) Trend Analysis By Market Taxonomy, 2020 to 2024
    • Market Size Value (USD Million) & Volume (Units) Forecast By Market Taxonomy, 2025 to 2035
      • By Country
        • Russia
        • Hungary
        • Poland
        • Rest of Eastern Europe
      • By Type of Plates
      • By Procedure type
      • By End User
    • Market Attractiveness Analysis
      • By Country
      • By Type of Plates
      • By Procedure type
      • By End User
    • Key Takeaways
  15. Middle East & Africa Market Analysis 2020 to 2024 and Forecast 2025 to 2035, By Country
    • Historical Market Size Value (USD Million) & Volume (Units) Trend Analysis By Market Taxonomy, 2020 to 2024
    • Market Size Value (USD Million) & Volume (Units) Forecast By Market Taxonomy, 2025 to 2035
      • By Country
        • Saudi Arabia
        • Türkiye
        • South Africa
        • Other African Union
        • Rest of Middle East & Africa
      • By Type of Plates
      • By Procedure type
      • By End User
    • Market Attractiveness Analysis
      • By Country
      • By Type of Plates
      • By Procedure type
      • By End User
    • Key Takeaways
  16. Key Countries Market Analysis
    • USA
      • Pricing Analysis
      • Market Share Analysis, 2024
        • By Type of Plates
        • By Procedure type
        • By End User
    • Brazil
      • Pricing Analysis
      • Market Share Analysis, 2024
        • By Type of Plates
        • By Procedure type
        • By End User
    • China
      • Pricing Analysis
      • Market Share Analysis, 2024
        • By Type of Plates
        • By Procedure type
        • By End User
    • India
      • Pricing Analysis
      • Market Share Analysis, 2024
        • By Type of Plates
        • By Procedure type
        • By End User
    • Europe
      • Pricing Analysis
      • Market Share Analysis, 2024
        • By Type of Plates
        • By Procedure type
        • By End User
    • Germany
      • Pricing Analysis
      • Market Share Analysis, 2024
        • By Type of Plates
        • By Procedure type
        • By End User
    • France
      • Pricing Analysis
      • Market Share Analysis, 2024
        • By Type of Plates
        • By Procedure type
        • By End User
    • UK
      • Pricing Analysis
      • Market Share Analysis, 2024
        • By Type of Plates
        • By Procedure type
        • By End User
  17. Market Structure Analysis
    • Competition Dashboard
    • Competition Benchmarking
    • Market Share Analysis of Top Players
      • By Regional
      • By Type of Plates
      • By Procedure type
      • By End User
  18. Competition Analysis
    • Competition Deep Dive
      • Acumed
        • Overview
        • Product Portfolio
        • Profitability by Market Segments (Product/Age /Sales Channel/Region)
        • Sales Footprint
        • Strategy Overview
          • Marketing Strategy
          • Product Strategy
          • Channel Strategy
      • DePuy Synthes
        • Overview
        • Product Portfolio
        • Profitability by Market Segments (Product/Age /Sales Channel/Region)
        • Sales Footprint
        • Strategy Overview
          • Marketing Strategy
          • Product Strategy
          • Channel Strategy
      • Exactech
        • Overview
        • Product Portfolio
        • Profitability by Market Segments (Product/Age /Sales Channel/Region)
        • Sales Footprint
        • Strategy Overview
          • Marketing Strategy
          • Product Strategy
          • Channel Strategy
      • Zimmer Biomet
        • Overview
        • Product Portfolio
        • Profitability by Market Segments (Product/Age /Sales Channel/Region)
        • Sales Footprint
        • Strategy Overview
          • Marketing Strategy
          • Product Strategy
          • Channel Strategy
      • Implantcast GmbH
        • Overview
        • Product Portfolio
        • Profitability by Market Segments (Product/Age /Sales Channel/Region)
        • Sales Footprint
        • Strategy Overview
          • Marketing Strategy
          • Product Strategy
          • Channel Strategy
      • LIMACORPORATE SPA
        • Overview
        • Product Portfolio
        • Profitability by Market Segments (Product/Age /Sales Channel/Region)
        • Sales Footprint
        • Strategy Overview
          • Marketing Strategy
          • Product Strategy
          • Channel Strategy
      • TST Orthopedics
        • Overview
        • Product Portfolio
        • Profitability by Market Segments (Product/Age /Sales Channel/Region)
        • Sales Footprint
        • Strategy Overview
          • Marketing Strategy
          • Product Strategy
          • Channel Strategy
      • Others
        • Overview
        • Product Portfolio
        • Profitability by Market Segments (Product/Age /Sales Channel/Region)
        • Sales Footprint
        • Strategy Overview
          • Marketing Strategy
          • Product Strategy
          • Channel Strategy
  19. Assumptions & Acronyms Used
  20. Research Methodology

List of Tables

  • Table 1: Global Market Value (USD Million) Forecast by Region, 2020-2035
  • Table 2: Global Market Volume (Units) Forecast by Region, 2020-2035
  • Table 3: Global Market Value (USD Million) Forecast by Type of Plates, 2020-2035
  • Table 4: Global Market Volume (Units) Forecast by Type of Plates, 2020-2035
  • Table 5: Global Market Value (USD Million) Forecast by Procedure type, 2020-2035
  • Table 6: Global Market Volume (Units) Forecast by Procedure type, 2020-2035
  • Table 7: Global Market Value (USD Million) Forecast by End User, 2020-2035
  • Table 8: Global Market Volume (Units) Forecast by End User, 2020-2035
  • Table 9: North America Market Value (USD Million) Forecast by Country, 2020-2035
  • Table 10: North America Market Volume (Units) Forecast by Country, 2020-2035
  • Table 11: North America Market Value (USD Million) Forecast by Type of Plates, 2020-2035
  • Table 12: North America Market Volume (Units) Forecast by Type of Plates, 2020-2035
  • Table 13: North America Market Value (USD Million) Forecast by Procedure type, 2020-2035
  • Table 14: North America Market Volume (Units) Forecast by Procedure type, 2020-2035
  • Table 15: North America Market Value (USD Million) Forecast by End User, 2020-2035
  • Table 16: North America Market Volume (Units) Forecast by End User, 2020-2035
  • Table 17: Latin America Market Value (USD Million) Forecast by Country, 2020-2035
  • Table 18: Latin America Market Volume (Units) Forecast by Country, 2020-2035
  • Table 19: Latin America Market Value (USD Million) Forecast by Type of Plates, 2020-2035
  • Table 20: Latin America Market Volume (Units) Forecast by Type of Plates, 2020-2035
  • Table 21: Latin America Market Value (USD Million) Forecast by Procedure type, 2020-2035
  • Table 22: Latin America Market Volume (Units) Forecast by Procedure type, 2020-2035
  • Table 23: Latin America Market Value (USD Million) Forecast by End User, 2020-2035
  • Table 24: Latin America Market Volume (Units) Forecast by End User, 2020-2035
  • Table 25: East Asia Market Value (USD Million) Forecast by Country, 2020-2035
  • Table 26: East Asia Market Volume (Units) Forecast by Country, 2020-2035
  • Table 27: East Asia Market Value (USD Million) Forecast by Type of Plates, 2020-2035
  • Table 28: East Asia Market Volume (Units) Forecast by Type of Plates, 2020-2035
  • Table 29: East Asia Market Value (USD Million) Forecast by Procedure type, 2020-2035
  • Table 30: East Asia Market Volume (Units) Forecast by Procedure type, 2020-2035
  • Table 31: East Asia Market Value (USD Million) Forecast by End User, 2020-2035
  • Table 32: East Asia Market Volume (Units) Forecast by End User, 2020-2035
  • Table 33: South Asia & Pacific Market Value (USD Million) Forecast by Country, 2020-2035
  • Table 34: South Asia & Pacific Market Volume (Units) Forecast by Country, 2020-2035
  • Table 35: South Asia & Pacific Market Value (USD Million) Forecast by Type of Plates, 2020-2035
  • Table 36: South Asia & Pacific Market Volume (Units) Forecast by Type of Plates, 2020-2035
  • Table 37: South Asia & Pacific Market Value (USD Million) Forecast by Procedure type, 2020-2035
  • Table 38: South Asia & Pacific Market Volume (Units) Forecast by Procedure type, 2020-2035
  • Table 39: South Asia & Pacific Market Value (USD Million) Forecast by End User, 2020-2035
  • Table 40: South Asia & Pacific Market Volume (Units) Forecast by End User, 2020-2035
  • Table 41: Western Europe Market Value (USD Million) Forecast by Country, 2020-2035
  • Table 42: Western Europe Market Volume (Units) Forecast by Country, 2020-2035
  • Table 43: Western Europe Market Value (USD Million) Forecast by Type of Plates, 2020-2035
  • Table 44: Western Europe Market Volume (Units) Forecast by Type of Plates, 2020-2035
  • Table 45: Western Europe Market Value (USD Million) Forecast by Procedure type, 2020-2035
  • Table 46: Western Europe Market Volume (Units) Forecast by Procedure type, 2020-2035
  • Table 47: Western Europe Market Value (USD Million) Forecast by End User, 2020-2035
  • Table 48: Western Europe Market Volume (Units) Forecast by End User, 2020-2035
  • Table 49: Eastern Europe Market Value (USD Million) Forecast by Country, 2020-2035
  • Table 50: Eastern Europe Market Volume (Units) Forecast by Country, 2020-2035
  • Table 51: Eastern Europe Market Value (USD Million) Forecast by Type of Plates, 2020-2035
  • Table 52: Eastern Europe Market Volume (Units) Forecast by Type of Plates, 2020-2035
  • Table 53: Eastern Europe Market Value (USD Million) Forecast by Procedure type, 2020-2035
  • Table 54: Eastern Europe Market Volume (Units) Forecast by Procedure type, 2020-2035
  • Table 55: Eastern Europe Market Value (USD Million) Forecast by End User, 2020-2035
  • Table 56: Eastern Europe Market Volume (Units) Forecast by End User, 2020-2035
  • Table 57: Middle East & Africa Market Value (USD Million) Forecast by Country, 2020-2035
  • Table 58: Middle East & Africa Market Volume (Units) Forecast by Country, 2020-2035
  • Table 59: Middle East & Africa Market Value (USD Million) Forecast by Type of Plates, 2020-2035
  • Table 60: Middle East & Africa Market Volume (Units) Forecast by Type of Plates, 2020-2035
  • Table 61: Middle East & Africa Market Value (USD Million) Forecast by Procedure type, 2020-2035
  • Table 62: Middle East & Africa Market Volume (Units) Forecast by Procedure type, 2020-2035
  • Table 63: Middle East & Africa Market Value (USD Million) Forecast by End User, 2020-2035
  • Table 64: Middle East & Africa Market Volume (Units) Forecast by End User, 2020-2035

List of Figures

  • Figure 1: Global Market Value (USD Million) by Type of Plates, 2025-2035
  • Figure 2: Global Market Value (USD Million) by Procedure type, 2025-2035
  • Figure 3: Global Market Value (USD Million) by End User, 2025-2035
  • Figure 4: Global Market Value (USD Million) by Region, 2025-2035
  • Figure 5: Global Market Value (USD Million) Analysis by Region, 2020-2035
  • Figure 6: Global Market Volume (Units) Analysis by Region, 2020-2035
  • Figure 7: Global Market Value Share (%) and BPS Analysis by Region, 2025-2035
  • Figure 8: Global Market Y-o-Y Growth (%) Projections by Region, 2025-2035
  • Figure 9: Global Market Value (USD Million) Analysis by Type of Plates, 2020-2035
  • Figure 10: Global Market Volume (Units) Analysis by Type of Plates, 2020-2035
  • Figure 11: Global Market Value Share (%) and BPS Analysis by Type of Plates, 2025-2035
  • Figure 12: Global Market Y-o-Y Growth (%) Projections by Type of Plates, 2025-2035
  • Figure 13: Global Market Value (USD Million) Analysis by Procedure type, 2020-2035
  • Figure 14: Global Market Volume (Units) Analysis by Procedure type, 2020-2035
  • Figure 15: Global Market Value Share (%) and BPS Analysis by Procedure type, 2025-2035
  • Figure 16: Global Market Y-o-Y Growth (%) Projections by Procedure type, 2025-2035
  • Figure 17: Global Market Value (USD Million) Analysis by End User, 2020-2035
  • Figure 18: Global Market Volume (Units) Analysis by End User, 2020-2035
  • Figure 19: Global Market Value Share (%) and BPS Analysis by End User, 2025-2035
  • Figure 20: Global Market Y-o-Y Growth (%) Projections by End User, 2025-2035
  • Figure 21: Global Market Attractiveness by Type of Plates, 2025-2035
  • Figure 22: Global Market Attractiveness by Procedure type, 2025-2035
  • Figure 23: Global Market Attractiveness by End User, 2025-2035
  • Figure 24: Global Market Attractiveness by Region, 2025-2035
  • Figure 25: North America Market Value (USD Million) by Type of Plates, 2025-2035
  • Figure 26: North America Market Value (USD Million) by Procedure type, 2025-2035
  • Figure 27: North America Market Value (USD Million) by End User, 2025-2035
  • Figure 28: North America Market Value (USD Million) by Country, 2025-2035
  • Figure 29: North America Market Value (USD Million) Analysis by Country, 2020-2035
  • Figure 30: North America Market Volume (Units) Analysis by Country, 2020-2035
  • Figure 31: North America Market Value Share (%) and BPS Analysis by Country, 2025-2035
  • Figure 32: North America Market Y-o-Y Growth (%) Projections by Country, 2025-2035
  • Figure 33: North America Market Value (USD Million) Analysis by Type of Plates, 2020-2035
  • Figure 34: North America Market Volume (Units) Analysis by Type of Plates, 2020-2035
  • Figure 35: North America Market Value Share (%) and BPS Analysis by Type of Plates, 2025-2035
  • Figure 36: North America Market Y-o-Y Growth (%) Projections by Type of Plates, 2025-2035
  • Figure 37: North America Market Value (USD Million) Analysis by Procedure type, 2020-2035
  • Figure 38: North America Market Volume (Units) Analysis by Procedure type, 2020-2035
  • Figure 39: North America Market Value Share (%) and BPS Analysis by Procedure type, 2025-2035
  • Figure 40: North America Market Y-o-Y Growth (%) Projections by Procedure type, 2025-2035
  • Figure 41: North America Market Value (USD Million) Analysis by End User, 2020-2035
  • Figure 42: North America Market Volume (Units) Analysis by End User, 2020-2035
  • Figure 43: North America Market Value Share (%) and BPS Analysis by End User, 2025-2035
  • Figure 44: North America Market Y-o-Y Growth (%) Projections by End User, 2025-2035
  • Figure 45: North America Market Attractiveness by Type of Plates, 2025-2035
  • Figure 46: North America Market Attractiveness by Procedure type, 2025-2035
  • Figure 47: North America Market Attractiveness by End User, 2025-2035
  • Figure 48: North America Market Attractiveness by Country, 2025-2035
  • Figure 49: Latin America Market Value (USD Million) by Type of Plates, 2025-2035
  • Figure 50: Latin America Market Value (USD Million) by Procedure type, 2025-2035
  • Figure 51: Latin America Market Value (USD Million) by End User, 2025-2035
  • Figure 52: Latin America Market Value (USD Million) by Country, 2025-2035
  • Figure 53: Latin America Market Value (USD Million) Analysis by Country, 2020-2035
  • Figure 54: Latin America Market Volume (Units) Analysis by Country, 2020-2035
  • Figure 55: Latin America Market Value Share (%) and BPS Analysis by Country, 2025-2035
  • Figure 56: Latin America Market Y-o-Y Growth (%) Projections by Country, 2025-2035
  • Figure 57: Latin America Market Value (USD Million) Analysis by Type of Plates, 2020-2035
  • Figure 58: Latin America Market Volume (Units) Analysis by Type of Plates, 2020-2035
  • Figure 59: Latin America Market Value Share (%) and BPS Analysis by Type of Plates, 2025-2035
  • Figure 60: Latin America Market Y-o-Y Growth (%) Projections by Type of Plates, 2025-2035
  • Figure 61: Latin America Market Value (USD Million) Analysis by Procedure type, 2020-2035
  • Figure 62: Latin America Market Volume (Units) Analysis by Procedure type, 2020-2035
  • Figure 63: Latin America Market Value Share (%) and BPS Analysis by Procedure type, 2025-2035
  • Figure 64: Latin America Market Y-o-Y Growth (%) Projections by Procedure type, 2025-2035
  • Figure 65: Latin America Market Value (USD Million) Analysis by End User, 2020-2035
  • Figure 66: Latin America Market Volume (Units) Analysis by End User, 2020-2035
  • Figure 67: Latin America Market Value Share (%) and BPS Analysis by End User, 2025-2035
  • Figure 68: Latin America Market Y-o-Y Growth (%) Projections by End User, 2025-2035
  • Figure 69: Latin America Market Attractiveness by Type of Plates, 2025-2035
  • Figure 70: Latin America Market Attractiveness by Procedure type, 2025-2035
  • Figure 71: Latin America Market Attractiveness by End User, 2025-2035
  • Figure 72: Latin America Market Attractiveness by Country, 2025-2035
  • Figure 73: East Asia Market Value (USD Million) by Type of Plates, 2025-2035
  • Figure 74: East Asia Market Value (USD Million) by Procedure type, 2025-2035
  • Figure 75: East Asia Market Value (USD Million) by End User, 2025-2035
  • Figure 76: East Asia Market Value (USD Million) by Country, 2025-2035
  • Figure 77: East Asia Market Value (USD Million) Analysis by Country, 2020-2035
  • Figure 78: East Asia Market Volume (Units) Analysis by Country, 2020-2035
  • Figure 79: East Asia Market Value Share (%) and BPS Analysis by Country, 2025-2035
  • Figure 80: East Asia Market Y-o-Y Growth (%) Projections by Country, 2025-2035
  • Figure 81: East Asia Market Value (USD Million) Analysis by Type of Plates, 2020-2035
  • Figure 82: East Asia Market Volume (Units) Analysis by Type of Plates, 2020-2035
  • Figure 83: East Asia Market Value Share (%) and BPS Analysis by Type of Plates, 2025-2035
  • Figure 84: East Asia Market Y-o-Y Growth (%) Projections by Type of Plates, 2025-2035
  • Figure 85: East Asia Market Value (USD Million) Analysis by Procedure type, 2020-2035
  • Figure 86: East Asia Market Volume (Units) Analysis by Procedure type, 2020-2035
  • Figure 87: East Asia Market Value Share (%) and BPS Analysis by Procedure type, 2025-2035
  • Figure 88: East Asia Market Y-o-Y Growth (%) Projections by Procedure type, 2025-2035
  • Figure 89: East Asia Market Value (USD Million) Analysis by End User, 2020-2035
  • Figure 90: East Asia Market Volume (Units) Analysis by End User, 2020-2035
  • Figure 91: East Asia Market Value Share (%) and BPS Analysis by End User, 2025-2035
  • Figure 92: East Asia Market Y-o-Y Growth (%) Projections by End User, 2025-2035
  • Figure 93: East Asia Market Attractiveness by Type of Plates, 2025-2035
  • Figure 94: East Asia Market Attractiveness by Procedure type, 2025-2035
  • Figure 95: East Asia Market Attractiveness by End User, 2025-2035
  • Figure 96: East Asia Market Attractiveness by Country, 2025-2035
  • Figure 97: South Asia & Pacific Market Value (USD Million) by Type of Plates, 2025-2035
  • Figure 98: South Asia & Pacific Market Value (USD Million) by Procedure type, 2025-2035
  • Figure 99: South Asia & Pacific Market Value (USD Million) by End User, 2025-2035
  • Figure 100: South Asia & Pacific Market Value (USD Million) by Country, 2025-2035
  • Figure 101: South Asia & Pacific Market Value (USD Million) Analysis by Country, 2020-2035
  • Figure 102: South Asia & Pacific Market Volume (Units) Analysis by Country, 2020-2035
  • Figure 103: South Asia & Pacific Market Value Share (%) and BPS Analysis by Country, 2025-2035
  • Figure 104: South Asia & Pacific Market Y-o-Y Growth (%) Projections by Country, 2025-2035
  • Figure 105: South Asia & Pacific Market Value (USD Million) Analysis by Type of Plates, 2020-2035
  • Figure 106: South Asia & Pacific Market Volume (Units) Analysis by Type of Plates, 2020-2035
  • Figure 107: South Asia & Pacific Market Value Share (%) and BPS Analysis by Type of Plates, 2025-2035
  • Figure 108: South Asia & Pacific Market Y-o-Y Growth (%) Projections by Type of Plates, 2025-2035
  • Figure 109: South Asia & Pacific Market Value (USD Million) Analysis by Procedure type, 2020-2035
  • Figure 110: South Asia & Pacific Market Volume (Units) Analysis by Procedure type, 2020-2035
  • Figure 111: South Asia & Pacific Market Value Share (%) and BPS Analysis by Procedure type, 2025-2035
  • Figure 112: South Asia & Pacific Market Y-o-Y Growth (%) Projections by Procedure type, 2025-2035
  • Figure 113: South Asia & Pacific Market Value (USD Million) Analysis by End User, 2020-2035
  • Figure 114: South Asia & Pacific Market Volume (Units) Analysis by End User, 2020-2035
  • Figure 115: South Asia & Pacific Market Value Share (%) and BPS Analysis by End User, 2025-2035
  • Figure 116: South Asia & Pacific Market Y-o-Y Growth (%) Projections by End User, 2025-2035
  • Figure 117: South Asia & Pacific Market Attractiveness by Type of Plates, 2025-2035
  • Figure 118: South Asia & Pacific Market Attractiveness by Procedure type, 2025-2035
  • Figure 119: South Asia & Pacific Market Attractiveness by End User, 2025-2035
  • Figure 120: South Asia & Pacific Market Attractiveness by Country, 2025-2035
  • Figure 121: Western Europe Market Value (USD Million) by Type of Plates, 2025-2035
  • Figure 122: Western Europe Market Value (USD Million) by Procedure type, 2025-2035
  • Figure 123: Western Europe Market Value (USD Million) by End User, 2025-2035
  • Figure 124: Western Europe Market Value (USD Million) by Country, 2025-2035
  • Figure 125: Western Europe Market Value (USD Million) Analysis by Country, 2020-2035
  • Figure 126: Western Europe Market Volume (Units) Analysis by Country, 2020-2035
  • Figure 127: Western Europe Market Value Share (%) and BPS Analysis by Country, 2025-2035
  • Figure 128: Western Europe Market Y-o-Y Growth (%) Projections by Country, 2025-2035
  • Figure 129: Western Europe Market Value (USD Million) Analysis by Type of Plates, 2020-2035
  • Figure 130: Western Europe Market Volume (Units) Analysis by Type of Plates, 2020-2035
  • Figure 131: Western Europe Market Value Share (%) and BPS Analysis by Type of Plates, 2025-2035
  • Figure 132: Western Europe Market Y-o-Y Growth (%) Projections by Type of Plates, 2025-2035
  • Figure 133: Western Europe Market Value (USD Million) Analysis by Procedure type, 2020-2035
  • Figure 134: Western Europe Market Volume (Units) Analysis by Procedure type, 2020-2035
  • Figure 135: Western Europe Market Value Share (%) and BPS Analysis by Procedure type, 2025-2035
  • Figure 136: Western Europe Market Y-o-Y Growth (%) Projections by Procedure type, 2025-2035
  • Figure 137: Western Europe Market Value (USD Million) Analysis by End User, 2020-2035
  • Figure 138: Western Europe Market Volume (Units) Analysis by End User, 2020-2035
  • Figure 139: Western Europe Market Value Share (%) and BPS Analysis by End User, 2025-2035
  • Figure 140: Western Europe Market Y-o-Y Growth (%) Projections by End User, 2025-2035
  • Figure 141: Western Europe Market Attractiveness by Type of Plates, 2025-2035
  • Figure 142: Western Europe Market Attractiveness by Procedure type, 2025-2035
  • Figure 143: Western Europe Market Attractiveness by End User, 2025-2035
  • Figure 144: Western Europe Market Attractiveness by Country, 2025-2035
  • Figure 145: Eastern Europe Market Value (USD Million) by Type of Plates, 2025-2035
  • Figure 146: Eastern Europe Market Value (USD Million) by Procedure type, 2025-2035
  • Figure 147: Eastern Europe Market Value (USD Million) by End User, 2025-2035
  • Figure 148: Eastern Europe Market Value (USD Million) by Country, 2025-2035
  • Figure 149: Eastern Europe Market Value (USD Million) Analysis by Country, 2020-2035
  • Figure 150: Eastern Europe Market Volume (Units) Analysis by Country, 2020-2035
  • Figure 151: Eastern Europe Market Value Share (%) and BPS Analysis by Country, 2025-2035
  • Figure 152: Eastern Europe Market Y-o-Y Growth (%) Projections by Country, 2025-2035
  • Figure 153: Eastern Europe Market Value (USD Million) Analysis by Type of Plates, 2020-2035
  • Figure 154: Eastern Europe Market Volume (Units) Analysis by Type of Plates, 2020-2035
  • Figure 155: Eastern Europe Market Value Share (%) and BPS Analysis by Type of Plates, 2025-2035
  • Figure 156: Eastern Europe Market Y-o-Y Growth (%) Projections by Type of Plates, 2025-2035
  • Figure 157: Eastern Europe Market Value (USD Million) Analysis by Procedure type, 2020-2035
  • Figure 158: Eastern Europe Market Volume (Units) Analysis by Procedure type, 2020-2035
  • Figure 159: Eastern Europe Market Value Share (%) and BPS Analysis by Procedure type, 2025-2035
  • Figure 160: Eastern Europe Market Y-o-Y Growth (%) Projections by Procedure type, 2025-2035
  • Figure 161: Eastern Europe Market Value (USD Million) Analysis by End User, 2020-2035
  • Figure 162: Eastern Europe Market Volume (Units) Analysis by End User, 2020-2035
  • Figure 163: Eastern Europe Market Value Share (%) and BPS Analysis by End User, 2025-2035
  • Figure 164: Eastern Europe Market Y-o-Y Growth (%) Projections by End User, 2025-2035
  • Figure 165: Eastern Europe Market Attractiveness by Type of Plates, 2025-2035
  • Figure 166: Eastern Europe Market Attractiveness by Procedure type, 2025-2035
  • Figure 167: Eastern Europe Market Attractiveness by End User, 2025-2035
  • Figure 168: Eastern Europe Market Attractiveness by Country, 2025-2035
  • Figure 169: Middle East & Africa Market Value (USD Million) by Type of Plates, 2025-2035
  • Figure 170: Middle East & Africa Market Value (USD Million) by Procedure type, 2025-2035
  • Figure 171: Middle East & Africa Market Value (USD Million) by End User, 2025-2035
  • Figure 172: Middle East & Africa Market Value (USD Million) by Country, 2025-2035
  • Figure 173: Middle East & Africa Market Value (USD Million) Analysis by Country, 2020-2035
  • Figure 174: Middle East & Africa Market Volume (Units) Analysis by Country, 2020-2035
  • Figure 175: Middle East & Africa Market Value Share (%) and BPS Analysis by Country, 2025-2035
  • Figure 176: Middle East & Africa Market Y-o-Y Growth (%) Projections by Country, 2025-2035
  • Figure 177: Middle East & Africa Market Value (USD Million) Analysis by Type of Plates, 2020-2035
  • Figure 178: Middle East & Africa Market Volume (Units) Analysis by Type of Plates, 2020-2035
  • Figure 179: Middle East & Africa Market Value Share (%) and BPS Analysis by Type of Plates, 2025-2035
  • Figure 180: Middle East & Africa Market Y-o-Y Growth (%) Projections by Type of Plates, 2025-2035
  • Figure 181: Middle East & Africa Market Value (USD Million) Analysis by Procedure type, 2020-2035
  • Figure 182: Middle East & Africa Market Volume (Units) Analysis by Procedure type, 2020-2035
  • Figure 183: Middle East & Africa Market Value Share (%) and BPS Analysis by Procedure type, 2025-2035
  • Figure 184: Middle East & Africa Market Y-o-Y Growth (%) Projections by Procedure type, 2025-2035
  • Figure 185: Middle East & Africa Market Value (USD Million) Analysis by End User, 2020-2035
  • Figure 186: Middle East & Africa Market Volume (Units) Analysis by End User, 2020-2035
  • Figure 187: Middle East & Africa Market Value Share (%) and BPS Analysis by End User, 2025-2035
  • Figure 188: Middle East & Africa Market Y-o-Y Growth (%) Projections by End User, 2025-2035
  • Figure 189: Middle East & Africa Market Attractiveness by Type of Plates, 2025-2035
  • Figure 190: Middle East & Africa Market Attractiveness by Procedure type, 2025-2035
  • Figure 191: Middle East & Africa Market Attractiveness by End User, 2025-2035
  • Figure 192: Middle East & Africa Market Attractiveness by Country, 2025-2035

Frequently Asked Questions

How big is the Scapula Reconstruction Market in 2025?

The global Scapula Reconstruction Market is estimated to be valued at USD 103.8 million in 2025.

What will be the size of the Scapula Reconstruction Market in 2035?

The market size for Scapula Reconstruction is projected to reach USD 152.2 million by 2035.

How much will the Scapula Reconstruction Market grow between 2025 and 2035?

The Scapula Reconstruction Market is expected to grow at a CAGR of 3.9% during this period.

What are the key product types in the Scapula Reconstruction Market?

Key product types include Lateral Border Plates, Medial Border Plates, Glenoid Plates, Acromion Plates, and Clavicle-to-Scapula Fixation Plates.

Which end-user will contribute a significant share in the Scapula Reconstruction Market in 2025?

Hospitals are projected to command 35.2% of the market in 2025, followed by Ambulatory Surgical Centers (ASCs) at 28.5%.

Explore Similar Insights

Future Market Insights

Scapula Reconstruction Market