The SD-WAN security market is estimated to be valued at USD 4.4 billion in 2025 and is projected to reach USD 30.1 billion by 2035, registering a compound annual growth rate (CAGR) of 21.2% over the forecast period.
The market operates within enterprise networking environments where distributed connectivity requirements and cybersecurity threats create coordination challenges between network operations teams and security departments. Corporate IT organizations experience operational complexity as SD-WAN security deployment requires coordination between branch office connectivity, cloud application access, and centralized security policy enforcement while managing threat detection capabilities, network performance optimization, and compliance monitoring that affects both user experience and security posture across geographically distributed locations.
Network security operations encounter integration challenges as secure SD-WAN implementation requires coordination between traditional firewall policies, cloud-based security services, and network performance management while managing encryption key distribution, identity verification procedures, and incident response protocols. Security analysts work with network engineers to establish traffic inspection parameters while coordinating with cloud service providers about security service chaining and policy consistency across multiple connectivity paths and service providers.
Cross-functional coordination between network architecture teams and cybersecurity specialists creates ongoing dialogue about security policy enforcement versus network performance and user productivity requirements. Network architects work with security managers to evaluate zero-trust network access implementations while coordinating with business operations about application performance requirements and user access procedures that balance security effectiveness against operational efficiency across diverse business applications.
Cloud migration projects introduce architectural considerations as SD-WAN security must coordinate with multi-cloud connectivity requirements, application performance needs, and data protection policies while managing traffic routing optimization and security service integration. Cloud architects coordinate with network security teams to establish connectivity procedures while working with application teams about performance requirements and security policies that maintain both functionality and protection across hybrid cloud environments.
Retail and hospitality operations experience network segmentation complexity as SD-WAN security deployment requires coordination between customer network access, payment processing systems, and corporate network connectivity while managing point-of-sale security and guest access controls. IT managers coordinate with operations teams to establish network access policies while working with compliance specialists about payment card industry requirements and data protection standards.
The integration of artificial intelligence and machine learning capabilities introduces operational considerations as advanced SD-WAN security platforms require coordination between automated threat detection and human security analyst expertise while managing policy automation, behavioral analysis, and security orchestration workflows. Security operations teams coordinate with data analytics specialists to establish machine learning training procedures while managing integration requirements between automated security responses and network performance optimization across evolving threat landscapes and business connectivity requirements.
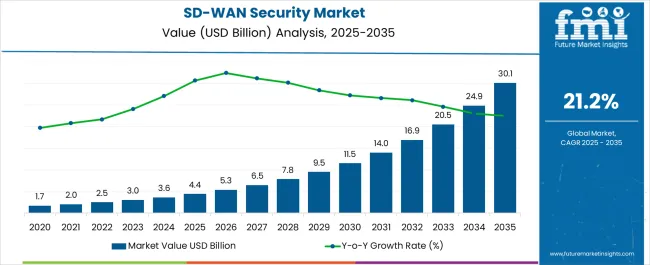
| Metric | Value |
|---|---|
| SD-WAN Security Market Estimated Value in (2025 E) | USD 4.4 billion |
| SD-WAN Security Market Forecast Value in (2035 F) | USD 30.1 billion |
| Forecast CAGR (2025 to 2035) | 21.2% |
The SD WAN security market is witnessing rapid expansion as enterprises continue to modernize network infrastructures and secure distributed operations. Growing adoption of cloud services, remote workforce models, and increasing cyber threats have intensified the demand for integrated security solutions within SD WAN frameworks.
Enterprises are prioritizing secure connectivity that ensures reliable performance without compromising on data protection. Advancements in threat intelligence, automated policy enforcement, and AI driven traffic monitoring are strengthening adoption across diverse sectors.
Regulatory mandates surrounding data protection and the need for consistent compliance across geographies are further fueling investment in SD WAN security. The market outlook remains strong as businesses seek scalable, cost efficient, and resilient network security solutions that align with digital transformation strategies.
The market is segmented by Solution, Enterprise Size, and Industry and region. By Solution, the market is divided into Network Firewall, DDoS Detection and Mitigation, Secure Web Gateways, Session Border Controller (SBC), Network Encryption, and Others. In terms of Enterprise Size, the market is classified into Small and Medium-sized Enterprises (SMEs) and Large Enterprises. Based on Industry, the market is segmented into IT & Telecom, BFSI, Healthcare, Manufacturing, Retail, Government, and Others. Regionally, the market is classified into North America, Latin America, Western Europe, Eastern Europe, Balkan & Baltic Countries, Russia & Belarus, Central Asia, East Asia, South Asia & Pacific, and the Middle East & Africa.
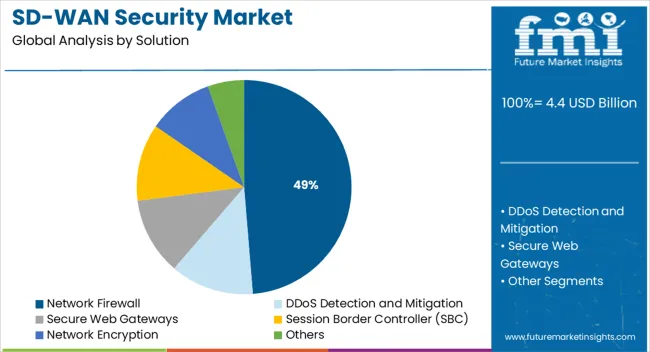
The network firewall segment is expected to represent 48.70% of total market revenue by 2025 within the solution category, making it the dominant segment. This growth is being driven by the need to safeguard against increasingly sophisticated cyberattacks and unauthorized access attempts in distributed network environments.
Network firewalls provide centralized policy enforcement, intrusion detection, and traffic monitoring that are essential for secure connectivity across SD WAN deployments. Their ability to integrate with advanced threat intelligence and support zero trust frameworks has further reinforced adoption.
The cost efficiency and scalability of firewall based solutions have made them the preferred choice for enterprises seeking a reliable first line of defense in SD WAN security strategies.
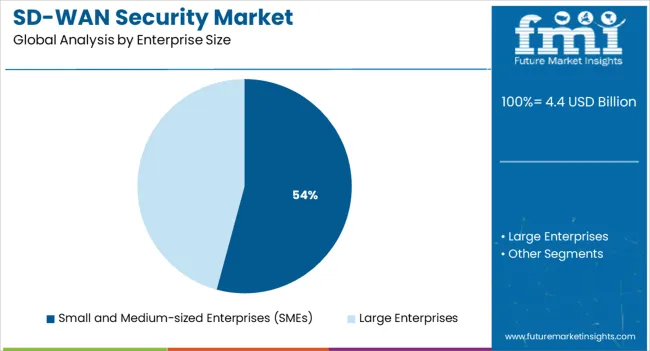
The small and medium sized enterprises segment is projected to account for 54.20% of total market revenue by 2025 under the enterprise size category, positioning it as the largest segment. The rapid adoption among SMEs is being driven by their increasing reliance on cloud services and remote workforce models which require cost effective and simplified security solutions.
SMEs face resource constraints that make integrated SD WAN security offerings attractive, as these solutions reduce complexity while ensuring compliance and protection. Vendors are increasingly targeting SMEs with managed services and subscription based models that align with their operational and budgetary needs.
The ability of SD WAN security to enhance agility, reduce downtime, and protect sensitive data has cemented its role as the preferred choice for this enterprise group.
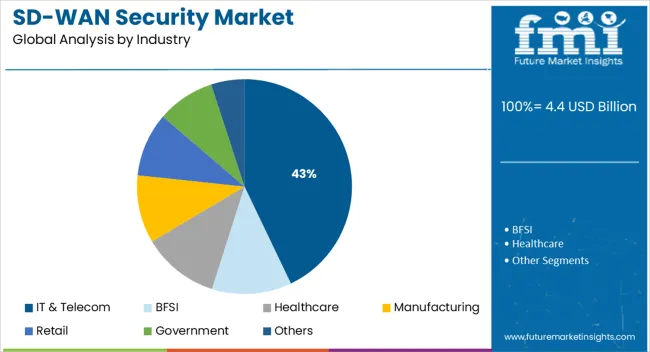
The IT and telecom segment is anticipated to contribute 42.90% of total market revenue by 2025 within the industry category, making it the leading vertical. This dominance is being fueled by the high volume of data traffic managed by IT service providers and telecom operators, which demands advanced security integration within SD WAN frameworks.
The sector’s pivotal role in digital transformation and cloud connectivity has reinforced the need for robust security to ensure uptime, regulatory compliance, and customer trust. Continuous innovation in telecom networks including 5G and edge computing has further elevated the importance of secure SD WAN adoption.
As IT and telecom companies prioritize secure, scalable, and performance optimized infrastructure, this industry continues to anchor the growth trajectory of the SD WAN security market.
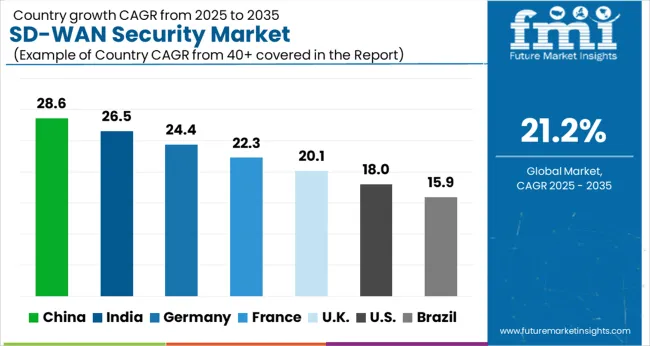
The SD-WAN security demand is estimated to grow at 21.2% CAGR between 2025 and 2035 in comparison with 19.1% CAGR during historic period of 2020 to 2025 as the adoption of traditional WAN was more in the historic period.
Traditional WAN offered a conventional method of controlling wide area network. Scaling of traditional network is very difficult as it requires a proper advanced planning together with needed network infrastructure to set up and run. Security issues and management difficulties are the major issues in traditional WAN.
Traditional WAN does not offer low cost and high-speed connectivity and it fails to offer a better flexibility in WAN management. To overcome this challenge, the adoption of SD-WAN security is rising as it offers high performance with regards to application in cloud. It also offers constant prevention against all internal and external threats, from branches to SaaS (Software as a Service).
The network firewall segment in the global SD-WAN security market is expected to have dominant market share of 38.2% in 2025. Owing to high adoption of network security solutions among enterprises, North America is currently dominating the global SD-WAN security market.
As enterprise environments continue to develop, three fundamental shifts are increasing the demand for a new variety of SD-WAN security solutions:
In the year 2024, Palo Alto Networks had launched a next generation SD-WAN security solution that offers essential branch services, like security, networking and more, from the cloud.
Through Machine Learning (ML), organizations can remove network trouble tickets and enhance the end user experience by enabling a rise in WAN bandwidth for a lower price than legacy SD-WAN solutions. With the help of next-generation security solutions, enterprises can secure their data and improves network security, this factor is boosting the market growth.
Next generation SD-WAN provides three clear advantages:
Next-Generation Firewall (NGFW) is a primary element of SD-WAN security. Deployed at branches as well as headquarters, an NGFW is an enhanced and virtualized version of traditional hardware-based firewalls.
An NGFW runs multiple Virtual Network Functions (VNFs), like intrusion detection and protection, application awareness, URL and web content filtering, antivirus prevention, and malware detection. Thus, with the help of the next-generation firewall enterprises can make sure all devices, users, and locations are prevented, the advanced security threats and vulnerabilities are identified and protected, and scalability is attained.
| Countries | BPS Change (H2'22 (O) - H2'22 (P)) |
|---|---|
| USA | (+)128 |
| United kingdom | (+)122 |
| Japan | (+)118 |
| India | (+)121 |
| China | (+)116 |
The shift towards remote work has increased the demand for secure, reliable, and flexible network solutions that can support a distributed workforce in the USA drove the BPS change of (+)128 BPS units for H2’22(O)-H2’22(P)
The Indian government's push towards digital transformation has increased the demand for secure, reliable, and flexible network solutions that saw a BPS change of (+)121 units. The growing use of cloud services has led to an increase in WAN traffic in the United kingdom saw a BPS change of (+)122 units
SD-WAN offers improved network performance and reliability, making it an attractive solution in China witnessed a BPS change of (+)116 units. The combination of remote work, cloud adoption, improved network performance, and cybersecurity in Japan allowed a BPS change of (+)118 units.
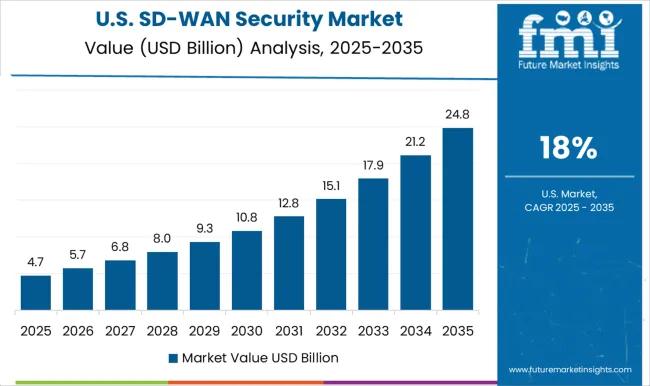
Exponential Growth Likely in the USA as More Enterprises Move to Automation
The SD-WAN demand in the USA is estimated to grow by 8.4X during the predicted period. In the USA, SD-WAN security providers are concentrating on offering intrusion detection and intrusion protection system that helps in identifying, analyzing and act against irregular deviation from intelligent attacks based on user behavior.
In the USA, SD-WAN security solutions are utilized by many leading enterprises because they can prevent application traffic from threats within the enterprises and from outside by supporting a full stack of security solutions included in SD-WAN like next-gen firewalls, URL filtering, cloud security and malware prevention.
Large scale investments for infrastructure modernization and increasing adoption of automation technologies like artificial intelligence (AI) and internet of things (IoT) is also driving the market growth in the USA
SD-WAN Security Solutions Demand to Soar in the United kingdom
Europe is predicted to remain one of the most attractive markets during the forecast period. According to the study, the United kingdom is estimated to grow by 10.2X during the forecast period. In the United kingdom enterprises are implementing SD-WAN security solutions because it offers enhanced user experience via secure direct internet cloud access and offers constant prevention against cyber threats.
SD-WAN security offers centralized visibility and control for all internal, inbound, and outbound traffic. It also offers benefits like reduced complexity, lower costs, and make bench communications safer, they help business become more responsive and agile, these features offered by the SD-WAN security drive the adoption of the solution in the United kingdom
Demand for Deployment in Complex IT Infrastructure of Japan to Soar
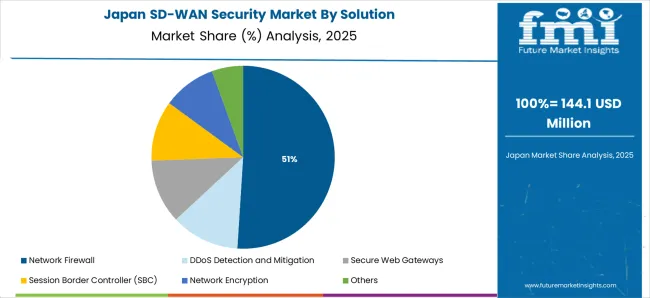
The sales revenue in Japan is estimated to grow at an impressive rate of around 25.3% CAGR between 2025 and 2035. In Japan, IT sector is rising rapidly. Along with this, adoption of network security solutions is increasing at a high growth rate. Dependence on networks is growing and this has led to rise in adoption of network security solutions.
Due to businesses increasing robustly, complexity in IT infrastructure is also increasing, that companies are unable to manage and control. As a result, companies in the Japan are adopting network security solutions to withstand cyber-attacks.
Network Firewall to Emerge as Preferred Solution
The network firewall segment is expected to account for higher market share in the coming years. This segment is anticipated to grow by absolute opportunity of USD 6,151.2 Million by the end of 2035.
The development of the network security firewall market is driven by various factors, like increasing demand for network security and privacy, modernization of digital transformation in the telecommunication industry, administrative regulations, and real-time streaming analysis are stimulating demand for network firewalls.
The rapid utilization of web applications, increasing adoption of cloud technologies, and growing demand for security services to reduce the risk of cyber-attacks are also driving the development of the network firewall segment.
Demand from Large Enterprises to Account for Maximum Sales
The large enterprises segment is expected to grow by 7.2X during forecast period. Along with this, the segment is anticipated to showcase a strong CAGR growth over the forthcoming years owing to rapid digitization.
In order to prevent the data and information from cyber threats and security breaches, the deployment of SD-WAN security solutions is increasing across various end–use enterprises.
SD-WAN security solutions offers smooth and secure direct connectivity to cloud providers and end points, improving the cloud experience. It offers high levels of security to businesses, protects data loss from unwanted intrusions, which increases business productivity and agility and lowers IT prices. Therefore, large enterprises are adopting network security solutions to prevent their data.
IT and Telecom Industry to Remain Primary End User
IT and Telecom industry is estimated to grow at highest CAGR of 21.9% during the forecast period. The worldwide adoption of cloud services is captivating Telecom ISVs (Independent Software Vendors) to turn to SD-WAN security solutions for simpler deployment, easier management, and faster connections.
Offering the best mixture of price, performance, and flexibility as compared to traditional, data center approaches, SD-WAN security solutions has become a captivating choice for telecom ISVs to meet the demand of today’s advanced digital businesses, it can easily and dynamically manage multiple connections types across the network, enhance application performance, flexibility, and end-user experience, and guarantee a high level of service security and quality.
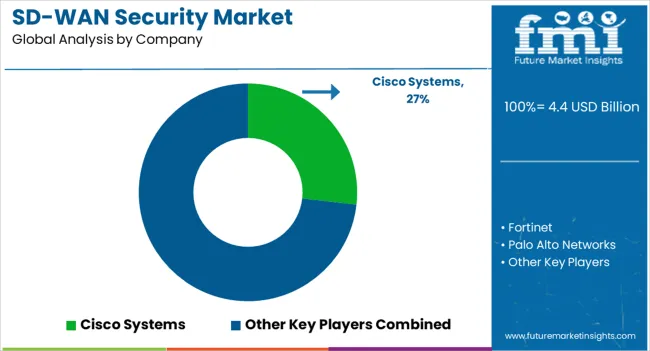
The SD-WAN security market is highly competitive. Leading players focus on innovation, integrated threat protection, and cloud-native security solutions. Cisco Systems, Fortinet, and Palo Alto Networks lead with comprehensive SD-WAN security platforms that combine AI-driven threat detection, traffic optimization, and centralized management.
Zscaler and Check Point Software Technologies provide cloud-based SD-WAN security solutions optimized for remote and distributed networks. Aryaka Networks, Forcepoint, and Sophos focus on secure, high-performance connectivity for enterprises, emphasizing ease of deployment and unified security policies.
McAfee and Juniper Networks strengthen the market with advanced firewall integration, endpoint protection, and network monitoring capabilities. Market strategies include R&D investment, strategic acquisitions, and partnerships to expand solution portfolios.
Growth depends on cloud integration, zero-trust adoption, and real-time threat prevention. Leading suppliers differentiate through scalable architectures, automated security policies, and managed SD-WAN services that meet the needs of enterprises undergoing digital transformation.
| Attribute | Details |
|---|---|
| Market value in 2025 | USD 4.4 billion |
| Market CAGR 2025 to 2035 | 21.2% |
| Share of top 5 players | Around 35% |
| Forecast Period | 2025 to 2035 |
| Historical Data Available for | 2020 to 2025 |
| Market Analysis | USD Billion for Value |
| Key Regions Covered | North America; Latin America; Europe; East Asia; South Asia & Pacific; and the Middle East & Africa |
| Key Segments Covered | Solution, Enterprise Size, Industry and Region |
| Key Companies Profiled |
Cisco Systems, Fortinet, Palo Alto Networks, Zscaler, Check Point Software Technologies, Aryaka Networks, Forcepoint, Sophos, McAfee, Juniper Networks |
| Report Coverage | Market Forecast, Company Share Analysis, Competition Intelligence, DROT Analysis, Market Dynamics and Challenges, and Strategic Growth Initiatives |
| Customization & Pricing | Available upon Request |
The global sd-wan security market is estimated to be valued at USD 4.4 billion in 2025.
The market size for the sd-wan security market is projected to reach USD 30.1 billion by 2035.
The sd-wan security market is expected to grow at a 21.2% CAGR between 2025 and 2035.
The key product types in sd-wan security market are network firewall, ddos detection and mitigation, secure web gateways, session border controller (sbc), network encryption and others.
In terms of enterprise size, small and medium-sized enterprises (smes) segment to command 54.2% share in the sd-wan security market in 2025.


Full Research Suite comprises of:
Market outlook & trends analysis
Interviews & case studies
Strategic recommendations
Vendor profiles & capabilities analysis
5-year forecasts
8 regions and 60+ country-level data splits
Market segment data splits
12 months of continuous data updates
DELIVERED AS:
PDF EXCEL ONLINE
Security Tape Market Size and Share Forecast Outlook 2025 to 2035
Security Alarm Communicator Market Size and Share Forecast Outlook 2025 to 2035
Security and Vulnerability Management Market Forecast and Outlook 2025 to 2035
Security Holograms Market Size and Share Forecast Outlook 2025 to 2035
Security Paper Market Size and Share Forecast Outlook 2025 to 2035
Security System Tester Market Size and Share Forecast Outlook 2025 to 2035
Security Advisory Services Market Size and Share Forecast Outlook 2025 to 2035
Security Room Control Market Size and Share Forecast Outlook 2025 to 2035
Security Cameras (IR Illuminator) Market Size and Share Forecast Outlook 2025 to 2035
Security Operation Centre as a Service Market Size and Share Forecast Outlook 2025 to 2035
Security Robots Market Size and Share Forecast Outlook 2025 to 2035
Security Service Edge Market Size and Share Forecast Outlook 2025 to 2035
Security and Surveillance Equipment Market Size and Share Forecast Outlook 2025 to 2035
Security Orchestration Automation and Response (SOAR) Market Size and Share Forecast Outlook 2025 to 2035
Security Bags Market Size and Share Forecast Outlook 2025 to 2035
Security Screening Market Analysis - Size, Share, and Forecast 2025 to 2035
Security Bottles Market Size and Share Forecast Outlook 2025 to 2035
Security Inspection Market Insights – Trends & Forecast 2025 to 2035
Security Labels Market Analysis by Product Type, Material, Pattern, Application, End-Use Industry, and Region Through 2035
Market Share Breakdown of Security Bags Manufacturers

Thank you!
You will receive an email from our Business Development Manager. Please be sure to check your SPAM/JUNK folder too.
Chat With
MaRIA