
- Market Size (2026)
- USD 839.2 Mn
- Forecast (2036)
- USD 1433.5 Mn
- CAGR (2026 to 2036)
- 5.5%
How big is the Sequestrants Market in 2026?
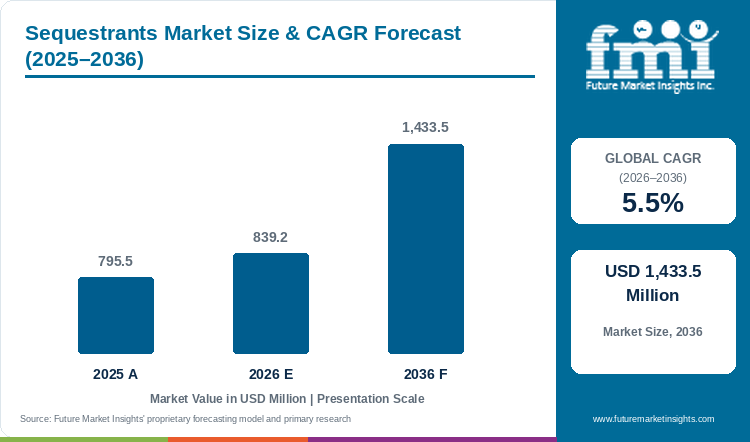
The Sequestrants Market is projected to reach USD 1,433.5 million by 2036, growing at a 5.5% CAGR from 2026 to 2036. FMI estimates the market at USD 839.2 million in 2026, after it was valued at USD 795.5 million in 2025. Demand follows the output of downstream foods, beverages, detergents and other products that use citrates [16]. Growth is steady because citrates, phosphates and gluconates are mature products priced as commodities.
Trade data show that origin sets the price a buyer pays for citric acid. China exported 1.25 million tonnes in 2024 at USD 681 per tonne [8]. Import unit values were USD 742 per tonne in India and USD 1,014 in Japan [8]. Germany paid USD 1,176 per tonne and the United States paid USD 1,800 [8][9]. China supplies 95.4% of India's imports and 88.5% of Japan's, while Canada supplies 47.5% of US imports [9]. The two buyers most tied to China pay least, while buyers with several sources pay more. German exports of citrate salts and esters averaged USD 4,464 per tonne, against USD 1,937 for citric acid [8].
Key Market Trends & Insights
- Fermentation sets the supply base. Citric acid, covered in the citric acid market, is made by fermenting a starch or sugar substrate such as corn [16]. China exported 1.25 million tonnes in 2024, against 35.2 thousand tonnes from Germany [8].
- Capacity is moving closer to buyers. Jungbunzlauer closed the purchase of a production site in Thomson, Illinois on 6 November 2025 [1]. It is the company's first US manufacturing site and will support its naturally derived ingredient portfolio [1].
- Plants are cutting energy use in evaporation. A second mechanical vapour recompression evaporator was commissioned at Port Colborne, Canada in February 2026 [2]. The operator projects CO2 savings of about 8,000 tonnes this year and about 12,000 tonnes a year from 2027 [2].
Regional Highlights
- In Europe, additives must sit on an approved positive list with set conditions of use [3]. The Scientific Committee on Food or EFSA has assessed the safety of every authorised additive [3].
- In Asia Pacific, China exported 1.25 million tonnes of citric acid in 2024 [8]. India and Japan together exported only 6.6 thousand tonnes of citric acid that year [8].
Sequestrants Market Size and Forecast
Table 1: Sequestrants Market Size and Forecast
| Market size and forecast | Value |
|---|---|
| Market size in 2025 | USD 795.5 million |
| Estimated market size in 2026 | USD 839.2 million |
| Projected market size by 2036 | USD 1,433.5 million |
| CAGR from 2026 to 2036 | 5.5% |
Source: Future Market Insights analysis of the sequestrants market, 2026.
Analyst Perspective
“Food makers buy sequestrants against specifications for purity, solubility and permitted use, and they qualify a second source before relying on one. Suppliers with fermentation or phosphate capacity close to the customer can quote shorter lead times and steadier prices, while regulatory change in phosphates and EDTA is the main risk to demand, because a lower permitted level cuts volume without changing the product.”
- Nandini Roy Choudhury, Principal Analyst at Future Market Insights
How is the Sequestrants Market segmented?
- By application: Food and Beverage, Personal Care and Cosmetics, Pharmaceuticals, Water Treatment and Detergents, Textile and Industrial.
- By chemistry: Organic acids and salts, Phosphates, Aminopolycarboxylates, Other sequestrants.
- By form: Dry (powder, granules and crystals), Liquid.
- By region: North America, Latin America, Europe, East Asia, South Asia, Oceania, Middle East and Africa.
Why does Food and Beverage lead by Application in the Sequestrants Market in 2026?
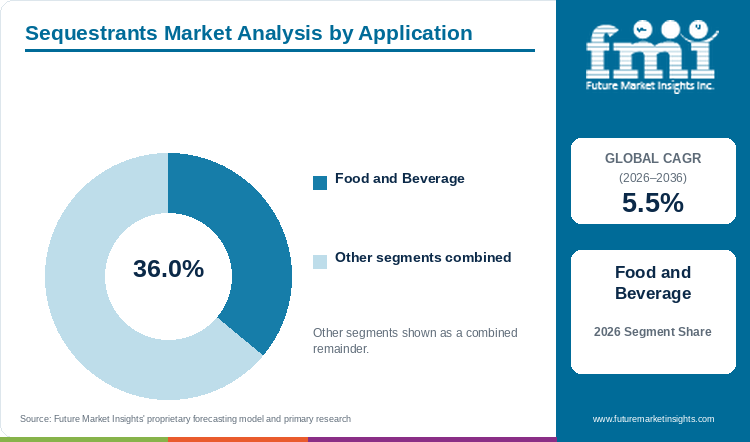
Food and Beverage holds 36.0% of the Sequestrants Market by application in 2026.
Citric acid and its salts serve food and beverage makers as well as pharmaceutical, personal care, detergent and industrial users [16]. Phosphates such as sodium tripolyphosphate regulate moisture retention in meat, dairy and seafood products [6]. All other application segments together hold the remaining 64.0% of the market. FDA lists sodium gluconate, sodium tripolyphosphate and other phosphates as sequestrants generally recognized as safe under good manufacturing practice [18].
Table 2: Application, 2026 Share
| Leading Share | 2026 market share |
|---|---|
| Food and Beverage | 36.0% |
| All Other Segments Combined Share | 64.0% |
Source: Future Market Insights analysis of the sequestrants market, 2026.
Why do Organic acids and salts lead by Chemistry in the Sequestrants Market in 2026?
Organic acids and salts hold 48.0% of the Sequestrants Market by chemistry in 2026.
This group covers citrates and gluconates made by fermentation, a category tracked in the organic acids market. China exported 1.25 million tonnes of citric acid and 318.8 thousand tonnes of its salts and esters in 2024 [8]. Phosphates, aminopolycarboxylates and other sequestrants together hold the remaining 52.0% of the market. FDA permits calcium disodium EDTA only in named foods at set limits [19]. The limit is 75 parts per million in mayonnaise and 33 in canned carbonated soft drinks [19].
Table 3: Chemistry, 2026 Share
| Leading Share | 2026 market share |
|---|---|
| Organic acids and salts | 48.0% |
| All Other Segments Combined Share | 52.0% |
Source: Future Market Insights analysis of the sequestrants market, 2026.
Why does Dry form lead in the Sequestrants Market in 2026?
Dry forms hold 76.0% of the Sequestrants Market by form in 2026.
Crystallised and powdered sequestrants keep longer than solutions and are easy to dose into dry mixes and bakery blends. Citric acid and its salts are sold as dry granular, fine and powder grades and as aqueous solutions [16]. Liquid forms hold the remaining 24.0% and suit beverage, dairy and water treatment buyers who dose through pumps.
Table 4: Form, 2026 Share
| Leading Share | 2026 market share |
|---|---|
| Dry | 76.0% |
| All Other Segments Combined Share | 24.0% |
Source: Future Market Insights analysis of the sequestrants market, 2026.
What are the key drivers, restraints and opportunities?
Driver
Processed food shelf-life needs. FDA defines sequestrants as substances that combine with polyvalent metal ions to improve the quality and stability of products [17]. Phosphates also regulate moisture retention and help prevent oxidation in meat, dairy and seafood [6].
Capacity added near customers. US buyers paid USD 1,800 per tonne for imported citric acid in 2024, while Chinese exports sold at USD 681 [8][9]. A Swiss producer bought its first US manufacturing site in Thomson, Illinois, to serve North American customers more closely [1].
Restraint
Limits on phosphate use. EFSA set a group acceptable daily intake for phosphates of 40 milligrams per kilogram of body weight per day in 2019 [20]. It estimated that exposure may exceed that level for infants, toddlers and children [20]. EU maximum levels for these additives range from 500 to 20,000 milligrams per kilogram of food, depending on food type [20]. The Commission opened a call for data in July 2023 to address issues EFSA identified [21]. Lower permitted levels would cut phosphate volume even when food output is steady.
Commodity pricing and concentrated supply. China supplied 95.4% of India's citric acid imports and 88.5% of Japan's in 2024 [9]. Chinese product entered India at USD 696 per tonne and Japan at USD 920, so both buyers follow Chinese prices [9].
Opportunity
Value in salts and esters. Citrate salts and esters earn more per tonne than the parent acid. US exports of the salts averaged USD 11,342 per tonne in 2024, against USD 2,424 for citric acid [8].
Pharmaceutical-grade supply. A Swiss citrate producer gained EXCiPACT certification for its Ladenburg site on 3 February 2026 [4]. The certificate covers five pharmaceutical excipients, including tripotassium citrate and citric acid anhydrous [4]. Certified grades let producers serve buyers in the pharmaceutical excipient market from the same chemistry as food grades.
Sequestrants Market by Country (2026 to 2036)
Table 5: Sequestrants Market Country Growth Forecast
| Country | CAGR, 2026 to 2036 |
|---|---|
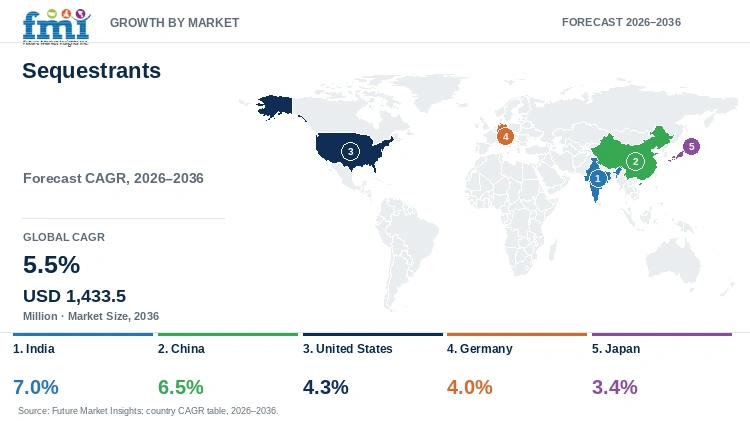
| India | 7.0% |
| China | 6.5% |
| United States | 4.3% |
| Germany | 4.0% |
| Japan | 3.4% |
Source: Future Market Insights analysis of the sequestrants market, 2026.
India
Food processing gross value added rose from INR 1.34 trillion in FY2015 to INR 2.24 trillion in FY2024 [14]. Processed food rose from 13.7% of agricultural exports in FY2015 to 20.4% in FY2025 [14]. The production-linked incentive scheme added 3.4 million tonnes a year of processing and preservation capacity by February 2026 [14]. At 7.0% from 2026 to 2036, India has the fastest projected CAGR among the profiled countries.
India imported 141.7 thousand tonnes of citric acid in 2024 and exported 6.2 thousand tonnes [8]. China supplied 95.4% of those imports at a customs value of USD 696 per tonne [9]. Sodium tripolyphosphate imports were 38.0 thousand tonnes at USD 992 per tonne, against USD 1,862 for the United States [8]. India is a net exporter of citrate salts and esters, shipping 15.9 thousand tonnes at USD 2,329 per tonne [8]. It imported 4.8 thousand tonnes of the same products at USD 2,561 per tonne [8].
Commerce's preliminary antidumping margins on Indian citric acid, issued 21 August 2026, run from 100.21% to 151.73% [10]. The higher rate applies to Daffodil Pharmachem and rests on facts available with adverse inferences [10]. On 20 August 2026 CBP found substantial evidence that this company evaded duty orders on Chinese citric acid [13]. It had entered sodium and potassium citrates made in India from Chinese-origin citric acid [13]. Final antidumping determinations are due around 8 January 2027 and will fix the margins for Indian exporters [10]. Indian citrate exporters that buy Chinese citric acid therefore face origin enforcement as well as antidumping margins [10][13].
China
China shipped 1.25 million tonnes of citric acid in 2024 at USD 681 per tonne [8]. Citrate salts and esters added 318.8 thousand tonnes at USD 876 per tonne [8]. Sodium tripolyphosphate exports reached 214.0 thousand tonnes at USD 1,073 per tonne, worth USD 229.6 million [8]. China imported 3.8 thousand tonnes of the same phosphate at USD 1,449 per tonne, worth USD 5.5 million [8]. The projected 6.5% CAGR from 2026 to 2036 rests on export volume, as China ships far more than it imports [8].
Export value reached USD 847.9 million for citric acid and USD 279.2 million for citrates [8]. Imports were only 1.9 thousand tonnes of citric acid and 0.9 thousand tonnes of citrates [8]. Those imports averaged USD 3,213 and USD 7,096 per tonne, against export prices of USD 681 and USD 876 [8]. Chinese citric acid export prices sit below every import unit value in the other four countries [8][9].
China supplies 95.4% of Indian citric acid imports and 88.5% of Japanese imports [9]. Its share is 35.0% in Germany and 3.7% in the United States [9]. Chinese material entered Germany at USD 989 per tonne and the United States at USD 975 [9]. CBP applied the duty orders on Chinese citric acid and citrate salts in an evasion case of 20 August 2026 [13].
United States
The ITC names ADM, Cargill and Primient among the US producers of citric acid and citrate salts [16]. Nonsubject imports became the leading supplier to the US market in 2024, ahead of the domestic industry [16]. Those three producers filed duty petitions on citric acid from Canada and India on 21 January 2026 [16]. A 4.3% CAGR is projected for the United States from 2026 to 2036.
The United States imported 236.1 thousand tonnes of citric acid in 2024 at USD 1,800 per tonne [8][9]. Canada supplied 47.5% and Thailand 34.3%, with Colombia at 7.2% and China at 3.7% [9]. Chinese material entered at USD 975 per tonne against USD 1,800 for Canadian supply [9]. Citrate salts and esters added 48.3 thousand tonnes at USD 2,923 per tonne [8].
Commerce set a preliminary countervailing duty rate of 16.50% on Canadian citric acid on 26 June 2026 [11]. The preliminary antidumping margin for the Canadian producer was 0.00% on 21 August 2026 [10]. The ITC will hold its hearing in the final phase of both investigations beginning 12 January 2027 [27]. A notice of 4 September 2026 lists reviews of antidumping orders on Belgian, Colombian and Thai citric acid [12]. Canada supplied 47.5% of 2024 US citric acid imports, and its final antidumping determination is due around 8 January 2027 [9][10].
Germany
The EU positive list controls which additives and uses are allowed in Germany [3]. Germany imported 148.4 thousand tonnes of citric acid in 2024 at USD 1,176 per tonne [8]. It exported 35.2 thousand tonnes at USD 1,937 per tonne, worth USD 68.1 million [8]. The 2026 to 2036 projection for Germany is a 4.0% CAGR.
Austria supplied 45.2% of German citric acid imports in 2024 and China 35.0% [9]. Together the two shipped 119.0 thousand tonnes worth USD 133.8 million [9]. Belgium supplied 10.7% at USD 1,411 per tonne and the Netherlands 3.4% at USD 1,165 [9]. Austrian material cost USD 1,229 per tonne against USD 989 for Chinese, and no origin supplies more than 45.2% [9].
Value sits in citrate salts and esters, which Germany imported at 35.7 thousand tonnes and USD 1,482 per tonne [8]. It exported 41.3 thousand tonnes at USD 4,464 per tonne, about three times the import price [8]. Export value of USD 184.4 million exceeded import value of USD 52.9 million [8]. Sodium tripolyphosphate shows a smaller spread at USD 2,371 per tonne exported and USD 1,770 imported [8]. Germany exported 3.1 thousand tonnes of that phosphate and imported 8.8 thousand tonnes [8]. Import value was USD 15.6 million against export value of USD 7.4 million [8].
Japan
Preliminary 2025 census counts show 123.05 million residents, 3.097 million or 2.5% fewer than in 2020 [15]. Households rose 2.3% to 57.1 million from 2020 and averaged 2.15 members each [15]. Japan's projected CAGR for 2026 to 2036 is 3.4%.
Japan imported 55.8 thousand tonnes of citric acid in 2024 and exported 0.4 thousand tonnes [8]. Export value was USD 2.4 million against import value of USD 56.6 million [8]. Japan's small citric acid exports earned USD 6,067 per tonne, about six times the import price [8]. China supplied 88.5% of imports at USD 920 per tonne, and Austria 6.5% at USD 1,742 [9]. Thailand supplied 4.6% at USD 1,272 per tonne, and the two minor origins together shipped 6.2 thousand tonnes [9].
Citrate salts and esters arrived at 17.1 thousand tonnes, worth USD 25.8 million, at USD 1,507 per tonne [8]. Exports of these salts were only 0.3 thousand tonnes, yet earned USD 8,102 per tonne [8]. Sodium tripolyphosphate imports of 5.1 thousand tonnes at USD 1,402 per tonne compare with exports of 0.1 thousand tonnes at USD 2,434 per tonne [8]. Japan is therefore a net importer of citric acid, its salts and sodium tripolyphosphate [8]. Its citric acid import price of USD 1,014 per tonne exceeds India's USD 742, although both buy mainly from China [8][9].
Who are the notable companies in the Sequestrants Market?
Notable companies in the Sequestrants Market include Jungbunzlauer, Cargill, Connect Chemicals, ICL and Prayon.
Raw-material access and plant location separate the suppliers of sequestrants more clearly than their product lists do. Citric acid is produced by fermenting a starch or sugar substrate, and Jungbunzlauer's Canadian plant uses corn for that purpose [16]. Jungbunzlauer serves more than 130 countries and closed the purchase of its first US manufacturing site on 6 November 2025 [1]. Its Ladenburg site gained EXCiPACT certification for five pharmaceutical excipients on 3 February 2026 [4]. Cargill is one of three US producers that ferment corn and other feedstocks such as molasses into citric acid [16]. It produces a full line of citrate ingredients and acidulants for food, beverage, health and pharmaceutical customers [26].
Phosphate suppliers differ in ownership and in how close they sit to food customers. ICL describes itself as a major global phosphate producer with a specialty portfolio of food-grade phosphates [6]. It is focused on regional production, including at a new facility in China [6]. Prayon is owned by OCP and Wallonie Entreprendre and has production sites in Belgium, France, Switzerland and the United States [7]. On 18 June 2026 Prayon signed a binding agreement for a potential acquisition of the Colombian producer HRA [7]. Closing is expected in 2027 and depends on conditions precedent and regulatory notices [7].
Connect Chemicals GmbH, headquartered in Ratingen, lists sequestrants and chelating agents in a wide specialty chemicals range [5]. It has offices on four continents, and its three Chinese plants make corrosion inhibitors, colour formers and quaternary ammonium compounds [25][22][23][24].
Key Developments in the Sequestrants Market
- On 19 February 2026 Jungbunzlauer reported that it had commissioned a second mechanical vapour recompression evaporator at Port Colborne, Canada [2]. It projects a CO2 saving of about 8,000 tonnes in 2026 and about 12,000 tonnes a year from 2027.
- On 18 June 2026 Prayon signed a binding agreement for a potential acquisition of HRA, a Colombian food ingredient producer [7]. Closing is expected in 2027, subject to conditions precedent and regulatory notices.
Key Players in the Sequestrants Market
- Jungbunzlauer Suisse AG
- Connect Chemicals GmbH
- Cargill, Incorporated
- ICL Group Ltd.
- Prayon S.A.
Sequestrants Market Report Scope
Table 6: Sequestrants Market Report Scope
| Coverage field | Report scope |
|---|---|
| Market definition | Food-grade and related sequestrants that bind metal ions, including citrates, gluconates, phosphates and EDTA salts, sold to food, beverage, personal care, pharmaceutical, water treatment and industrial buyers, valued at manufacturer selling prices. Bile acid drugs sold as finished medicines are excluded. |
| Application | Food and Beverage; Personal Care and Cosmetics; Pharmaceuticals; Water Treatment and Detergents; Textile and Industrial |
| Chemistry | Organic acids and salts; Phosphates; Aminopolycarboxylates; Other sequestrants |
| Form | Dry (powder, granules and crystals); Liquid |
| Regions and profiled countries | North America, Latin America, Europe, East Asia, South Asia, Oceania, Middle East and Africa. Profiled countries: India, China, United States, Germany, Japan |
| Companies covered | Jungbunzlauer Suisse AG; Connect Chemicals GmbH; Cargill, Incorporated; ICL Group Ltd.; Prayon S.A. |
| Quantitative Units | USD million |
Sequestrants Market by Segments
Sequestrants Market segmented by Application:
- Food and Beverage
- Personal Care and Cosmetics
- Pharmaceuticals
- Water Treatment and Detergents
- Textile and Industrial
Sequestrants Market segmented by Chemistry:
- Organic acids and salts
- Phosphates
- Aminopolycarboxylates
- Other sequestrants
Sequestrants Market segmented by Form:
- Dry (powder, granules and crystals)
- Liquid
Sequestrants Market by Region
- North America
- Latin America
- Europe
- East Asia
- South Asia
- Oceania
- Middle East
- Africa
- India
- China
- United States
- Germany
- Japan
Research Sources and Bibliography
- [1] Jungbunzlauer Suisse AG. (2025, November 6). Jungbunzlauer closes acquisition of Illinois facility to launch U.S. manufacturing operations. https://www.jungbunzlauer.com/news/jungbunzlauer-closes-acquisition-of-illinois-facility-to-launch-u-s-manufacturing-operations/
- [2] Jungbunzlauer Suisse AG. (2026, February 19). Second MVR evaporator strengthens energy efficiency at Port Colborne site. https://www.jungbunzlauer.com/news/second-mvr-evaporator-strengthens-energy-efficiency-at-port-colborne-site/
- [3] European Commission, Food Safety. Food additives. https://food.ec.europa.eu/food-safety/food-improvement-agents/additives_en
- [4] Jungbunzlauer Suisse AG. (2026, February 3). Ladenburg site achieves EXCiPACT certification for five pharmaceutical excipients. https://www.jungbunzlauer.com/news/ladenburg-site-achieves-excipact-certification-for-five-pharmaceutical-excipients/
- [5] Connect Chemicals GmbH. Company website. https://www.connectchemicals.com/
- [6] ICL Group Ltd. (2025, September 18). The Role of Specialty Phosphates in a More Sustainable Food System. https://www.icl-group.com/blog/specialty-phosphates-sustainable-food-system/
- [7] Prayon S.A. (2026, June 18). Prayon announces plans to acquire HRA. https://www.prayon.com/en/news/prayon-announces-plans-to-acquire-hra/
- [8] United Nations Statistics Division. (2026, November 5). UN Comtrade database, 2024 annual trade in HS 291814, 291815 and 283531 for China, Germany, Japan, India and the United States (queried 5 November 2026). https://comtradeapi.un.org/public/v1/preview/C/A/HS?reporterCode=156,276,392,699,842&period=2024&cmdCode=291814,291815,283531&flowCode=M,X&partnerCode=0&partner2Code=0&customsCode=C00&motCode=0&includeDesc=true
- [9] United Nations Statistics Division. (2026, November 5). UN Comtrade database, 2024 citric acid imports by partner country for Germany, Japan, India and the United States (queried 5 November 2026). https://comtradeapi.un.org/public/v1/preview/C/A/HS?reporterCode=276,392,699,842&period=2024&cmdCode=291814&flowCode=M&partner2Code=0&customsCode=C00&motCode=0&includeDesc=true
- [10] U.S. Department of Commerce, International Trade Administration. (2026, August 21). Preliminary Determination in the Antidumping Duty Investigations of Citric Acid from Canada and India. https://www.trade.gov/preliminary-determination-antidumping-duty-investigations-citric-acid-canada-and-india
- [11] U.S. Department of Commerce, International Trade Administration. (2026, June 26). Citric Acid and Certain Citrate Salts from Canada: Preliminary Affirmative Countervailing Duty Determination. Federal Register 91 FR 38666. https://www.federalregister.gov/documents/2026/06/26/2026-12962/citric-acid-and-certain-citrate-salts-from-canada-preliminary-affirmative-countervailing-duty
- [12] U.S. Department of Commerce, International Trade Administration. (2026, September 4). Initiation of Antidumping and Countervailing Duty Administrative Reviews. Federal Register. https://www.federalregister.gov/documents/2026/09/04/2026-18185/initiation-of-antidumping-and-countervailing-duty-administrative-reviews
- [13] U.S. Customs and Border Protection. (2026, August 28). EAPA Case 8224: Citric Acid and Certain Citrate Salts, Notice of Determination as to Evasion dated August 20, 2026. https://www.cbp.gov/document/publications/eapa-case-8224-citric-acid-and-certain-citrate-salts-caccs-notice
- [14] Press Information Bureau, Government of India. (2026, April 21). Strengthening India's Food Processing Ecosystem. https://www.pib.gov.in/PressReleasePage.aspx?PRID=2254015®=3&lang=2
- [15] Statistics Bureau of Japan. (2026, June 25). News Bulletin June 25, 2026, No. 380: Preliminary Counts of the 2025 Population Census of Japan. https://www.stat.go.jp/english/info/news/20260625.html
- [16] U.S. International Trade Commission. (2026, March). Citric Acid and Certain Citrate Salts from Canada and India, Investigation Nos. 701-TA-783-784 and 731-TA-1771-1772 (Preliminary), Publication 5716. https://www.usitc.gov/sites/default/files/publications/701_731/pub5716.pdf
- [17] U.S. Food and Drug Administration. (2026, November 3). 21 CFR 170.3 Definitions, paragraph (o)(26) sequestrants. Electronic Code of Federal Regulations. https://www.ecfr.gov/current/title-21/chapter-I/subchapter-B/part-170/subpart-A/section-170.3
- [18] U.S. Food and Drug Administration. (2026, November 3). 21 CFR Part 182 Subpart G, Sequestrants. Electronic Code of Federal Regulations. https://www.ecfr.gov/current/title-21/chapter-I/subchapter-B/part-182/subpart-G
- [19] U.S. Food and Drug Administration. (2026, November 3). 21 CFR 172.120 Calcium disodium EDTA. Electronic Code of Federal Regulations. https://www.ecfr.gov/current/title-21/chapter-I/subchapter-B/part-172/subpart-B/section-172.120
- [20] European Food Safety Authority. (2019, June 12). EFSA issues new advice on phosphates. https://www.efsa.europa.eu/en/press/news/190612
- [21] European Commission, Directorate-General for Health and Food Safety. (2023, July 7). Food additives: EC publishes call for data on the permitted food additives phosphoric acid, phosphates, di-, tri- and polyphosphates. https://food.ec.europa.eu/food-safety-news/food-additives-ec-publishes-call-data-permitted-food-additives-phosphoric-acid-phosphates-di-tri-and-2023-07-07_en
- [22] Connect Chemicals GmbH. Production site in Nantong, Nantong Botao Chemical. https://connectchemicals.com/en/production/nantong
- [23] Connect Chemicals GmbH. Production site in Penglai, Connect (Shandong) Chemicals. https://connectchemicals.com/en/production/penglai
- [24] Connect Chemicals GmbH. Production plant in LinYi, LinYi Connect Chemical Technology. https://connectchemicals.com/en/production/linyi
- [25] Connect Chemicals GmbH. Our story, group offices. https://connectchemicals.com/en/about-us/our-history
- [26] Cargill, Incorporated. Bulk acidulants and citrates supplier in the US. https://www.cargill.com/food-beverage/na/acidulants
- [27] U.S. International Trade Commission. (2026, September 11). Citric Acid and Certain Citrate Salts From Canada and India: Scheduling of the Final Phase of Antidumping and Countervailing Duty Investigations. Federal Register. https://www.federalregister.gov/documents/2026/09/11/2026-18586/citric-acid-and-certain-citrate-salts-from-canada-and-india-scheduling-of-the-final-phase-of
Table of Content
Table of Content
- Key Takeaways
- Market Size and CAGR
- Top Growth Driver
- Fastest Growing Segment
- Leading Region
- Key Companies
- Emerging Opportunities
- Executive Summary
- Global Market Outlook
- Demand-side Trends
- Supply-side Trends
- Technology Roadmap Analysis
- Analysis and Recommendations
- Analyst Perspective (What is happening? Why now? What should investors know?)
- Key Questions Answered
- How large is the market?
- What is the CAGR?
- What are key trends?
- Which region dominates?
- Who are the leaders?
Read More...
- Market Overview
- Market Coverage / Taxonomy
- Market Definition / Scope / Limitations
- Research Methodology
- Chapter Orientation
- Analytical Lens and Working Hypotheses
- Market Structure, Signals, and Trend Drivers
- Benchmarking and Cross-market Comparability
- Market Sizing, Forecasting, and Opportunity Mapping
- Research Design and Evidence Framework
- Desk Research Programme (Secondary Evidence)
- Expert Input and Fieldwork (Primary Evidence)
- Tooling, Models, and Reference Databases
- Data Engineering and Model Build
- Quality Assurance and Audit Trail
- Market Background
- Market Dynamics (Drivers, Restraints, Opportunity, Trends)
- Scenario Forecast (Optimistic, Likely, Conservative)
- Impact Analysis
- AI Impact
- Sustainability Impact
- Regulatory Impact
- Technology Impact
- Consumer / Buyer Analysis
- Purchase Drivers
- Adoption Barriers
- Buyer Journey
- Opportunity Map Analysis
- Product Life Cycle Analysis
- Supply Chain Analysis
- Investment Feasibility Matrix
- Value Chain Analysis
- PESTLE and Porter's Analysis
- Regulatory Landscape
- Regional Parent Market Outlook
- Production and Consumption Statistics
- Import and Export Statistics
- Global Market Analysis and Forecast, 2021 to 2036
- Historical Market Size Value (USD Million) Analysis, 2021 to 2025
- Current and Future Market Size Value (USD Million) Projections, 2026 to 2036
- Y-o-Y Growth Trend Analysis
- Absolute $ Opportunity Analysis
- Global Market Pricing Analysis, 2021 to 2036
- Global Market Analysis and Forecast, By Application, 2021 to 2036
- Introduction / Key Findings
- Historical Market Size Value (USD Million) Analysis By Application, 2021 to 2025
- Current and Future Market Size Value (USD Million) Analysis and Forecast By Application, 2026 to 2036
- Food and Beverage
- Personal Care and Cosmetics
- Pharmaceuticals
- Water Treatment and Detergents
- Textile and Industrial
- Y-o-Y Growth Trend Analysis By Application, 2021 to 2025
- Absolute $ Opportunity Analysis By Application, 2026 to 2036
- Global Market Analysis and Forecast, By Chemistry, 2021 to 2036
- Introduction / Key Findings
- Historical Market Size Value (USD Million) Analysis By Chemistry, 2021 to 2025
- Current and Future Market Size Value (USD Million) Analysis and Forecast By Chemistry, 2026 to 2036
- Organic acids and salts
- Phosphates
- Aminopolycarboxylates
- Other sequestrants
- Y-o-Y Growth Trend Analysis By Chemistry, 2021 to 2025
- Absolute $ Opportunity Analysis By Chemistry, 2026 to 2036
- Global Market Analysis and Forecast, By Form, 2021 to 2036
- Introduction / Key Findings
- Historical Market Size Value (USD Million) Analysis By Form, 2021 to 2025
- Current and Future Market Size Value (USD Million) Analysis and Forecast By Form, 2026 to 2036
- Dry (powder, granules and crystals)
- Liquid
- Y-o-Y Growth Trend Analysis By Form, 2021 to 2025
- Absolute $ Opportunity Analysis By Form, 2026 to 2036
- Global Market Analysis and Forecast, By Region, 2021 to 2036
- Introduction
- Historical Market Size Value (USD Million) Analysis By Region, 2021 to 2025
- Current Market Size Value (USD Million) Analysis and Forecast By Region, 2026 to 2036
- North America
- Latin America
- Europe
- East Asia
- South Asia
- Oceania
- Middle East
- Africa
- Market Attractiveness Analysis By Region
- North America Market Analysis and Forecast, By Country, 2021 to 2036
- Historical Market Size Value (USD Million) Trend Analysis By Market Taxonomy, 2021 to 2025
- Market Size Value (USD Million) Forecast By Market Taxonomy, 2026 to 2036
- By Country
- By Application
- By Chemistry
- By Form
- Market Attractiveness Analysis
- By Country
- By Application
- By Chemistry
- By Form
- Key Takeaways
- Latin America Market Analysis and Forecast, By Country
- Historical Market Size Value (USD Million) Trend Analysis By Market Taxonomy, 2021 to 2025
- Market Size Value (USD Million) Forecast By Market Taxonomy, 2026 to 2036
- By Country
- By Application
- By Chemistry
- By Form
- Market Attractiveness Analysis
- By Country
- By Application
- By Chemistry
- By Form
- Key Takeaways
- Europe Market Analysis and Forecast, By Country
- Historical Market Size Value (USD Million) Trend Analysis By Market Taxonomy, 2021 to 2025
- Market Size Value (USD Million) Forecast By Market Taxonomy, 2026 to 2036
- By Country
- By Application
- By Chemistry
- By Form
- Market Attractiveness Analysis
- By Country
- By Application
- By Chemistry
- By Form
- Key Takeaways
- East Asia Market Analysis and Forecast, By Country
- Historical Market Size Value (USD Million) Trend Analysis By Market Taxonomy, 2021 to 2025
- Market Size Value (USD Million) Forecast By Market Taxonomy, 2026 to 2036
- By Country
- By Application
- By Chemistry
- By Form
- Market Attractiveness Analysis
- By Country
- By Application
- By Chemistry
- By Form
- Key Takeaways
- South Asia Market Analysis and Forecast, By Country
- Historical Market Size Value (USD Million) Trend Analysis By Market Taxonomy, 2021 to 2025
- Market Size Value (USD Million) Forecast By Market Taxonomy, 2026 to 2036
- By Country
- By Application
- By Chemistry
- By Form
- Market Attractiveness Analysis
- By Country
- By Application
- By Chemistry
- By Form
- Key Takeaways
- Oceania Market Analysis and Forecast, By Country
- Historical Market Size Value (USD Million) Trend Analysis By Market Taxonomy, 2021 to 2025
- Market Size Value (USD Million) Forecast By Market Taxonomy, 2026 to 2036
- By Country
- By Application
- By Chemistry
- By Form
- Market Attractiveness Analysis
- By Country
- By Application
- By Chemistry
- By Form
- Key Takeaways
- Middle East Market Analysis and Forecast, By Country
- Historical Market Size Value (USD Million) Trend Analysis By Market Taxonomy, 2021 to 2025
- Market Size Value (USD Million) Forecast By Market Taxonomy, 2026 to 2036
- By Country
- By Application
- By Chemistry
- By Form
- Market Attractiveness Analysis
- By Country
- By Application
- By Chemistry
- By Form
- Key Takeaways
- Africa Market Analysis and Forecast, By Country
- Historical Market Size Value (USD Million) Trend Analysis By Market Taxonomy, 2021 to 2025
- Market Size Value (USD Million) Forecast By Market Taxonomy, 2026 to 2036
- By Country
- India
- China
- United States
- Germany
- Japan
- By Application
- By Chemistry
- By Form
- By Country
- Market Attractiveness Analysis
- By Country
- By Application
- By Chemistry
- By Form
- Key Takeaways
- Key Countries Market Analysis
- United States
- Pricing Analysis
- Market Share Analysis, 2025
- By Application
- By Chemistry
- By Form
- Germany
- Pricing Analysis
- Market Share Analysis, 2025
- By Application
- By Chemistry
- By Form
- India
- Pricing Analysis
- Market Share Analysis, 2025
- By Application
- By Chemistry
- By Form
- China
- Pricing Analysis
- Market Share Analysis, 2025
- By Application
- By Chemistry
- By Form
- Japan
- Pricing Analysis
- Market Share Analysis, 2025
- By Application
- By Chemistry
- By Form
- United States
- Market Structure Analysis
- Competition Dashboard
- Competition Benchmarking
- Market Share Analysis of Top Players
- By Regional
- By Application
- By Chemistry
- By Form
- Emerging Startups
- Innovation Benchmarking
- Competition Analysis
- Competition Deep Dive
- Jungbunzlauer Suisse AG
- Overview
- Product Portfolio
- Profitability by Market Segments
- Sales Footprint
- Strategy Overview
- Marketing Strategy
- Product Strategy
- Channel Strategy
- Connect Chemicals GmbH
- Cargill, Incorporated
- ICL Group Ltd.
- Prayon S.A.
- Jungbunzlauer Suisse AG
- Case Studies
- Success Stories
- Recent Developments
- Competition Deep Dive
- Assumptions & Acronyms Used
List of Tables
- Table 1: Global Market Value (USD Million) Forecast by Region, 2021 to 2036
- Table 2: Global Market Value (USD Million) Forecast by Application, 2021 to 2036
- Table 3: Global Market Value (USD Million) Forecast by Chemistry, 2021 to 2036
- Table 4: Global Market Value (USD Million) Forecast by Form, 2021 to 2036
- Table 5: North America Market Value (USD Million) Forecast by Country, 2021 to 2036
- Table 6: North America Market Value (USD Million) Forecast by Application, 2021 to 2036
- Table 7: North America Market Value (USD Million) Forecast by Chemistry, 2021 to 2036
- Table 8: North America Market Value (USD Million) Forecast by Form, 2021 to 2036
- Table 9: Latin America Market Value (USD Million) Forecast by Country, 2021 to 2036
- Table 10: Latin America Market Value (USD Million) Forecast by Application, 2021 to 2036
- Table 11: Latin America Market Value (USD Million) Forecast by Chemistry, 2021 to 2036
- Table 12: Latin America Market Value (USD Million) Forecast by Form, 2021 to 2036
- Table 13: Europe Market Value (USD Million) Forecast by Country, 2021 to 2036
- Table 14: Europe Market Value (USD Million) Forecast by Application, 2021 to 2036
- Table 15: Europe Market Value (USD Million) Forecast by Chemistry, 2021 to 2036
- Table 16: Europe Market Value (USD Million) Forecast by Form, 2021 to 2036
- Table 17: East Asia Market Value (USD Million) Forecast by Country, 2021 to 2036
- Table 18: East Asia Market Value (USD Million) Forecast by Application, 2021 to 2036
- Table 19: East Asia Market Value (USD Million) Forecast by Chemistry, 2021 to 2036
- Table 20: East Asia Market Value (USD Million) Forecast by Form, 2021 to 2036
- Table 21: South Asia Market Value (USD Million) Forecast by Country, 2021 to 2036
- Table 22: South Asia Market Value (USD Million) Forecast by Application, 2021 to 2036
- Table 23: South Asia Market Value (USD Million) Forecast by Chemistry, 2021 to 2036
- Table 24: South Asia Market Value (USD Million) Forecast by Form, 2021 to 2036
- Table 25: Oceania Market Value (USD Million) Forecast by Country, 2021 to 2036
- Table 26: Oceania Market Value (USD Million) Forecast by Application, 2021 to 2036
- Table 27: Oceania Market Value (USD Million) Forecast by Chemistry, 2021 to 2036
- Table 28: Oceania Market Value (USD Million) Forecast by Form, 2021 to 2036
- Table 29: Middle East Market Value (USD Million) Forecast by Country, 2021 to 2036
- Table 30: Middle East Market Value (USD Million) Forecast by Application, 2021 to 2036
- Table 31: Middle East Market Value (USD Million) Forecast by Chemistry, 2021 to 2036
- Table 32: Middle East Market Value (USD Million) Forecast by Form, 2021 to 2036
- Table 33: Africa Market Value (USD Million) Forecast by Country, 2021 to 2036
- Table 34: Africa Market Value (USD Million) Forecast by Application, 2021 to 2036
- Table 35: Africa Market Value (USD Million) Forecast by Chemistry, 2021 to 2036
- Table 36: Africa Market Value (USD Million) Forecast by Form, 2021 to 2036
List of Figures
- Figure 1: Global Market Pricing Analysis
- Figure 2: Global Market Value (USD Million) Forecast 2021-2036
- Figure 3: Global Market Value Share and BPS Analysis by Application, 2026 and 2036
- Figure 4: Global Market Y-o-Y Growth Comparison by Application, 2026-2036
- Figure 5: Global Market Attractiveness Analysis by Application
- Figure 6: Global Market Value Share and BPS Analysis by Chemistry, 2026 and 2036
- Figure 7: Global Market Y-o-Y Growth Comparison by Chemistry, 2026-2036
- Figure 8: Global Market Attractiveness Analysis by Chemistry
- Figure 9: Global Market Value Share and BPS Analysis by Form, 2026 and 2036
- Figure 10: Global Market Y-o-Y Growth Comparison by Form, 2026-2036
- Figure 11: Global Market Attractiveness Analysis by Form
- Figure 12: Global Market Value (USD Million) Share and BPS Analysis by Region, 2026 and 2036
- Figure 13: Global Market Y-o-Y Growth Comparison by Region, 2026-2036
- Figure 14: Global Market Attractiveness Analysis by Region
- Figure 15: North America Market Incremental Dollar Opportunity, 2026-2036
- Figure 16: Latin America Market Incremental Dollar Opportunity, 2026-2036
- Figure 17: Europe Market Incremental Dollar Opportunity, 2026-2036
- Figure 18: East Asia Market Incremental Dollar Opportunity, 2026-2036
- Figure 19: South Asia Market Incremental Dollar Opportunity, 2026-2036
- Figure 20: Oceania Market Incremental Dollar Opportunity, 2026-2036
- Figure 21: Middle East Market Incremental Dollar Opportunity, 2026-2036
- Figure 22: Africa Market Incremental Dollar Opportunity, 2026-2036
- Figure 23: North America Market Value Share and BPS Analysis by Country, 2026 and 2036
- Figure 24: North America Market Value Share and BPS Analysis by Application, 2026 and 2036
- Figure 25: North America Market Y-o-Y Growth Comparison by Application, 2026-2036
- Figure 26: North America Market Attractiveness Analysis by Application
- Figure 27: North America Market Value Share and BPS Analysis by Chemistry, 2026 and 2036
- Figure 28: North America Market Y-o-Y Growth Comparison by Chemistry, 2026-2036
- Figure 29: North America Market Attractiveness Analysis by Chemistry
- Figure 30: North America Market Value Share and BPS Analysis by Form, 2026 and 2036
- Figure 31: North America Market Y-o-Y Growth Comparison by Form, 2026-2036
- Figure 32: North America Market Attractiveness Analysis by Form
- Figure 33: Latin America Market Value Share and BPS Analysis by Country, 2026 and 2036
- Figure 34: Latin America Market Value Share and BPS Analysis by Application, 2026 and 2036
- Figure 35: Latin America Market Y-o-Y Growth Comparison by Application, 2026-2036
- Figure 36: Latin America Market Attractiveness Analysis by Application
- Figure 37: Latin America Market Value Share and BPS Analysis by Chemistry, 2026 and 2036
- Figure 38: Latin America Market Y-o-Y Growth Comparison by Chemistry, 2026-2036
- Figure 39: Latin America Market Attractiveness Analysis by Chemistry
- Figure 40: Latin America Market Value Share and BPS Analysis by Form, 2026 and 2036
- Figure 41: Latin America Market Y-o-Y Growth Comparison by Form, 2026-2036
- Figure 42: Latin America Market Attractiveness Analysis by Form
- Figure 43: Europe Market Value Share and BPS Analysis by Country, 2026 and 2036
- Figure 44: Europe Market Value Share and BPS Analysis by Application, 2026 and 2036
- Figure 45: Europe Market Y-o-Y Growth Comparison by Application, 2026-2036
- Figure 46: Europe Market Attractiveness Analysis by Application
- Figure 47: Europe Market Value Share and BPS Analysis by Chemistry, 2026 and 2036
- Figure 48: Europe Market Y-o-Y Growth Comparison by Chemistry, 2026-2036
- Figure 49: Europe Market Attractiveness Analysis by Chemistry
- Figure 50: Europe Market Value Share and BPS Analysis by Form, 2026 and 2036
- Figure 51: Europe Market Y-o-Y Growth Comparison by Form, 2026-2036
- Figure 52: Europe Market Attractiveness Analysis by Form
- Figure 53: East Asia Market Value Share and BPS Analysis by Country, 2026 and 2036
- Figure 54: East Asia Market Value Share and BPS Analysis by Application, 2026 and 2036
- Figure 55: East Asia Market Y-o-Y Growth Comparison by Application, 2026-2036
- Figure 56: East Asia Market Attractiveness Analysis by Application
- Figure 57: East Asia Market Value Share and BPS Analysis by Chemistry, 2026 and 2036
- Figure 58: East Asia Market Y-o-Y Growth Comparison by Chemistry, 2026-2036
- Figure 59: East Asia Market Attractiveness Analysis by Chemistry
- Figure 60: East Asia Market Value Share and BPS Analysis by Form, 2026 and 2036
- Figure 61: East Asia Market Y-o-Y Growth Comparison by Form, 2026-2036
- Figure 62: East Asia Market Attractiveness Analysis by Form
- Figure 63: South Asia Market Value Share and BPS Analysis by Country, 2026 and 2036
- Figure 64: South Asia Market Value Share and BPS Analysis by Application, 2026 and 2036
- Figure 65: South Asia Market Y-o-Y Growth Comparison by Application, 2026-2036
- Figure 66: South Asia Market Attractiveness Analysis by Application
- Figure 67: South Asia Market Value Share and BPS Analysis by Chemistry, 2026 and 2036
- Figure 68: South Asia Market Y-o-Y Growth Comparison by Chemistry, 2026-2036
- Figure 69: South Asia Market Attractiveness Analysis by Chemistry
- Figure 70: South Asia Market Value Share and BPS Analysis by Form, 2026 and 2036
- Figure 71: South Asia Market Y-o-Y Growth Comparison by Form, 2026-2036
- Figure 72: South Asia Market Attractiveness Analysis by Form
- Figure 73: Oceania Market Value Share and BPS Analysis by Country, 2026 and 2036
- Figure 74: Oceania Market Value Share and BPS Analysis by Application, 2026 and 2036
- Figure 75: Oceania Market Y-o-Y Growth Comparison by Application, 2026-2036
- Figure 76: Oceania Market Attractiveness Analysis by Application
- Figure 77: Oceania Market Value Share and BPS Analysis by Chemistry, 2026 and 2036
- Figure 78: Oceania Market Y-o-Y Growth Comparison by Chemistry, 2026-2036
- Figure 79: Oceania Market Attractiveness Analysis by Chemistry
- Figure 80: Oceania Market Value Share and BPS Analysis by Form, 2026 and 2036
- Figure 81: Oceania Market Y-o-Y Growth Comparison by Form, 2026-2036
- Figure 82: Oceania Market Attractiveness Analysis by Form
- Figure 83: Middle East Market Value Share and BPS Analysis by Country, 2026 and 2036
- Figure 84: Middle East Market Value Share and BPS Analysis by Application, 2026 and 2036
- Figure 85: Middle East Market Y-o-Y Growth Comparison by Application, 2026-2036
- Figure 86: Middle East Market Attractiveness Analysis by Application
- Figure 87: Middle East Market Value Share and BPS Analysis by Chemistry, 2026 and 2036
- Figure 88: Middle East Market Y-o-Y Growth Comparison by Chemistry, 2026-2036
- Figure 89: Middle East Market Attractiveness Analysis by Chemistry
- Figure 90: Middle East Market Value Share and BPS Analysis by Form, 2026 and 2036
- Figure 91: Middle East Market Y-o-Y Growth Comparison by Form, 2026-2036
- Figure 92: Middle East Market Attractiveness Analysis by Form
- Figure 93: Africa Market Value Share and BPS Analysis by Country, 2026 and 2036
- Figure 94: Africa Market Value Share and BPS Analysis by Application, 2026 and 2036
- Figure 95: Africa Market Y-o-Y Growth Comparison by Application, 2026-2036
- Figure 96: Africa Market Attractiveness Analysis by Application
- Figure 97: Africa Market Value Share and BPS Analysis by Chemistry, 2026 and 2036
- Figure 98: Africa Market Y-o-Y Growth Comparison by Chemistry, 2026-2036
- Figure 99: Africa Market Attractiveness Analysis by Chemistry
- Figure 100: Africa Market Value Share and BPS Analysis by Form, 2026 and 2036
- Figure 101: Africa Market Y-o-Y Growth Comparison by Form, 2026-2036
- Figure 102: Africa Market Attractiveness Analysis by Form
- Figure 103: Global Market - Tier Structure Analysis
- Figure 104: Global Market - Company Share Analysis
Frequently Asked Questions
How big is the sequestrants market in 2026?
FMI estimates the market at USD 839.2 million in 2026, up from USD 795.5 million in 2025. It is forecast to reach USD 1,433.5 million by 2036 at a 5.5% CAGR.
Which application leads the sequestrants market in 2026?
Food and Beverage leads by application with 36.0% in 2026. Personal care, pharmaceuticals, water treatment and detergents, and textile and industrial uses together hold 64.0%.
Which chemistry and form lead?
Organic acids and salts hold 48.0% by chemistry and dry forms hold 76.0% by form in FMI's 2026 assessment.
Which country is forecast to grow fastest through 2036?
India has the highest forecast CAGR among the profiled countries at 7.0% during 2026 to 2036, followed by China at 6.5%.
What is a sequestrant?
FDA defines sequestrants as substances that combine with polyvalent metal ions to improve the quality and stability of products [17]. FDA lists sodium gluconate and sodium tripolyphosphate as sequestrants and permits calcium disodium EDTA in named foods [18][19].
Which companies are covered in the sequestrants market?
The sequestrants market report profiles Jungbunzlauer, Cargill, Connect Chemicals, ICL Group and Prayon.
Preview the report firsthand - request a free sample
Get SampleGet the brochure for pricing and purchase details.
Get PDF
