
- Market Size (2026)
- USD 1.3 Bn
- Forecast (2036)
- USD 2.7 Bn
- CAGR (2026 to 2036)
- 7.3%
How big is the Shunt Capacitor Market in 2026?
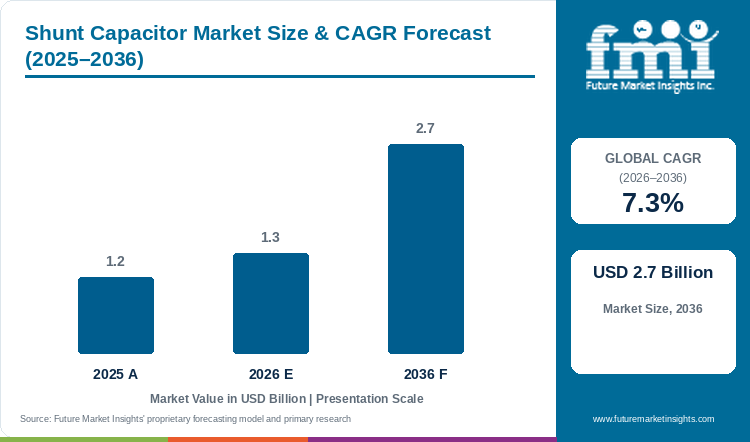
The Shunt Capacitor Market is projected to reach USD 2.7 billion by 2036, growing at a 7.3% CAGR from 2026 to 2036. The market is estimated at USD 1.3 billion in 2026. The market was valued at USD 1.2 billion in 2025.
Shunt Capacitor Market Size and Forecast
Table 1: Shunt Capacitor Market Size and Forecast
| Market size and forecast | Value |
|---|---|
| Market size in 2025 | USD 1.2 billion |
| Estimated market size in 2026 | USD 1.3 billion |
| Projected market size by 2036 | USD 2.7 billion |
| CAGR from 2026 to 2036 | 7.3% |
Source: Future Market Insights analysis of the shunt capacitor market, 2026.
Grid reinforcement ahead of peak load is the nearest demand signal. On 30 April 2026 EVNNPT energised shunt capacitor banks at 16 substations of 220 to 500 kV in northern Vietnam. The project, titled 'Installation of additional 110kV shunt capacitor banks on the Northern transmission grid in 2026', finished on schedule. The work improved supply capacity and system stability before the summer peak. New generation is the larger pull. China's National Energy Administration reported total power generation capacity of 4,130 GW at the end of September 2026, up 11.2% on the year. Wind and solar together passed 2,000 GW. Equipment makers are seeing the same demand. GE Vernova reported third-quarter 2026 revenue of USD 12.6 billion, up 27%, led by Power and Electrification.
Reactive power demand sets the need for shunt capacitors. Hitachi Energy describes shunt capacitor banks as primarily used to improve power factor. Further benefits are voltage stability, lower network losses and higher power transfer. Standards also shape what gets specified. IEC 60871-1, fourth edition, was published on 22 May 2014. It covers capacitor units and banks for AC systems above 1,000 V at 15 to 60 Hz, including power filter circuits. GE Vernova says its power capacitors meet ANSI, IEEE and IEC standards, and its low-voltage units hold UL approval. IEEE 18-2025 was approved on 4 November 2025 and published on 27 March 2026. It replaced the 2012 edition and covers shunt power capacitors rated 216 V or higher and 2.5 kVAR or more. The alternative to switched banks is covered in the static var compensator market.
Key Market Trends & Insights
- On 28 October 2026 GE Vernova agreed to acquire Trench Group for USD 9.0 billion at closing. Trench makes bushings, instrument transformers, coils, cable terminations and capacitors. Completion is expected in late 2027, subject to regulatory approvals.
- IEEE 18-2025 was published on 27 March 2026 as the current IEEE Standard for Shunt Power Capacitors, after board approval on 4 November 2025. It superseded IEEE 18-2012. The IEC listing for IEC 60871-1:2014, a fourth edition that replaced the 2005 edition, shows a stability date of 2026.
- Battery storage is now added alongside solar on the same networks. The US Energy Information Administration reported on 30 October 2026 that over 16% of new utility-scale solar capacity added in 2026 is co-located with operable battery storage. It said the share could reach 19% for the year.
Regional Highlights
- Asia Pacific: China's total power generation capacity reached 4,130 GW at the end of September 2026. POWERGRID charged a 765 kV pooling station and line in India on 31 July 2026. EVNNPT energised capacitor banks at 16 Vietnamese substations on 30 April 2026.
- North America: PJM, ERCOT and SPP all set summer 2026 peak load records. PJM reached 162.6 GW on 2 July 2026.
- Europe: the Bundesnetzagentur opened a consultation on draft scenario frameworks for 2040 and 2045 on 31 August 2026. NESO has two workgroup meetings on revising the Obligatory Reactive Power Service, scheduled for 18 November and 15 December 2026.
Analyst Perspective
“Shunt capacitors are a low-cost answer to a problem that grows with every new generator and every higher peak. Most of the volume sits in low and medium voltage, where industrial plants correct power factor. The visible contracts sit in high-voltage substations. Buyers should read supplier ranges against the standard each tender cites. They should also ask who will own the capacitor line when a multi-year order is delivered, given the Trench Group deal. Over the next five years, the most useful signals are utility peak-load records and the pace of wind, solar and storage additions. Also watch how quickly suppliers publish ratings for the highest voltage classes.”
- Nikhil Kaitwade, Principal Consultant, FMI
How is the Shunt Capacitor Market segmented?
- By voltage rating: Low & Medium and High
- By application: Process Industries, Utility, Discrete Manufacturing and Commercial & Others
- By region: North America, Europe and Asia Pacific
Why does Low & Medium lead by Voltage Rating in the Shunt Capacitor Market in 2026?
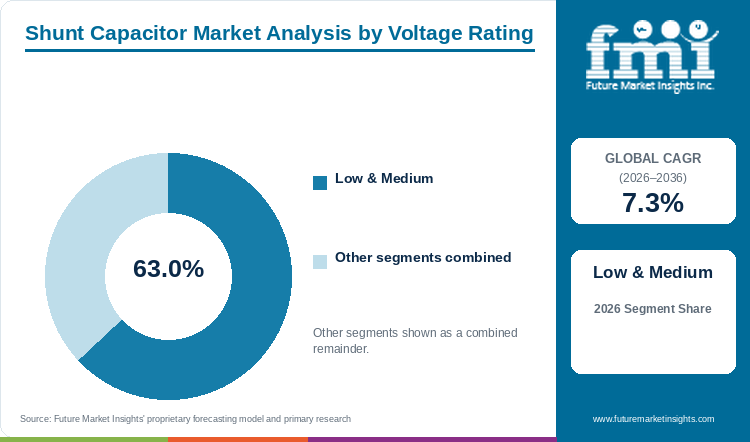
Low & Medium accounts for 63.0% of the Shunt Capacitor Market by voltage rating in 2026. Supplier catalogues show the deepest product range at lower voltages. Hitachi Energy lists metal-enclosed capacitor banks from 1 to 36 kV that hold a preset power factor [14]. Magnewin lists 440 V low-voltage film-foil capacitors alongside medium- and high-voltage shunt capacitors up to 132 kV [15]. Ducati Energia and Arteche each list low-voltage lines next to medium- and high-voltage ones [18][17]. CIRCUTOR lists low- and medium-voltage capacitor banks and a stock service for immediate delivery [16]. Standards draw the same line. IEEE 18-2025 starts at 216 V and 2.5 kVAR [20]. IEC 60871-1 is written for systems above 1,000 V [19], so one product family is bought under two documents. High voltage holds 37.0% of the market on fewer but larger orders. Hitachi Energy offers its open-rack QBank at 1 to 765 kV in internally fused form. The fuseless form covers 35 to 765 kV, from 0.1 to 600 Mvar [12]. GE Vernova gives its capacitors a range of 1 kvar to 500 MVAR and 240 V to 500 kV [8].
Table 2: Voltage Rating, 2026 Share
| Leading Share | 2026 market share |
|---|---|
| Low & Medium | 63.0% |
| All Other Segments Combined Share | 37.0% |
Source: Future Market Insights analysis of the shunt capacitor market, 2026.
Why do Process Industries lead by Application in the Shunt Capacitor Market in 2026?
Process Industries account for 42.0% of the Shunt Capacitor Market by application in 2026. The segment covers mining, metals, chemicals, oil and gas, and pulp and paper plants. Discrete manufacturing, such as automotive and electronics assembly, is counted separately. Process plants buy capacitors for power factor and for specific loads. GE Vernova lists fixed motor and pump power factor correction, fast-switching flicker banks and induction heating capacitors [8]. Magnewin adds harmonic filter, pulse discharge and water-cooled capacitors [15]. Ducati Energia lists low-voltage power factor correction with active filters [18]. Hitachi Energy says its compensation offer covers commercial, industrial, distribution and transmission uses from 208 V to 800 kV [13]. Utility holds 25.0%, driven by transmission and substation projects. Siemens Energy positions mechanically switched capacitors, and their damping-network version, for high-voltage transmission. It cites a 275 kV substation extension as a project example [9]. Recent projects show the same demand. POWERGRID charged the 765 kV Koppal-II pooling station on 31 July 2026 [21]. EVNNPT completed its 16-substation capacitor programme on 30 April 2026 [1]. Discrete Manufacturing holds 18.0% and Commercial & Others 15.0%.
Table 3: Application, 2026 Share
| Leading Share | 2026 market share |
|---|---|
| Process Industries | 42.0% |
| All Other Segments Combined Share | 58.0% |
Source: Future Market Insights analysis of the shunt capacitor market, 2026.
What are the key drivers, restraints and opportunities?
Driver
Generation growth. New wind and solar capacity raises the need for voltage support. China reported 1,310 GW of solar, up 16.5%, and 700 GW of wind, up 20.4%, at the end of September 2026 [2]. In the United States, PJM set a record of 162.6 GW on 2 July 2026. ERCOT set 91.1 GW on 22 July 2026, and SPP set 58.0 GW on 27 July 2026 [4]. Siemens Energy calls mechanically switched capacitors a cost-effective option for voltage control [9].
Grid build-out in large systems. POWERGRID charged the 765 kV Koppal-II pooling station and the 765 kV Koppal-II to Raichur line on 31 July 2026 [21]. KEPCO gives a transport capacity of 14,580 MW for 765 kV, against 4,346 MW for 345 kV [26]. Shunt banks allow more power to be transmitted with better power flow control [11]. Substation transformer demand from the same projects is covered in the power transformer market.
Restraint
Specification fragmentation. IEC 60871-1 applies above 1,000 V [19]. IEEE 18-2025 applies from 216 V and 2.5 kVAR [20]. Hitachi Energy notes that local versions of its QBank may differ in specification [12]. A buyer comparing offers across regions must map ratings, fuse designs and test regimes before prices can be compared. That work slows qualification and gives suppliers with local engineering an advantage. Suppliers that certify to several documents at once, such as GE Vernova with ANSI, IEEE and IEC [8], carry that cost in every bid.
Supplier-side change. GE Vernova's purchase of Trench Group is not expected to close until late 2027 [6]. The deal remains subject to regulatory approvals [6]. Until it closes, ownership, product roadmap and service terms for Trench capacitor units depend on that process. Long-dated orders may need clauses on continuity of supply, spares and type-test records.
Opportunity
Switched banks with damping. Siemens Energy sells mechanically switched capacitors with a damping network. The company says the network limits harmonic amplification [9]. It improves power quality in high-voltage grids with fairly constant or predictable voltage and reactive power profiles [9]. The design is for 24/7 operation and fits compact sites with limited room [9]. Hitachi Energy's range also includes passive and harmonic filters and stepped and step-less fast reactive power compensators [13]. Harmonic filtering is covered in the power quality equipment market.
Monitoring and enclosed banks. GE Vernova lists capacitor monitoring under its CapMD name, next to its capacitor and reactor lines [8]. Hitachi Energy's metal-enclosed banks come with protection features, earthing switches with up to five positions, and indoor or outdoor options [14]. Packaged banks suit sites that want a factory-tested unit instead of site-built racks. Monitoring also adds a service line for the installed base. Monitored substation equipment is covered in the substation automation market.
Shunt Capacitor Market by Country (2026 to 2036)
Table 4: Shunt Capacitor Market Country Growth Forecast
| Country | CAGR, 2026 to 2036 |
|---|---|
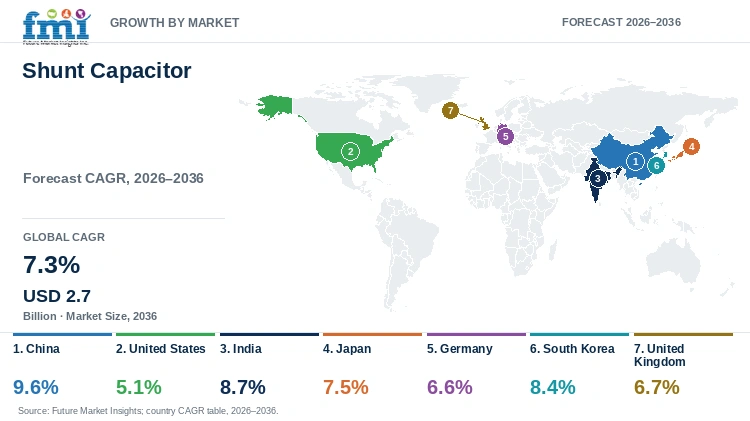
| China | 9.6% |
| United States | 5.1% |
| India | 8.7% |
| Japan | 7.5% |
| Germany | 6.6% |
| South Korea | 8.4% |
| United Kingdom | 6.7% |
Source: Future Market Insights analysis of the shunt capacitor market, 2026.
China
The National Energy Administration published national power statistics on 26 October 2026. They show total power generation capacity of 4,130 GW at the end of September, up 11.2% on the year. Solar stood at 1,310 GW, up 16.5%, and wind at 700 GW, up 20.4% [2].
On 30 October 2026 the administration reported that wind and solar together passed 2,000 GW, reaching 2,010 GW [3]. Shunt banks support voltage stability and allow more power to be transmitted [11]. A fleet growing at these rates keeps reactive compensation work steady. China's forecast rate of 9.6% is the highest of the seven profiled countries.
Buyers planning high-voltage projects can compare published ranges. Hitachi Energy lists shunt compensation banks up to 800 kV [13]. GE Vernova lists capacitors up to 500 kV [8], and Magnewin lists shunt capacitors up to 132 kV [15]. Foreign suppliers must first confirm local qualification terms with the end user. Solar and wind are growing faster than total capacity, so delivery time matters more on smaller sites. CIRCUTOR advertises a capacitor bank stock service for immediate delivery [16].
United States
The US Energy Information Administration reported on 15 October 2026 that PJM, ERCOT and SPP set summer peak load records. PJM reached 162.6 GW on 2 July 2026, 1.3% above its June 2025 record. ERCOT reached 91.1 GW on 22 July 2026, 6.5% above its August 2024 record. SPP reached 58.0 GW on 27 July 2026, 3.5% above its August 2023 record [4].
Solar and storage are being added together. As of September 2026, over 16% of new utility-scale solar capacity added this year is co-located with operable battery storage [5]. Plans for 2027 and 2028 put the share above 30% [5]. California, Arizona, New Mexico and Nevada have shares more than double the national average [5].
The forecast rate of 5.1% is the lowest of the seven profiled countries. On the supply side, IEEE 18-2025 was published on 27 March 2026 [20]. GE Vernova reported third-quarter 2026 revenue of USD 12.6 billion, up 27%, led by Power and Electrification [7]. On 28 October 2026 it agreed to buy Trench Group for USD 9.0 billion [6].
India
POWERGRID charged the 765 kV Koppal-II pooling station and the 765 kV Koppal-II to Raichur transmission line on 31 July 2026 [21]. Hitachi Energy lists open-rack shunt banks up to 765 kV, so this voltage class sits within published supplier ranges [12].
On 1 August 2026 the Prime Minister dedicated Andhra Pradesh transmission projects worth more than INR 4,370 crore [21]. The Prime Minister also laid the foundation stone of POWERGRID's Kurnool-IV REZ Phase-I transmission project, worth more than INR 5,550 crore [21]. These pipelines sit behind the 8.7% forecast rate.
Domestic manufacturing is part of the supply base. Magnewin, based in Kupwad MIDC, Sangli, Maharashtra, was established in 1994 [15]. It lists 440 V low-voltage capacitors with aluminium bodies [15]. Its range also covers medium- and high-voltage shunt power capacitors up to 132 kV for outdoor use, harmonic filter capacitors and custom banks [15]. Global suppliers compete on higher voltage classes and on monitoring, as GE Vernova and Hitachi Energy do [8][13].
Japan
The Organization for Cross-regional Coordination of Transmission Operators, Japan (OCCTO), published its aggregation of electricity supply plans for FY2026 on 5 August 2026 [24]. The publication follows Article 181 of its operational rules [24].
OCCTO published its Annual Report FY2025 on 14 January 2026, under the same article [25]. Procurement teams should read the FY2026 supply plans before timing reactive compensation purchases.
Ratings differ by supplier, so tenders should state the voltage class and fuse design. Hitachi Energy offers its QBank internally fused at 1 to 765 kV and externally fused at 1 to 35 kV [12]. It notes that local versions may differ [12]. Japan's forecast rate is 7.5%.
Germany
On 31 August 2026 the Bundesnetzagentur opened a consultation on draft scenario frameworks for electricity and for gas and hydrogen [22]. The planning horizons are 2040 and 2045. The comment deadline was 28 September 2026, and an online information event was scheduled for 10 September 2026 [22].
The draft expects data centre and grid storage growth to raise power output and consumption [22]. More load and storage on the same network increases demand for voltage support, which Hitachi Energy lists as a main benefit of shunt banks [11].
Siemens Energy is one supplier for that demand. Its group revenue reached EUR 11.4 billion in its third fiscal quarter, up 18.5% on a comparable basis, reported on 5 August 2026 [10]. Order backlog reached EUR 162 billion, with strong increases at Grid Technologies [10]. Its switched capacitor offer targets high-voltage transmission, with damping for harmonics [9]. The company also cites a compact design for sites with limited room, which suits dense substations [9]. Germany's 6.6% forecast rate reflects a steady market, not a fast-growing one.
South Korea
KEPCO's 765 kV project page gives a transport capacity of 14,580 MW, against 4,346 MW for 345 kV [26]. It describes the 765 kV figure as 3.4 times the 345 kV figure [26].
A system built around 765 kV corridors needs voltage support at the high end. Shunt banks allow more power to be transmitted with better power flow control [11]. Bulk-power substations are the natural buyers. South Korea's 8.4% forecast rate is third behind China and India.
Supplier ranges matter here. Hitachi Energy lists its open-rack QBank up to 765 kV [12]. GE Vernova gives 500 kV as the upper end for its capacitors [8]. A bid for 765 kV substations will therefore be judged on the supplier's published high-voltage range. Buyers should ask for reference sites at that voltage instead of relying on catalogue ratings.
United Kingdom
NESO is working on CMP457, a revision of the Obligatory Reactive Power Service. Its second workgroup meeting is scheduled for 18 November 2026, online, and a third for 15 December 2026 [23].
Shunt capacitor banks improve power factor and support voltage [11]. Those functions are the technical purpose behind the service. Until CMP457 concludes, network users and equipment buyers should treat the service terms as open.
Medium-voltage packaged banks are a practical entry point for sites that need power factor correction on their own network. Hitachi Energy's metal-enclosed banks cover 1 to 36 kV and are factory tested [14]. They can be installed indoors or outdoors [14]. CIRCUTOR lists medium-voltage capacitor banks and a stock service for immediate delivery [16]. The United Kingdom's forecast rate is 6.7%.
Who are the notable companies in the Shunt Capacitor Market?
Notable companies in the Shunt Capacitor Market include GE Vernova, Siemens Energy, Hitachi Energy, Magnewin Energy, CIRCUTOR, Arteche and Ducati Energia.
Voltage range is the clearest line between suppliers. Hitachi Energy lists shunt compensation banks from 208 V to 800 kV [13]. GE Vernova gives capacitor ratings from 1 kvar to 500 MVAR and from 240 V to 500 kV [8]. Magnewin spans from 440 V low-voltage units to medium- and high-voltage capacitors up to 132 kV [15]. CIRCUTOR, Arteche and Ducati Energia each list both low-voltage and medium or high-voltage lines [16][17][18]. None of them is limited to one end of the market.
The second line is how much of the surrounding system a supplier sells. Siemens Energy offers switched capacitors with a damping network for harmonic control [9]. It also describes modular designs that can be expanded as grid needs change [9]. GE Vernova pairs capacitor lines with reactors, active filters and CapMD monitoring [8]. Hitachi Energy sells fuse variants and enclosed banks with earthing switches [12][14]. Magnewin competes on units and custom banks [15].
Ownership of capacitor production is also changing. GE Vernova agreed on 28 October 2026 to buy Trench Group, which lists capacitors among its products [6]. The deal is expected to close in late 2027 [6]. GE Vernova, the acquirer, reported third-quarter revenue of USD 12.6 billion, up 27%, in the same month [7]. Siemens Energy reported a group order backlog of EUR 162 billion with its third-quarter results [10].
Key Developments in the Shunt Capacitor Market
- On 28 October 2026, GE Vernova announced an agreement to acquire Trench Group for USD 9.0 billion at closing [6]. Completion is expected in late 2027, subject to regulatory approvals [6].
- On 27 March 2026, IEEE published IEEE 18-2025, the IEEE Standard for Shunt Power Capacitors, which supersedes IEEE 18-2012 [20].
- On 31 July 2026, POWERGRID charged the 765 kV Koppal-II pooling station and the 765 kV Koppal-II to Raichur transmission line in India [21].
- On 30 April 2026, EVNNPT energised shunt capacitor banks at 16 substations of 220 to 500 kV in northern Vietnam, completing the project on schedule [1].
Key Players in the Shunt Capacitor Market
- GE Vernova
- Siemens Energy
- Hitachi Energy
- Magnewin Energy Private Limited
- CIRCUTOR, SA
- Arteche
- Ducati Energia
- Trench Group
Shunt Capacitor Market Report Scope
Table 5: Shunt Capacitor Market Report Scope
| Coverage field | Report scope |
|---|---|
| Market definition | Shunt capacitor units and banks connected in parallel with AC power systems for reactive power compensation, measured by value of sales |
| Voltage Rating | Low & Medium, High |
| Application | Process Industries, Utility, Discrete Manufacturing, Commercial & Others |
| Regions and profiled countries | North America, Europe and Asia Pacific, with China, United States, India, Japan, Germany, South Korea and United Kingdom |
| Companies covered | GE Vernova, Siemens Energy, Hitachi Energy, Magnewin Energy Private Limited, CIRCUTOR, SA, Arteche, Ducati Energia and Trench Group |
| Forecast period | 2026 to 2036, with 2025 as the historical base year |
| Quantitative Units | USD billion |
Source: Future Market Insights analysis of the shunt capacitor market, 2026.
Shunt Capacitor Market by Segments
Shunt Capacitor Market segmented by Voltage Rating:
- Low & Medium
- High
Shunt Capacitor Market segmented by Application:
- Process Industries
- Utility
- Discrete Manufacturing
- Commercial & Others
Shunt Capacitor Market by Region
- North America
- Europe
- Asia Pacific
- China
- United States
- India
- Japan
- Germany
- South Korea
- United Kingdom
Research Sources and Bibliography
- [1] Electricity of Vietnam (EVN). (2026, April 30). Completion of shunt capacitor installation at 16 substations enhances power supply for Northern Vietnam. https://en.evn.com.vn/d/en-US/news/Completion-of-shunt-capacitor-installation-at-16-substations-enhances-power-supply-for-Northern-Vietnam-60-202-501439
- [2] National Energy Administration of China. (2026, October 26). National Energy Administration releases national power statistics for January to September 2026 (in Chinese). https://www.nea.gov.cn/20261026/7e48f52542c94c0f99c166262453627d/c.html
- [3] National Energy Administration of China. (2026, October 30). China's cumulative wind and solar capacity exceeds 2 billion kW (in Chinese). https://www.nea.gov.cn/20261030/225ac5dfa5c640b9884d3b47b212b267/c.html
- [4] U.S. Energy Information Administration. (2026, October 15). PJM, ERCOT, and SWPP all set peak load records this summer. https://www.eia.gov/todayinenergy/detail.php?id=68305
- [5] U.S. Energy Information Administration. (2026, October 30). The share of solar generation with co-located battery storage is increasing. https://www.eia.gov/todayinenergy/detail.php?id=68384
- [6] GE Vernova. (2026, October 28). GE Vernova to acquire Trench Group. https://www.gevernova.com/news/press-releases/ge-vernova-acquire-trench-group
- [7] GE Vernova. (2026, October 28). GE Vernova reports strong third quarter 2026 financial performance. https://www.gevernova.com/news/ge-vernova-reports-strong-third-quarter-2026-financial-performance
- [8] GE Vernova. (n.d.). Capacitors and reactors, Electrification. https://www.gevernova.com/grid-solutions/node/4669
- [9] Siemens Energy. (n.d.). Mechanically switched capacitors (MSC/MSCDN) with optional filter circuit. https://www.siemens-energy.com/global/en/home/products-services/product/msc-mscdn.html
- [10] Siemens Energy. (2026, August 5). Q3 FY26 earnings release. https://www.siemens-energy.com/global/en/home/investor-relations.html
- [11] Hitachi Energy. (n.d.). Capacitor banks. https://www.hitachienergy.com/products-and-solutions/capacitors-and-filters/high-voltage-capacitors-and-filters/capacitor-banks
- [12] Hitachi Energy. (n.d.). Open rack shunt banks, QBank. https://www.hitachienergy.com/products-and-solutions/capacitors-and-filters/high-voltage-capacitors-and-filters/capacitor-banks/open-rack-shunt-banks-qbank
- [13] Hitachi Energy. (n.d.). Capacitors and filters. https://www.hitachienergy.com/products-and-solutions/capacitors-and-filters
- [14] Hitachi Energy. (n.d.). Metal enclosed capacitor banks, MMCB. https://www.hitachienergy.com/products-and-solutions/capacitors-and-filters/medium-voltage-capacitors-and-filters/capacitor-banks/metal-enclosed-capacitor-banks-mmcb
- [15] Magnewin Energy Pvt. Ltd. (n.d.). Power capacitors. https://www.magnewin.com
- [16] CIRCUTOR. (n.d.). Home page: power factor correction and capacitor banks. https://www.circutor.com/en/
- [17] Arteche. (n.d.). Products: capacitor banks and harmonic filters. https://www.arteche.com/en
- [18] Ducati Energia. (n.d.). Products: power factor correction. https://www.ducatienergia.com/en
- [19] International Electrotechnical Commission. (2014, May 22). IEC 60871-1:2014 Shunt capacitors for a.c. power systems having a rated voltage above 1 000 V, Part 1: General. https://webstore.iec.ch/publication/3770
- [20] IEEE Standards Association. (2026, March 27). IEEE 18-2025, IEEE Standard for Shunt Power Capacitors. https://standards.ieee.org/ieee/18/6773
- [21] POWER GRID Corporation of India Limited. (2026, August). Events: Andhra Pradesh transmission projects, Kurnool-IV REZ Phase-I and Koppal-II charging. https://www.powergrid.in/events
- [22] Bundesnetzagentur. (2026, August 31). Bundesnetzagentur opens public consultation on electricity and gas/hydrogen scenario frameworks 2027-2040/2045. https://www.bundesnetzagentur.de/SharedDocs/Pressemitteilungen/EN/2026/20260831_Szenariorahmen.html
- [23] National Energy System Operator. (n.d.). CMP457: Revision of the Obligatory Reactive Power Service (ORPS), Workgroup 2. https://www.neso.energy/calendar/cmp457-revision-obligatory-reactive-power-service-orps-workgroup-2
- [24] OCCTO. (2026, August 5). Aggregation of Electricity Supply Plans for FY 2026. https://www.occto.or.jp/en/information_disclosure/supply_plan/260805_aggregation_supplyplan.html
- [25] OCCTO. (2026, January 14). Annual Report FY2025. https://www.occto.or.jp/en/information_disclosure/annual_report/2025_annualreport_260114.html
- [26] Korea Electric Power Corporation. (n.d.). 765kV transmission and substation project. https://home.kepco.co.kr/kepco/EN/E/htmlView/ENEDHP00201.do?menuCd=EN05040201
Table of Content
- Key Takeaways
- Market Size and CAGR
- Top Growth Driver
- Fastest Growing Segment
- Leading Region
- Key Companies
- Emerging Opportunities
- Executive Summary
- Global Market Outlook
- Demand-side Trends
- Supply-side Trends
- Technology Roadmap Analysis
- Analysis and Recommendations
- Analyst Perspective (What is happening? Why now? What should investors know?)
- Key Questions Answered
- How large is the market?
- What is the CAGR?
- What are key trends?
- Which region dominates?
- Who are the leaders?
Read More...
- Market Overview
- Market Coverage / Taxonomy
- Market Definition / Scope / Limitations
- Research Methodology
- Chapter Orientation
- Analytical Lens and Working Hypotheses
- Market Structure, Signals, and Trend Drivers
- Benchmarking and Cross-market Comparability
- Market Sizing, Forecasting, and Opportunity Mapping
- Research Design and Evidence Framework
- Desk Research Programme (Secondary Evidence)
- Expert Input and Fieldwork (Primary Evidence)
- Tooling, Models, and Reference Databases
- Data Engineering and Model Build
- Quality Assurance and Audit Trail
- Market Background
- Market Dynamics (Drivers, Restraints, Opportunity, Trends)
- Scenario Forecast (Optimistic, Likely, Conservative)
- Impact Analysis
- AI Impact
- Sustainability Impact
- Regulatory Impact
- Technology Impact
- Consumer / Buyer Analysis
- Purchase Drivers
- Adoption Barriers
- Buyer Journey
- Opportunity Map Analysis
- Product Life Cycle Analysis
- Supply Chain Analysis
- Investment Feasibility Matrix
- Value Chain Analysis
- PESTLE and Porter's Analysis
- Regulatory Landscape
- Regional Parent Market Outlook
- Production and Consumption Statistics
- Import and Export Statistics
- Global Market Analysis and Forecast, 2021 to 2036
- Historical Market Size Value (USD Billion) Analysis, 2021 to 2025
- Current and Future Market Size Value (USD Billion) Projections, 2026 to 2036
- Y-o-Y Growth Trend Analysis
- Absolute $ Opportunity Analysis
- Global Market Pricing Analysis, 2021 to 2036
- Global Market Analysis and Forecast, By Voltage Rating, 2021 to 2036
- Introduction / Key Findings
- Historical Market Size Value (USD Billion) Analysis By Voltage Rating, 2021 to 2025
- Current and Future Market Size Value (USD Billion) Analysis and Forecast By Voltage Rating, 2026 to 2036
- Low & Medium
- High
- Y-o-Y Growth Trend Analysis By Voltage Rating, 2021 to 2025
- Absolute $ Opportunity Analysis By Voltage Rating, 2026 to 2036
- Global Market Analysis and Forecast, By Application, 2021 to 2036
- Introduction / Key Findings
- Historical Market Size Value (USD Billion) Analysis By Application, 2021 to 2025
- Current and Future Market Size Value (USD Billion) Analysis and Forecast By Application, 2026 to 2036
- Process Industries
- Utility
- Discrete Manufacturing
- Commercial & Others
- Y-o-Y Growth Trend Analysis By Application, 2021 to 2025
- Absolute $ Opportunity Analysis By Application, 2026 to 2036
- Global Market Analysis and Forecast, By Region, 2021 to 2036
- Introduction
- Historical Market Size Value (USD Billion) Analysis By Region, 2021 to 2025
- Current Market Size Value (USD Billion) Analysis and Forecast By Region, 2026 to 2036
- North America
- Europe
- Asia Pacific
- Market Attractiveness Analysis By Region
- North America Market Analysis and Forecast, By Country, 2021 to 2036
- Historical Market Size Value (USD Billion) Trend Analysis By Market Taxonomy, 2021 to 2025
- Market Size Value (USD Billion) Forecast By Market Taxonomy, 2026 to 2036
- By Country
- By Voltage Rating
- By Application
- Market Attractiveness Analysis
- By Country
- By Voltage Rating
- By Application
- Key Takeaways
- Europe Market Analysis and Forecast, By Country
- Historical Market Size Value (USD Billion) Trend Analysis By Market Taxonomy, 2021 to 2025
- Market Size Value (USD Billion) Forecast By Market Taxonomy, 2026 to 2036
- By Country
- By Voltage Rating
- By Application
- Market Attractiveness Analysis
- By Country
- By Voltage Rating
- By Application
- Key Takeaways
- Asia Pacific Market Analysis and Forecast, By Country
- Historical Market Size Value (USD Billion) Trend Analysis By Market Taxonomy, 2021 to 2025
- Market Size Value (USD Billion) Forecast By Market Taxonomy, 2026 to 2036
- By Country
- China
- United States
- India
- Japan
- Germany
- South Korea
- United Kingdom
- By Voltage Rating
- By Application
- By Country
- Market Attractiveness Analysis
- By Country
- By Voltage Rating
- By Application
- Key Takeaways
- Key Countries Market Analysis
- United States
- Pricing Analysis
- Market Share Analysis, 2025
- By Voltage Rating
- By Application
- Germany
- Pricing Analysis
- Market Share Analysis, 2025
- By Voltage Rating
- By Application
- United Kingdom
- Pricing Analysis
- Market Share Analysis, 2025
- By Voltage Rating
- By Application
- India
- Pricing Analysis
- Market Share Analysis, 2025
- By Voltage Rating
- By Application
- China
- Pricing Analysis
- Market Share Analysis, 2025
- By Voltage Rating
- By Application
- Japan
- Pricing Analysis
- Market Share Analysis, 2025
- By Voltage Rating
- By Application
- South Korea
- Pricing Analysis
- Market Share Analysis, 2025
- By Voltage Rating
- By Application
- United States
- Market Structure Analysis
- Competition Dashboard
- Competition Benchmarking
- Market Share Analysis of Top Players
- By Regional
- By Voltage Rating
- By Application
- Emerging Startups
- Innovation Benchmarking
- Competition Analysis
- Competition Deep Dive
- GE Vernova
- Overview
- Product Portfolio
- Profitability by Market Segments
- Sales Footprint
- Strategy Overview
- Marketing Strategy
- Product Strategy
- Channel Strategy
- Siemens Energy
- Hitachi Energy
- Magnewin Energy Private Limited
- CIRCUTOR, SA
- Arteche
- Ducati Energia
- Trench Group
- GE Vernova
- Case Studies
- Success Stories
- Recent Developments
- Competition Deep Dive
- Assumptions & Acronyms Used
List of Tables
- Table 1: Global Market Value (USD Billion) Forecast by Region, 2021 to 2036
- Table 2: Global Market Value (USD Billion) Forecast by Voltage Rating, 2021 to 2036
- Table 3: Global Market Value (USD Billion) Forecast by Application, 2021 to 2036
- Table 4: North America Market Value (USD Billion) Forecast by Country, 2021 to 2036
- Table 5: North America Market Value (USD Billion) Forecast by Voltage Rating, 2021 to 2036
- Table 6: North America Market Value (USD Billion) Forecast by Application, 2021 to 2036
- Table 7: Europe Market Value (USD Billion) Forecast by Country, 2021 to 2036
- Table 8: Europe Market Value (USD Billion) Forecast by Voltage Rating, 2021 to 2036
- Table 9: Europe Market Value (USD Billion) Forecast by Application, 2021 to 2036
- Table 10: Asia Pacific Market Value (USD Billion) Forecast by Country, 2021 to 2036
- Table 11: Asia Pacific Market Value (USD Billion) Forecast by Voltage Rating, 2021 to 2036
- Table 12: Asia Pacific Market Value (USD Billion) Forecast by Application, 2021 to 2036
List of Figures
- Figure 1: Global Market Pricing Analysis
- Figure 2: Global Market Value (USD Billion) Forecast 2021-2036
- Figure 3: Global Market Value Share and BPS Analysis by Voltage Rating, 2026 and 2036
- Figure 4: Global Market Y-o-Y Growth Comparison by Voltage Rating, 2026-2036
- Figure 5: Global Market Attractiveness Analysis by Voltage Rating
- Figure 6: Global Market Value Share and BPS Analysis by Application, 2026 and 2036
- Figure 7: Global Market Y-o-Y Growth Comparison by Application, 2026-2036
- Figure 8: Global Market Attractiveness Analysis by Application
- Figure 9: Global Market Value (USD Billion) Share and BPS Analysis by Region, 2026 and 2036
- Figure 10: Global Market Y-o-Y Growth Comparison by Region, 2026-2036
- Figure 11: Global Market Attractiveness Analysis by Region
- Figure 12: North America Market Incremental Dollar Opportunity, 2026-2036
- Figure 13: Europe Market Incremental Dollar Opportunity, 2026-2036
- Figure 14: Asia Pacific Market Incremental Dollar Opportunity, 2026-2036
- Figure 15: North America Market Value Share and BPS Analysis by Country, 2026 and 2036
- Figure 16: North America Market Value Share and BPS Analysis by Voltage Rating, 2026 and 2036
- Figure 17: North America Market Y-o-Y Growth Comparison by Voltage Rating, 2026-2036
- Figure 18: North America Market Attractiveness Analysis by Voltage Rating
- Figure 19: North America Market Value Share and BPS Analysis by Application, 2026 and 2036
- Figure 20: North America Market Y-o-Y Growth Comparison by Application, 2026-2036
- Figure 21: North America Market Attractiveness Analysis by Application
- Figure 22: Europe Market Value Share and BPS Analysis by Country, 2026 and 2036
- Figure 23: Europe Market Value Share and BPS Analysis by Voltage Rating, 2026 and 2036
- Figure 24: Europe Market Y-o-Y Growth Comparison by Voltage Rating, 2026-2036
- Figure 25: Europe Market Attractiveness Analysis by Voltage Rating
- Figure 26: Europe Market Value Share and BPS Analysis by Application, 2026 and 2036
- Figure 27: Europe Market Y-o-Y Growth Comparison by Application, 2026-2036
- Figure 28: Europe Market Attractiveness Analysis by Application
- Figure 29: Asia Pacific Market Value Share and BPS Analysis by Country, 2026 and 2036
- Figure 30: Asia Pacific Market Value Share and BPS Analysis by Voltage Rating, 2026 and 2036
- Figure 31: Asia Pacific Market Y-o-Y Growth Comparison by Voltage Rating, 2026-2036
- Figure 32: Asia Pacific Market Attractiveness Analysis by Voltage Rating
- Figure 33: Asia Pacific Market Value Share and BPS Analysis by Application, 2026 and 2036
- Figure 34: Asia Pacific Market Y-o-Y Growth Comparison by Application, 2026-2036
- Figure 35: Asia Pacific Market Attractiveness Analysis by Application
- Figure 36: Global Market - Tier Structure Analysis
- Figure 37: Global Market - Company Share Analysis
Frequently Asked Questions
How big is the shunt capacitor market in 2026?
The Shunt Capacitor Market is estimated at USD 1.3 billion in 2026, up from USD 1.2 billion in 2025. It is projected to reach USD 2.7 billion by 2036, a 7.3% CAGR from 2026 to 2036.
Which segments lead the shunt capacitor market?
Low & Medium leads by voltage rating with 63.0% in 2026. Process Industries lead by application with 42.0%. Hitachi Energy lists metal-enclosed banks from 1 to 36 kV [14]. GE Vernova lists fixed motor and pump power factor correction among its capacitor lines [8].
Which other segments matter?
High voltage holds 37.0% by voltage rating. By application, Utility holds 25.0%, Discrete Manufacturing 18.0% and Commercial & Others 15.0%. Hitachi Energy offers its QBank open-rack banks up to 765 kV and 600 Mvar [12]. Siemens Energy offers switched capacitors for high-voltage transmission [9].
Which profiled country is forecast to grow fastest?
China has the highest forecast CAGR of the seven profiled countries, at 9.6% from 2026 to 2036. India is at 8.7% and South Korea at 8.4%. China's wind and solar capacity passed 2,000 GW, as reported on 30 October 2026 [3].
Which standards apply to shunt capacitors?
IEC 60871-1 covers shunt capacitors for AC systems above 1,000 V. It was published on 22 May 2014 [19]. IEEE 18-2025, published on 27 March 2026, covers capacitors rated 216 V or higher and 2.5 kVAR or more [20]. Check which one a tender cites before comparing offers.
What should a buyer check when choosing a supplier?
Check the voltage range and fuse design first. Hitachi Energy offers internally fused (1 to 765 kV), externally fused (1 to 35 kV) and fuseless (35 to 765 kV) QBank designs [12]. Then check ownership and service, since GE Vernova's agreement to acquire Trench Group is not expected to close until late 2027 [6].
Preview the report firsthand - request a free sample
Get SampleGet the brochure for pricing and purchase details.
Get PDF
