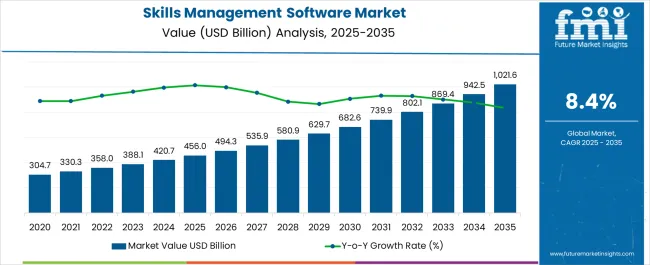
The Skills Management Software Market is estimated to be valued at USD 456.0 billion in 2025 and is projected to reach USD 1021.6 billion by 2035, registering a compound annual growth rate (CAGR) of 8.4% over the forecast period.
| Metric | Value |
|---|---|
| Skills Management Software Market Estimated Value in (2025 E) | USD 456.0 billion |
| Skills Management Software Market Forecast Value in (2035 F) | USD 1021.6 billion |
| Forecast CAGR (2025 to 2035) | 8.4% |
The skills management software market is expanding steadily, supported by the increasing importance of workforce upskilling, compliance with industry standards, and the rising complexity of talent management in a competitive business environment. Organizations are prioritizing structured approaches to track employee competencies, identify skill gaps, and align training initiatives with evolving business objectives.
Digital transformation across industries is accelerating the adoption of advanced software platforms that integrate analytics, reporting, and AI enabled recommendations. In addition, hybrid and remote work models are driving enterprises to invest in centralized systems for managing skill inventories across distributed teams.
The long term outlook remains positive as organizations continue to prioritize employee development, regulatory compliance, and workforce optimization as strategic levers for growth and sustainability.
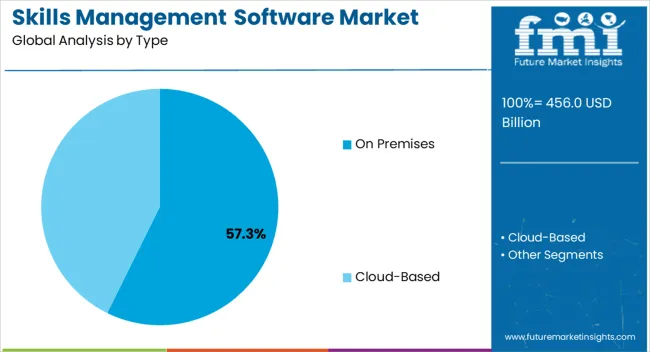
The on premises type segment is expected to hold 57.30% of total market revenue by 2025, making it the leading deployment model. This dominance is being driven by enterprises that prioritize greater control over sensitive employee data, robust customization capabilities, and adherence to stringent internal compliance requirements.
On premises solutions are often favored in industries with high regulatory oversight, where security and data governance remain critical priorities. Additionally, organizations with existing IT infrastructure investments find on premises deployment more cost efficient in the long run.
The ability to tailor solutions to specific business processes and maintain operational autonomy has reinforced the strong position of this segment in the overall market.
The skills management software industry grew significantly between 2020 and 2025, owing to the rising need for effective talent management solutions. As other sectors recognized the need to efficiently control and increase their workforce's abilities, such software solutions were adopted.
The skills management software industry is expected to grow even more significantly between 2025 and 2035. The rapid growth of technologies such as artificial intelligence and machine learning surges the demand for sophisticated skills management software, which enables businesses to optimize talent acquisition, training, and workforce planning. To cater to growing corporate needs, the market is likely to see the creation of innovative features and integration capabilities, boosting market growth for skills management software.
Several factors are propelling the Skills Management Software market. The increased emphasis on talent development and workforce optimization accelerates the adoption of such software solutions. Organizations recognize the importance of properly identifying, assessing, and developing their employees' abilities to remain competitive.
The increased demand for automation and digitalization in human resource management procedures drives market expansion. Skills management software improves overall productivity by streamlining and automating operations like skill tracking, performance evaluation, and training. Incorporating sophisticated technologies such as artificial intelligence and machine learning expands the software's capabilities, enabling personalized skill development programs and predictive analytics, hence increasing market demand.
There is the issue of data accuracy and reliability. Ensuring that the skills data inputted into the software is up-to-date, relevant, and accurately reflects employees' capabilities can be a significant challenge. Integration with existing HR systems and processes can be complex, requiring seamless compatibility to avoid disruptions.
User adoption and engagement can pose a challenge, as organizations may need more employee enthusiasm in using the software effectively. Evolving technology trends and changing skill requirements demand continuous updates and customization, which can be challenging for software providers to keep up with.
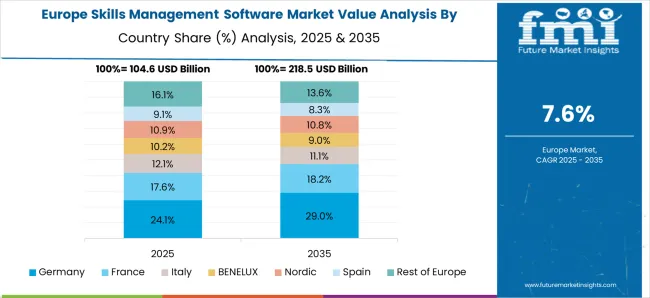
| Countries | 2025 value share in Global Market |
|---|---|
| North America | 28.8% |
| Europe | 21.1% |
North America dominated the skills management software market due to the presence of technically advanced countries like the United States and Canada. The adoption of skills management software by small and medium-sized enterprises is also one of the key reasons for the expanding market in the region. The United States dominated the North American market.
Asia Pacific may see significant growth in skills management software in the next ten years. This is due to rapidly developing nations in regions like China, Japan, South Korea, and India. Asia-Pacific also represented over 60% of the global workforce as of 2025. The need to manage the skills of around 2 billion regional workers creates significant opportunities in the skills management software business.
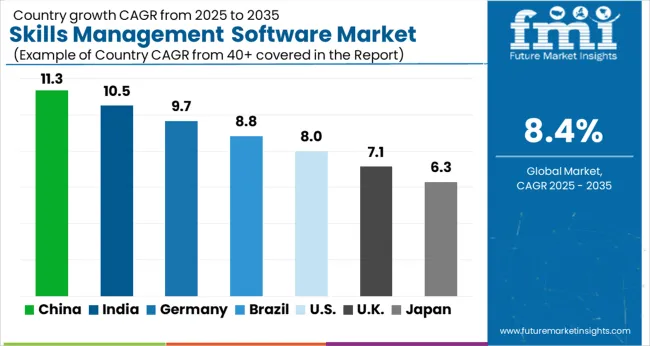
| Attribute | Details |
|---|---|
| Japan Market Share - 2025 | 4.5% |
| China Market CAGR (From 2025 to 2035) | 6.1% |
| India Market CAGR (From 2025 to 2035) | 8.7% |
China has a promising market even though it is still in its budding stage. By 2035, the market in China is expected to be valued at USD 456 million, with an absolute dollar opportunity of USD 29.2 million. In the next ten years from 2025 to 2035, the market is expected to experience a CAGR of 7.9%. From 2020 to 2025, the market has experienced a CAGR of 10.2%.
The increasing older population in China and the decreasing rate of urbanization are pushing China to use its existing workforce efficiently. Studies have found that by 2035, 30% of China’s workforce which is 220 million people may need to transfer between jobs and there may be an 18% and 11% decrease in demand for physical and manual labor demand respectively.
There may be an 18% and 51% increase in demand for emotional and technological skills respectively. This situation may lead to an increased demand for skills management software in the Chinese market to better arrange their changing workforce.
| Attribute | Details |
|---|---|
| Germany Market Share - 2025 | 8.7% |
| United Kingdom Market CAGR (From 2025 to 2035) | 8.2% |
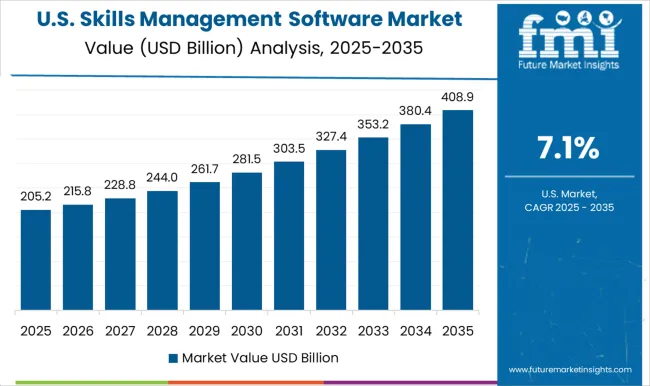
| Attribute | Details |
|---|---|
| United States Market Share - 2025 | 16.3% |
| Australia Market Share - 2025 | 3.5% |
The United States has the leading share in the skills management software market. By the year 2035, the market in the United States is expected to be worth USD 304.7 million, with an absolute dollar opportunity of USD 153.4 million. The market has previously experienced a CAGR of 10.2% from the year 2020 to 2025 and is expected to experience a CAGR of 8.2% in the next ten years.
OrgVue published a report that states that 64% of the United States companies may focus on cost reduction in the coming years. As of 2024, there are 20,139 large companies present in The United States. Thus with the increasing number of organizations in the country, the need to manage the workforce efficiently in a cost-efficient way is also increasing. This is fuelling the growth of skills management software demand in the country.
| Segment | Application |
|---|---|
| Segment Name | Large organizations |
| Segment Share | 61.2% |
Large organizations generate the maximum demand for skills management software because of the large number of people employed. Revenue through this segment experienced a CAGR of 4.9% from the year 2020 to 2025, and from 2025 to 2035 the revenue is expected to see a CAGR of 8.1%.
The essential feature provided by efficient skill management software like resource planning, organization, coordination, and reporting for analysis and decision-making makes it essential for all large organizations. This helps them to increase the efficiency of their work by using their workforce to its full potential.
| Segment | Type |
|---|---|
| Segment Name | On-Premises |
| Segment Share | 61.2% |
In the skills management software market, the On-Premises sector has emerged as the major revenue source. The deployment of software solutions within an organization's own infrastructure, where the software is deployed and maintained on the company's servers or data centers, is referred to in this category. On-premises deployment provides improved data control, customization possibilities, and security safeguards, making it a popular choice among many businesses.
The requirement for effective skill evaluation, talent acquisition, and staff development plans has increased demand for on-premises skills management software solutions. As a result, the On-Premises segment generates the most revenue in the skills management software market.
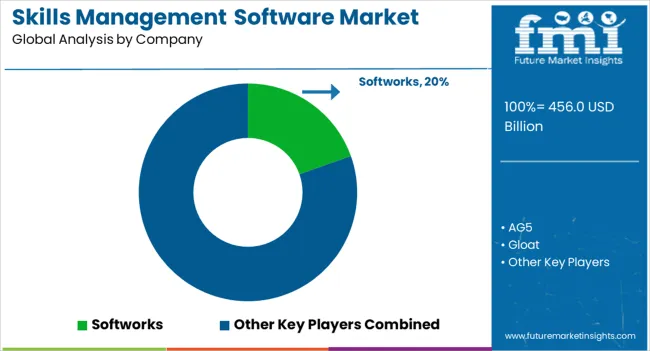
The competition in the skills management software market is fierce and ever-changing. Numerous software companies have entered the market as organizations recognize the need to manage their staff skills efficiently. Established firms compete for market share, while new entrants try to establish a footing.
Product features, functionality, scalability, user experience, pricing methods, and customer support are the primary drivers of competition. Companies distinguish themselves by ongoing innovation, strategic alliances, and the ability to react to changing market demands. The competition creates a dynamic environment in which providers continually strive to improve their offers, resulting in more value for customers.
Novel Breakthroughs and Advancements
| Company | AG5 |
|---|---|
| Strategy | AG5 Receives USD 1.4 Million Funding Boost from Peak to Enhance Skill Management Software Offering |
| Details | In May 2025, AG5’s team raised USD 1.4 million in their recent investment round from Tech Investor Peak. They plan on using the fund to develop their skill management software further and make it available worldwide. |
| Company | EmployPlan |
|---|---|
| Strategy | Introducing EmployPlan 2.0 |
| Details | In May 2025, EmployPlan introduced EmployPlan 2.0, the most user-friendly multi-project resource planning platform available. EmployPlan reduced the amount of time-consuming administrative work required to handle resource management to a minimum by using a responsive modern user interface. |
| Company | Gloat |
|---|---|
| Strategy | Gloat Secures USD57 Million Funding to Fuel Expansion and Platform Enhancement |
| Details | In June 2024, Gloat secured USD 57 Million in funding, which it may use to continue business development as well as to add more features to its own platform. For instance, it may use this money to expand into more contractor openings, create more opportunities for secondments at other companies, and include front-line positions in addition to the knowledge worker roles that the AI is currently optimized for. |
| Company | MuchSkills |
|---|---|
| Strategy | MuchSkills Introduces Mapping Software with Version 3.1 |
| Details | In October 2024, Real-time skills gap analysis has become much simpler because of MuchSkills' most recent release of skills and competency mapping software. The MuchSkills 3.1 upgrade makes it simple for teams and organizations to spot skill shortages that can have an impact on performance with the aid of intelligent filters and meaningful data visualizations. They can then utilize this information which includes the number of employees by skill and skill level to find chances for upskilling, reskilling, or hiring. |
| Company | Skillnet |
|---|---|
| Strategy | Skillnet Expands Reach in Latin American Market with Mexico Subsidiary Launch |
| Details | In September 2024, Skillnet announced the expansion of their geographical territories with the launch of their Mexico Subsidiary. The company believes that it may help them expand their customer base as they can now serve customers in Mexico and Central and Southern America. |
| Company | Intelligent Role Studio (IRS) |
|---|---|
| Strategy | TalentGuard Unveils Intelligent Role Studio (IRS) |
| Details | In March 2024, Intelligent Role Studio (IRS), an Artificial Intelligence powered solution that combines deep subject matter expertise with algorithmic intelligence, was launched by TalentGuard. |
The global skills management software market is estimated to be valued at USD 456.0 billion in 2025.
The market size for the skills management software market is projected to reach USD 1,021.6 billion by 2035.
The skills management software market is expected to grow at a 8.4% CAGR between 2025 and 2035.
The key product types in skills management software market are on premises and cloud-based.
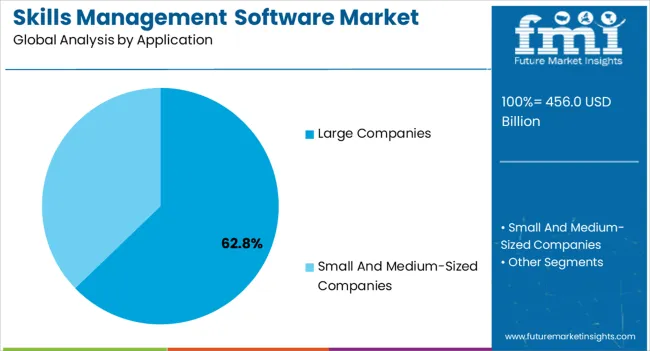
In terms of application, large companies segment to command 62.8% share in the skills management software market in 2025.


Our Research Products

The "Full Research Suite" delivers actionable market intel, deep dives on markets or technologies, so clients act faster, cut risk, and unlock growth.

The Leaderboard benchmarks and ranks top vendors, classifying them as Established Leaders, Leading Challengers, or Disruptors & Challengers.

Locates where complements amplify value and substitutes erode it, forecasting net impact by horizon

We deliver granular, decision-grade intel: market sizing, 5-year forecasts, pricing, adoption, usage, revenue, and operational KPIs—plus competitor tracking, regulation, and value chains—across 60 countries broadly.

Spot the shifts before they hit your P&L. We track inflection points, adoption curves, pricing moves, and ecosystem plays to show where demand is heading, why it is changing, and what to do next across high-growth markets and disruptive tech

Real-time reads of user behavior. We track shifting priorities, perceptions of today’s and next-gen services, and provider experience, then pace how fast tech moves from trial to adoption, blending buyer, consumer, and channel inputs with social signals (#WhySwitch, #UX).

Partner with our analyst team to build a custom report designed around your business priorities. From analysing market trends to assessing competitors or crafting bespoke datasets, we tailor insights to your needs.
Supplier Intelligence
Discovery & Profiling
Capacity & Footprint
Performance & Risk
Compliance & Governance
Commercial Readiness
Who Supplies Whom
Scorecards & Shortlists
Playbooks & Docs
Category Intelligence
Definition & Scope
Demand & Use Cases
Cost Drivers
Market Structure
Supply Chain Map
Trade & Policy
Operating Norms
Deliverables
Buyer Intelligence
Account Basics
Spend & Scope
Procurement Model
Vendor Requirements
Terms & Policies
Entry Strategy
Pain Points & Triggers
Outputs
Pricing Analysis
Benchmarks
Trends
Should-Cost
Indexation
Landed Cost
Commercial Terms
Deliverables
Brand Analysis
Positioning & Value Prop
Share & Presence
Customer Evidence
Go-to-Market
Digital & Reputation
Compliance & Trust
KPIs & Gaps
Outputs
Full Research Suite comprises of:
Market outlook & trends analysis
Interviews & case studies
Strategic recommendations
Vendor profiles & capabilities analysis
5-year forecasts
8 regions and 60+ country-level data splits
Market segment data splits
12 months of continuous data updates
DELIVERED AS:
PDF EXCEL ONLINE
Software License Management (SLM) Market Size and Share Forecast Outlook 2025 to 2035
Fuel Management Software Market Size and Share Forecast Outlook 2025 to 2035
Case Management Software (CMS) Market Size and Share Forecast Outlook 2025 to 2035
Farm Management Software Market Size and Share Forecast Outlook 2025 to 2035
Exam Management Software Market
Quote Management Software Market Size and Share Forecast Outlook 2025 to 2035
Trade Management Software Market Size and Share Forecast Outlook (2025 to 2035)
Event Management Software Market Analysis - Size, Share, and Forecast 2025 to 2035
Grant Management Software Market - Trends, Size & Forecast 2025 to 2035
Video Management Software Market
Server Management Software Market Size and Share Forecast Outlook 2025 to 2035
Change Management Software Market Size and Share Forecast Outlook 2025 to 2035
SBOM Management and Software Supply Chain Compliance Market Analysis - Size, Share, and Forecast Outlook 2025 to 2035
Church Management Software Market Size and Share Forecast Outlook 2025 to 2035
Cattle Management Software Market Size and Share Forecast Outlook 2025 to 2035
Output Management Software Market Insights – Growth & Forecast through 2035
Travel Management Software Market
Talent Management Software Market Report – Trends & Forecast 2023-2033
Patent Management Software Market
Project Management Software Market Size and Share Forecast Outlook 2025 to 2035

Thank you!
You will receive an email from our Business Development Manager. Please be sure to check your SPAM/JUNK folder too.
Chat With
MaRIA