

- Market Size (2026)
- USD 2.6 Bn
- Forecast (2036)
- USD 8.6 Bn
- CAGR (2026 to 2036)
- 12.6%
How big is Sleep Optimization Wearable Market in 2026?
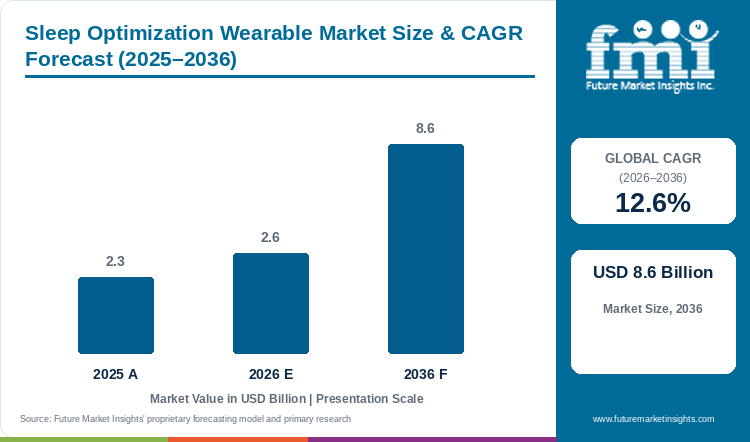
Sales of sleep optimization wearables are estimated to rise at 12.6% CAGR through 2036. Market valuation increases from USD 2.3 billion in 2025 to USD 2.6 billion in 2026 and is estimated to reach USD 8.6 billion by 2036.
Sleep optimization wearables has gained noticeable use among consumers owing to regular monitoring of sleep duration, bedtime and recovery. The market was valued at USD 2.3 billion in 2025 and is estimated at USD 2.6 billion in 2026. Market revenue is projected to reach USD 8.6 billion by 2036, expanding at 12.6% CAGR between 2026 and 2036. According to FMI, smart rings represents the leading product type with 40.7% revenue share in 2026, owing to compact size and continuous skin contact during sleep. The National Center for Health Statistics reported in April 2026 that 30.5% of USA adults slept less than seven hours during 2024.[1] Oura also reported paid membership approaching five million in May 2026 after more than four times growth in two years. [11] Apart from that, Samsung expanded Galaxy Ring to eleven sizes and 53 markets in January 2025.[6] While population sleep-duration deficits and growing membership subscriber counts highlight broad addressable interest, projected hardware revenue reflects device shipments, replacement cycles, and sensor ecosystem upgrades across commercial platforms.
Key Market Trends & Insights
- By product type, smart rings is projected to lead with 40.7% revenue share in 2026.
- By technology, photoplethysmography and accelerometry is set to account for 64.5% share in 2026.
- By application, sleep tracking and insight are expected to represent 46.5% of revenue in 2026.
- By sales channel, online retail is expected to hold around 62.6% share in 2026.
- By consumer group, wellness-focused adults will account for 50.9% share in 2026.
Regional Highlights
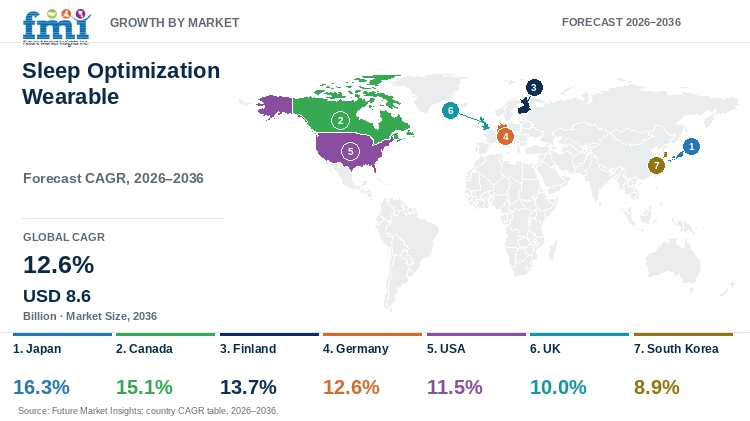
- Fastest-growing profiled country: Japan is projected at 16.3% CAGR from 2026 to 2036. Domestic Galaxy Ring availability and eleven product sizes are supporting local fitting and product trial.
- Canada and Finland are projected at 15.1% and 13.7% CAGR, respectively, while South Korea records the lowest profiled CAGR at 8.9%.
Market Size & Forecast
Table 1: Market Size and Forecast for the Sleep Optimization Wearable Market (USD billion and percent), 2025 to 2036
| Metric | Value |
|---|---|
| 2025 Market Size | USD 2.3 billion |
| Estimated Market Size in 2026 | USD 2.6 billion |
| Projected Market Size by 2036 | USD 8.6 billion |
| CAGR, 2026 to 2036 | 12.6% |
| Added Revenue, 2026 to 2036 | USD 6.0 billion |
| Market Expansion Multiple | 3.31x |
Battery duration and understandable sleep information are becoming important factors for continued use of sleep wearables. Apple Watch Series 11 provides up to 24 hours of battery, while fifteen minutes of charging offers up to eight hours of use.[7] Garmin vívoactive 6 provides up to eleven days of battery and combines sleep score with personalized sleep coaching.[8] These products serves different consumers, as smartwatch devices provide daytime functions while longer-wear devices reduces charging gaps between sleep periods. Apple used more than five million nights of sleep data for developing and testing its sleep-score algorithm. Oura paid membership approached five million during 2026, showing continued use of ring-linked health information. Due to these factors, battery continuity and simple interpretation is expected to support repeat demand for sleep optimization wearables.
Wearability and Recurring-Use Indicators
Sleep optimization wearables provides higher use when the device is worn across several nights and offers comparable information. Battery duration supports recording continuity, whereas membership and scoring systems helps consumers understand the collected sleep information.
Table 2: Wearability and Recurring-Use Indicators for the Sleep Optimization Wearable Market (members, markets, sizes, battery duration, and sleep records), mixed reporting years from 2025 to 2026
| Indicator | Data Point | Why It Matters | Source |
|---|---|---|---|
| Oura paid membership | Approaching 5 million in May 2026; more than 4x growth in two years | Shows recurring use of ring-linked health information beside hardware sales. | [11] |
| Oura Ring 5 design | 40% smaller than Ring 4 in May 2026 | Smaller design supports overnight comfort and continued finger wear. | [5] |
| Galaxy Ring availability | 53 markets and eleven sizes in January 2025 | Wider country and size coverage reduces access and fitting limitations. | [6] |
| Apple sleep-score development | More than 5 million nights of sleep data | A larger development dataset supports scoring across repeated overnight records. | [7] |
| Apple Watch Series 11 battery | Up to 24 hours; 15 minutes charging provides up to 8 hours | Fast charging can create enough operating time for another sleep period. | [7] |
| Garmin vívoactive 6 battery | Up to 11 days in April 2025 | Longer battery reduces charging interruptions across daytime and overnight use. | [8] |
| USA short sleep duration | 30.5% of adults in 2024 | Provides a measurable population need for duration and bedtime monitoring. | [1] |
| Canada movement-guideline adherence | 13.6% of adults in the 2025 edition | Connects sleep with broader daily activity and sedentary-behaviour monitoring. | [2] |
Analyst Perspective
“I expect comfortable wearables with clear sleep guidance to gain stronger adoption than products offering unexplained scores. Longer battery, dependable sensing and useful morning information will decide which companies retain regular users.”
- Anurag Sharma, Principal Consultant, Future Market Insights.
How is the sleep optimization wearable market segmented?
Sleep optimization wearable market is segmented by five primary segments and region: product type, technology, application, sales channel, consumer group, and region. In 2026, smart rings are projected at 40.7%, photoplethysmography and accelerometry at 64.5%, sleep tracking and insight at 46.5%, online retail at 62.6%, and wellness-focused adults at 50.9%.
By product type: smart rings; wristbands and smartwatches; headbands and neurostimulation wearables; sleep masks and earbuds.
By technology: photoplethysmography and accelerometry; EEG-based monitoring; temperature and respiration sensing; active intervention technologies.
By application: sleep tracking and insight; sleep enhancement and intervention; sleep disorder screening; performance and wellness coaching.
By sales channel: online retail; consumer electronics stores; specialty stores; direct-to-consumer websites.
By consumer group: wellness-focused adults; athletes and performance users; older adults and clinical users.
By region: North America; Latin America; Western Europe; Eastern Europe; East Asia; South Asia and Pacific; Middle East and Africa.
Why do Smart Rings lead the Product Type category?
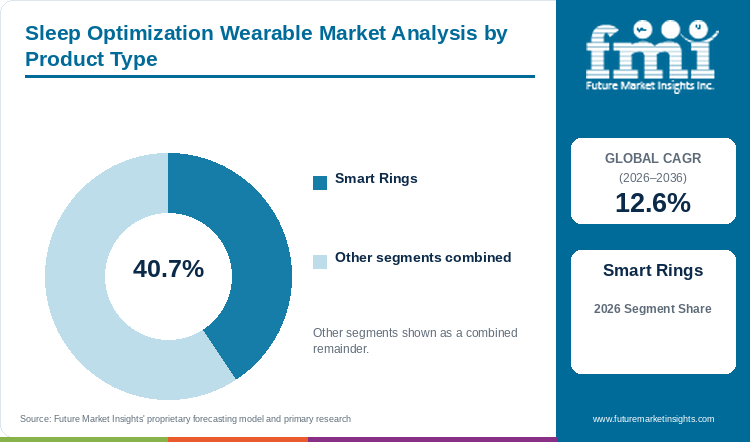
Based on product type, smart rings are projected to account for 40.7% in 2026, owing to comfortable overnight use.
Table 3: Product Type Share for the Sleep Optimization Wearable Market (percentage share), 2026
| Product Type | Share (2026) |
|---|---|
| Smart Rings | 40.7% |
| Other Segments Combined | 59.3%* |
| Total | 100.0% |
*Calculated as the balance remaining after deducting the leading segment’s reported share from 100.0%.
Table 4: Product Type Leadership and Market Growth for the Sleep Optimization Wearable Market (segment and CAGR percentage), 2026 to 2036
| Metric | Value |
|---|---|
| Global CAGR (2026 to 2036) | 12.6% |
| Leading Segment | Smart Rings |
Smart rings records movement, pulse and temperature information without requiring a bright display during sleep. Oura introduced Ring 5 in May 2026 with a design 40% smaller than Ring 4 and twelve signal pathways.[5] Smaller ring size and improved sensor contact is expected to increase comfortable overnight use. In the FMI report, smart rings are projected at 40.7% share in 2026, due to which ring fitting remains important for suppliers and buyers.
- Smart rings are projected to hold 40.7% of product type revenue in 2026, supported by comfortable overnight use.
- Ring sizing affects sensor contact and comfort, due to which sizing kits remain important for online and store purchases.
What supports Photoplethysmography and Accelerometry in the Technology category?
By technology, photoplethysmography and accelerometry are estimated to hold 64.5% in 2026, supported by compact sensor integration.
Photoplethysmography records pulse-related signals, whereas accelerometry measures movement during sleep. Samsung expanded Galaxy Ring to eleven sizes and 52 markets in January 2025, increasing availability of optical and movement sensing.[6] These two technologies can be placed inside one ring or watch without separately worn instruments. FMI data suggests photoplethysmography and accelerometry will hold 64.5% in 2026, supported by wider integration in compact wearables.
- Photoplethysmography and accelerometry are estimated to hold 64.5% of technology revenue in 2026, supported by compact sensor integration.
- Optical and movement sensors can be integrated into one compact device, reducing requirement for separately worn instruments.
How does Sleep Tracking and Insight retain its Application lead?
In 2026, sleep tracking and insight is expected to lead application with 46.5% share, driven by regular morning use.
Sleep tracking and insight provides information related to duration, consistency, interruptions and recovery after waking. Apple introduced sleep score with Apple Watch Series 11 in September 2025 and offered a score from 0 to 100.[7] Sleep duration contributes 50 points, bedtime consistency contributes 30 points and interruptions contributes 20 points. As noted by FMI, the application is expected to account for 46.5% share in 2026, owing to regular morning use.
- Sleep tracking and insight is expected to lead application with 46.5% share in 2026, driven by regular morning use.
- Consumers can compare sleep duration, bedtime consistency and interruptions before changing a daily sleep routine.
Why does Online Retail dominate the Sales Channel category?
By sales channel, online retail is forecast to represent 62.6% in 2026, reinforced by direct ordering and product comparison.
Online retail provides access to smart rings, watches, bands and headbands through brand websites and e-commerce platforms. Oura expanded Walmart. com availability of Ring 4 and Ring 4 Ceramic in November 2025 and supported purchase through a sizing kit.[12] Consumers can compare battery, subscription, compatibility and exchange terms before placing an order. FMI research indicates online retail will represent 62.6% in 2026, supported by direct ordering and wider product comparison.
- Online retail is forecast to represent 62.6% of sales channel revenue in 2026, owing to direct ordering and product comparison.
- Sizing kits and exchange terms help online buyers select a ring without depending only on standard jewellery size.
What makes Wellness-Focused Adults central to the Consumer Group category?
Wellness-focused adults are projected to hold 50.9% share in 2026, influenced by everyday sleep and recovery monitoring.
Wellness-focused adults are using sleep wearables for recording everyday sleep, activity and recovery without entering clinical treatment. Garmin introduced vívoactive 6 in April 2025 with up to eleven days of battery, sleep coach and smart wake alarm.[8] Longer battery allows daytime and overnight use between charging periods. An FMI analyst notes that wellness-focused adults will hold 50.9% share in 2026, influenced by regular sleep and recovery monitoring.
- Wellness-focused adults are projected to hold 50.9% of consumer group revenue in 2026, influenced by everyday sleep and recovery monitoring.
- Working professionals and fitness users can combine sleep information with daily activity in one wearable product.
What are the drivers, restraints and opportunities in the sleep optimization wearable market?
In the sleep optimization wearable market, short sleep duration drives adoption, measurement variation restrains confidence, and connected health services create the key opportunity.
- Driver: Increasing sleep concern is supporting regular overnight tracking.
- Restraint: Difference between wearable estimates and laboratory measurement may restrict confidence.
- Opportunity: Connected care and qualified health support can widen wearable application.
Short Sleep Duration Supports Adoption
Short sleep duration is one of the primary factors driving demand for sleep optimization wearables. The National Center for Health Statistics reported in April 2026 that 30.5% of USA adults slept less than seven hours during 2024. Short sleep duration reached 34.5% among adults aged 50 to 64 years.[1] Wearable products allows users to record duration and bedtime on regular basis. Growing concern related to daily sleep routine is expected to drive the market growth.
Measurement Variation Limits Confidence
Measurement difference between consumer wearables and laboratory sleep testing may hamper product adoption. A March 2025 study compared six wrist-worn devices with polysomnography and reported stronger sleep detection than wake detection.[9] Agreement also varied according to product and sleep stage in the tested devices. Consumers may receive detailed scores even when wake periods are recorded with lower accuracy. Limited confidence in measurement consistency may restrict the market growth.
Connected Health Expands Product Use
Connected health support is creating new growth opportunities for sleep optimization wearable companies. WHOOP launched Connected Care in August 2026 for eligible Medicare beneficiaries and linked wearable information with care navigation.[10] This service extends biometric information beyond fitness and recovery use. Connection between consumer wearables and qualified health support can increase application among older and health-focused users. Expansion of connected services is expected to create new avenues in the market.
Which country CAGRs are profiled in the sleep optimization wearable market?
Table 5: Country CAGR Comparison for the Sleep Optimization Wearable Market (CAGR percentage), 2026 to 2036
| Country | CAGR |
|---|---|
| Japan | 16.3% |
| Canada | 15.1% |
| Finland | 13.7% |
| Germany | 12.6% |
| USA | 11.5% |
| UK | 10.0% |
| South Korea | 8.9% |
How do country-level CAGRs compare in the sleep optimization wearable market?
Commercial conditions differ across the profiled countries owing to domestic product availability, sleep conditions, and local wearable capabilities. Japan and Canada are projected to register higher growth, whereas the remaining countries expands through separate retail and public-health conditions.
- Domestic sale of Galaxy Ring and eleven available sizes are supporting product trial and fitting.
- National sleep indicators are supporting consumer awareness of sleep and daily movement behaviour.
- Local ring expertise and established digital health use are supporting product availability.
- Public health indicators and schedule-related sleep concerns are supporting regular health measurement.
- High occurrence of short sleep duration is increasing attention towards nightly sleep information.
- National well-being reporting and mixed online-store access are supporting wearable adoption.
- Sleep coaching and smart wake functions are expanding choice among wrist wearables.
Full report country CAGRs cover: North America; Latin America; Western Europe; Eastern Europe; East Asia; South Asia and Pacific; Middle East and Africa.
Country-wise Analysis
- By 2036, Japan is projected to grow at 16.3% CAGR, supported by wider domestic availability of smart rings. Samsung announced in January 2025 that Galaxy Ring would enter Japan during February as part of expansion to 52 markets.[6] The company also increased the ring range to eleven sizes from size 5 to 15. Additional sizes improves fitting and consistent sensor contact during sleep. Expansion of local retail and product support is anticipated to drive the Japan sleep optimization wearable market growth.
- Canada sleep optimization wearable outlook is anticipated to advance at 15.1% CAGR over the assessment period, supported by national sleep reporting. The Public Health Agency of Canada reported in January 2026 that 13.6% of adults met the complete 24-hour movement guidelines.[2] These guidelines combines physical activity, sedentary behaviour and sleep requirements in one national measure. Public reporting is increasing access to information related to daily movement and sleep behaviour. Availability of rings and watches is expected to support the Canada market revenue growth.
- Adoption of sleep wearables in Finland is estimated to expand at 13.7% CAGR through 2036, attributed to local ring expertise and digital health use. Statistics Finland reported in March 2026 that 68. 3% of residents aged 16 years or older considered its health good or very good during 2025.[16] Oura also maintains its product and support presence in Finland. Consumers can access ring sizing, membership information and local retail support. Presence of domestic expertise is anticipated to propel the Finland market growth.
- The Germany sleep optimization wearable sector is projected to record 12.6% CAGR during the assessment period, influenced by measurable health reporting. The Robert Koch Institute reported in July 2026 that its federal web portal displays around 90 indicators related to noncommunicable diseases and determinants.[3] The information system also draws from more than 100 data sources. Public access to health indicators is increasing familiarity with regular health measurement. Wider use of watches and rings is expected to support the Germany market growth.
- Sleep optimization wearable demand in the USA is forecast to rise at 11.5% CAGR over the forecast period, driven by measurable sleep difficulty. The National Center for Health Statistics reported in April 2026 that 30.5% of adults slept less than seven hours during 2024.[1] Short sleep duration reached 34.5% among adults aged 50 to 64 years. High occurrence of insufficient sleep supports regular use of rings, watches and bands. Expansion of consumer sleep scores is expected to drive the USA market growth.
- The UK sleep optimization wearable market is anticipated to grow at 10.0% CAGR between 2026 and 2036, supported by wider well-being monitoring. The Office for National Statistics reported in February 2026 that adults reporting good or very good health decreased from 76.0% in 2020 to 70.9% in 2025.[4] The national framework provides regular measures covering health and personal well-being. Attention towards measurable daily health is supporting sleep and activity wearables. Expansion of online selection and store sizing is anticipated to support UK growth.
- Sleep optimization wearable sales in South Korea are forecast to expand at 8.9% CAGR by 2036, supported by sleep coaching functions. Garmin introduced vívoactive 6 in South Korea during April 2025 with sleep score, personalized coaching and smart wake alarm.[8] The smartwatch provides up to eleven days of battery life, supporting daytime and overnight use between charging periods. Availability of sleep guidance with broader fitness functions is increasing consumer choice. Continued product launches are expected to support South Korea market growth.
Who are the notable companies in the sleep optimization wearable market?
Oura Health Oy, Whoop, Inc., Apple Inc., Samsung Electronics Co., Ltd., Garmin Ltd., Google LLC, Ultrahuman Healthcare Pvt. Ltd., Withings SA, RingConn Ltd. and Elemind Technologies, Inc. are notable companies profiled in this market.
Sleep optimization wearable market is moderately fragmented with ring manufacturers, smartwatch companies and sleep headband developers. Oura Health Oy, Ultrahuman Healthcare Pvt. Ltd. and RingConn Ltd. are focusing on finger-worn sleep and recovery information. Apple Inc., Samsung Electronics Co., Ltd., Garmin Ltd., Google LLC and Whoop, Inc. combine sleep with wider health and fitness functions. Elemind Technologies, Inc. provides EEG-guided acoustic support through a headband. Some of the prominent players are expanding sizes, battery duration and subscription services in order to increase its customer base.
- Ring-centered sleep and recovery platforms: Oura Health Oy; Ultrahuman Healthcare Pvt. Ltd.; RingConn Ltd.
- Wrist-worn health and performance platforms: Whoop, Inc.; Apple Inc.; Samsung Electronics Co., Ltd.; Garmin Ltd.; Google LLC; Withings SA.
- EEG-guided sleep intervention: Elemind Technologies, Inc.
Competitive Benchmarking: Sleep Optimization Wearable Market
Table 6: Competitive Benchmarking for the Sleep Optimization Wearable Market (qualitative capability ratings), 2026
| Company | Sleep Measurement | Personalized Guidance | Physical Cues | Reach |
|---|---|---|---|---|
| Oura Health Oy | High | High | Low | High |
| Whoop, Inc. | High | High | Low | High |
| Apple Inc. | High | Medium | Low | High |
| Samsung Electronics Co., Ltd. | High | High | Low | High |
| Garmin Ltd. | High | High | Medium | High |
| Google LLC | High | High | Low | High |
| Ultrahuman Healthcare Pvt. Ltd. | High | High | Low | High |
| Withings SA | Medium | Medium | Low | Medium |
| RingConn Ltd. | Medium | Medium | Low | Medium |
| Elemind Technologies, Inc. | Medium | Medium | High | Medium |
High indicates wider documented functions or reach, Medium indicates limited functions or regional coverage, and Low indicates a documented limitation. Ratings do not indicate product quality, clinical effectiveness, company rank or market share.
Key Developments in the Sleep Optimization Wearable Market
- In May 2026, Oura Health Oy introduced Oura Ring 5 with a design that was 40% smaller and included twelve signal pathways.[5]
- In February 2026, Ultrahuman Healthcare Pvt. Ltd. announced Ring PRO with a stated 15-day battery and Jade software.[13]
- In May 2026, Google LLC announced the Google Health app as the successor to the Fitbit app.[14]
Key Players in the Sleep Optimization Wearable Market
Ring-centered sleep and recovery platforms
- Oura Health Oy
- Ultrahuman Healthcare Pvt. Ltd.
- RingConn Ltd.
Wrist-worn health and performance platforms
- Whoop, Inc.
- Apple Inc.
- Samsung Electronics Co., Ltd.
- Garmin Ltd.
- Google LLC
- Withings SA
EEG-guided sleep intervention
- Elemind Technologies, Inc.
Sleep Optimization Wearable Market - Report Scope
Table 7: Report Scope for the Sleep Optimization Wearable Market (coverage fields and definitions), 2026 to 2036
| Coverage field | Report scope |
|---|---|
| Market breakdown | Product type; technology; application; sales channel; consumer group |
| Quantitative units | USD billion |
| Market definition | Revenue from wearable products and integral sleep-related software attributable to sleep optimization. Nonwearable monitors, unrelated apps, diagnostic services, medicines and CPAP systems are excluded. |
| Regions covered | North America; Latin America; Western Europe; Eastern Europe; East Asia; South Asia and Pacific; Middle East and Africa |
| Countries covered | Japan; Canada; Finland; Germany; USA; UK; South Korea |
| Key companies profiled | Oura; WHOOP; Apple; Samsung; Garmin; Google; Ultrahuman; Withings; RingConn; Elemind |
| Forecast period | 2026 to 2036 |
| Approach | Primary and secondary research with market triangulation. |
Sleep Optimization Wearable Market - Research Methodology
Table 8: Research Methodology for the Sleep Optimization Wearable Market (research methods and approach), 2026 edition
| Method | Approach |
|---|---|
| Primary Research | Primary interviews gathered information from manufacturers, technology developers, distributors, retailers, end users and industry experts. Interviews covers product demand, price, subscription, adoption barrier and technical support requirement. |
| Desk Research | Desk research covered government statistics, regulatory publications, company announcements, filings, technical literature and product information. |
| Market Sizing and Forecasting | Market sizing combines base-year value, product price, segment structure, adoption, company activity and country demand conditions. |
| Data Validation | Market estimates are checked with public data, company activity, product launches, regulatory records and primary research. |
Sleep Optimization Wearable Market by Segments
Sleep Optimization Wearable Market segmented by Product Type:
- Smart Rings
- Wristbands and Smartwatches
- Headbands and Neurostimulation Wearables
- Sleep Masks and Earbuds
Sleep Optimization Wearable Market segmented by Technology:
- Photoplethysmography and Accelerometry
- EEG-based Monitoring
- Temperature and Respiration Sensing
- Active Intervention Technologies
Sleep Optimization Wearable Market segmented by Application:
- Sleep Tracking and Insight
- Sleep Enhancement and Intervention
- Sleep Disorder Screening
- Performance and Wellness Coaching
Sleep Optimization Wearable Market segmented by Sales Channel:
- Online Retail
- Consumer Electronics Stores
- Specialty Stores
- Direct-to-Consumer Websites
Sleep Optimization Wearable Market segmented by Consumer Group:
- Wellness-Focused Adults
- Athletes and Performance Users
- Older Adults and Clinical Users
Sleep Optimization Wearable Market by Region
- North America
- United States
- Canada
- Latin America
- Brazil
- Mexico
- Argentina
- Chile
- Western Europe
- Germany
- France
- United Kingdom
- Italy
- Spain
- Benelux
- Nordics
- Eastern Europe
- Poland
- Czech Republic
- Romania
- Hungary
- East Asia
- Japan
- South Korea
- South Asia and Pacific
- India
- ASEAN
- Australia and New Zealand
- Middle East and Africa
- GCC Countries
- South Africa
- Türkiye
- Israel
Research Sources and Bibliography
- [1] National Center for Health Statistics. (2026, April 29). Short sleep duration and sleep difficulties among adults: United States, 2024.
- [2] Public Health Agency of Canada. (2026, January 21). Physical activity, sedentary behaviour and sleep indicators: Key findings.
- [3] Robert Koch Institute. (2026, July 16). Federal health reporting.
- [4] Office for National Statistics. (2026, February 27). Beyond GDP insights, UK headline measures of national well-being: February 2026.
- [5] Oura Team. (2026, May 28). Introducing Oura Ring 5: The world’s smallest smart ring.
- [6] Samsung Electronics. (2025, January 13). Samsung leads sleep technology with Galaxy Ring expansion and Samsung Health app update.
- [7] Apple. (2025, September 9). Apple debuts Apple Watch Series 11.
- [8] Garmin. (2025, April 1). Meet vívoactive 6, the latest health and fitness smartwatch from Garmin.
- [9] Schyvens, A.-M., et al. (2025, March 22). A performance validation of six commercial wrist-worn wearable sleep-tracking devices.
- [10] WHOOP. (2026, August). WHOOP launches Connected Care to help eligible Medicare beneficiaries better understand their health.
- [11] Oura. (2026, May 20). Oura on pace to surpass five million paid members this quarter.
- [12] Oura Team. (2025, November 3). Oura Ring 4 and Oura Ring 4 Ceramic Now Available at Walmart.
- [13] Ultrahuman. (2026, February 27). Ultrahuman Unveils Ring PRO, With Category-Defining 15-Day Battery and Jade.
- [14] Google. (2026, May 18). Introducing the Google Health app.
- [15] Oura Team. (2026, June 23). Oura and LillyDirect to Expand Support for People Using GLP-1 Therapies.
- [16] Statistics Finland. (Updated 2026, March 6). Statistics on living conditions.
- [17] RingConn. (2026, May 10). RingConn Gen 3 Smart Ring Opens for Pre-Order.
- [18] Withings. (2025, September 5). Discover ScanWatch 2 2025 Edition.
- [19] Elemind. (2026). Elemind official product page.
This bibliography is provided for reader reference. The full report contains the complete reference list and detailed citations.
This Report Answers
- How large is the Sleep Optimization Wearable Market in 2026?
- What value is projected by 2036?
- Which product type holds a notable share?
- Which technology holds a notable share?
- Which country has a notable expansion outlook?
- Which companies are notable in the market?
Frequently Asked Questions
How large is the Sleep Optimization Wearable Market in 2026?
Future Market Insights estimates that the sleep optimization wearable market will be valued at USD 2.6 billion in 2026. The market is projected to reach USD 8.6 billion by 2036.
What CAGR is projected for the Sleep Optimization Wearable Market through 2036?
As per FMI, the sleep optimization wearable market is projected to grow at 12.6% CAGR from 2026 to 2036. Wider use of rings and watches for regular sleep information is supporting the market growth.
Which product type leads the Sleep Optimization Wearable Market in 2026?
Smart rings are projected to hold 40.7% of product type revenue in 2026. The segment benefits from compact size and continuous overnight skin contact.
Which technology holds a leading share in the market during 2026?
Photoplethysmography and accelerometry are estimated to account for 64.5% of technology revenue in 2026. Demand is supported by integration of optical and movement sensors in compact wearables.
Which country has a notable growth outlook during the assessment period?
Japan is projected to register 16.3% CAGR from 2026 to 2036. Domestic ring availability, wider sizes and local product support are expected to support growth.
Who are the key companies in the Sleep Optimization Wearable Market?
Key participants include Oura Health Oy, Whoop, Inc., Apple Inc., Samsung Electronics Co., Ltd., Garmin Ltd., Google LLC, Ultrahuman Healthcare Pvt. Ltd., Withings SA, RingConn Ltd. and Elemind Technologies, Inc. These companies are expanding ring, wrist and headband products with sleep measurement and guidance functions.
Preview the report firsthand - request a free sample
Get SampleGet the brochure for pricing and purchase details.
Get PDFTable of Content
- Key Takeaways
- Market Size and CAGR
- Top Growth Driver
- Fastest Growing Segment
- Leading Region
- Key Companies
- Emerging Opportunities
- Executive Summary
- Global Market Outlook
- Demand-side Trends
- Supply-side Trends
- Technology Roadmap Analysis
- Analysis and Recommendations
- Analyst Perspective (What is happening? Why now? What should investors know?)
- Key Questions Answered
- How large is the market?
- What is the CAGR?
- What are key trends?
- Which region dominates?
- Who are the leaders?
- Market Overview
- Market Coverage / Taxonomy
- Market Definition / Scope / Limitations
- Research Methodology
- Chapter Orientation
- Analytical Lens and Working Hypotheses
- Market Structure, Signals, and Trend Drivers
- Benchmarking and Cross-market Comparability
- Market Sizing, Forecasting, and Opportunity Mapping
- Research Design and Evidence Framework
- Desk Research Programme (Secondary Evidence)
- Expert Input and Fieldwork (Primary Evidence)
- Tooling, Models, and Reference Databases
- Data Engineering and Model Build
- Quality Assurance and Audit Trail
- Market Background
- Market Dynamics (Drivers, Restraints, Opportunity, Trends)
- Scenario Forecast (Optimistic, Likely, Conservative)
- Impact Analysis
- AI Impact
- Sustainability Impact
- Regulatory Impact
- Technology Impact
- Consumer / Buyer Analysis
- Purchase Drivers
- Adoption Barriers
- Buyer Journey
- Opportunity Map Analysis
- Product Life Cycle Analysis
- Supply Chain Analysis
- Investment Feasibility Matrix
- Value Chain Analysis
- PESTLE and Porter's Analysis
- Regulatory Landscape
- Regional Parent Market Outlook
- Production and Consumption Statistics
- Import and Export Statistics
- Global Market Analysis and Forecast, 2021 to 2036
- Historical Market Size Value (USD Billion) Analysis, 2021 to 2025
- Current and Future Market Size Value (USD Billion) Projections, 2026 to 2036
- Y-o-Y Growth Trend Analysis
- Absolute $ Opportunity Analysis
- Global Market Pricing Analysis, 2021 to 2036
- Global Market Analysis and Forecast, By Product Type, 2021 to 2036
- Introduction / Key Findings
- Historical Market Size Value (USD Billion) Analysis By Product Type, 2021 to 2025
- Current and Future Market Size Value (USD Billion) Analysis and Forecast By Product Type, 2026 to 2036
- Smart Rings
- Wristbands and Smartwatches
- Headbands and Neurostimulation Wearables
- Sleep Masks and Earbuds
- Y-o-Y Growth Trend Analysis By Product Type, 2021 to 2025
- Absolute $ Opportunity Analysis By Product Type, 2026 to 2036
- Global Market Analysis and Forecast, By Technology, 2021 to 2036
- Introduction / Key Findings
- Historical Market Size Value (USD Billion) Analysis By Technology, 2021 to 2025
- Current and Future Market Size Value (USD Billion) Analysis and Forecast By Technology, 2026 to 2036
- Photoplethysmography and Accelerometry
- EEG-based Monitoring
- Temperature and Respiration Sensing
- Active Intervention Technologies
- Y-o-Y Growth Trend Analysis By Technology, 2021 to 2025
- Absolute $ Opportunity Analysis By Technology, 2026 to 2036
- Global Market Analysis and Forecast, By Application, 2021 to 2036
- Introduction / Key Findings
- Historical Market Size Value (USD Billion) Analysis By Application, 2021 to 2025
- Current and Future Market Size Value (USD Billion) Analysis and Forecast By Application, 2026 to 2036
- Sleep Tracking and Insight
- Sleep Enhancement and Intervention
- Sleep Disorder Screening
- Performance and Wellness Coaching
- Y-o-Y Growth Trend Analysis By Application, 2021 to 2025
- Absolute $ Opportunity Analysis By Application, 2026 to 2036
- Global Market Analysis and Forecast, By Sales Channel, 2021 to 2036
- Introduction / Key Findings
- Historical Market Size Value (USD Billion) Analysis By Sales Channel, 2021 to 2025
- Current and Future Market Size Value (USD Billion) Analysis and Forecast By Sales Channel, 2026 to 2036
- Online Retail
- Consumer Electronics Stores
- Specialty Stores
- Direct-to-Consumer Websites
- Y-o-Y Growth Trend Analysis By Sales Channel, 2021 to 2025
- Absolute $ Opportunity Analysis By Sales Channel, 2026 to 2036
- Global Market Analysis and Forecast, By Consumer Group, 2021 to 2036
- Introduction / Key Findings
- Historical Market Size Value (USD Billion) Analysis By Consumer Group, 2021 to 2025
- Current and Future Market Size Value (USD Billion) Analysis and Forecast By Consumer Group, 2026 to 2036
- Wellness-Focused Adults
- Athletes and Performance Users
- Older Adults and Clinical Users
- Y-o-Y Growth Trend Analysis By Consumer Group, 2021 to 2025
- Absolute $ Opportunity Analysis By Consumer Group, 2026 to 2036
- Global Market Analysis and Forecast, By Region, 2021 to 2036
- Introduction
- Historical Market Size Value (USD Billion) Analysis By Region, 2021 to 2025
- Current Market Size Value (USD Billion) Analysis and Forecast By Region, 2026 to 2036
- North America
- Latin America
- Western Europe
- Eastern Europe
- East Asia
- South Asia and Pacific
- Middle East and Africa
- Market Attractiveness Analysis By Region
- North America Market Analysis and Forecast, By Country, 2021 to 2036
- Historical Market Size Value (USD Billion) Trend Analysis By Market Taxonomy, 2021 to 2025
- Market Size Value (USD Billion) Forecast By Market Taxonomy, 2026 to 2036
- By Country
- United States
- Canada
- By Product Type
- By Technology
- By Application
- By Sales Channel
- By Consumer Group
- By Country
- Market Attractiveness Analysis
- By Country
- By Product Type
- By Technology
- By Application
- By Sales Channel
- By Consumer Group
- Key Takeaways
- Latin America Market Analysis and Forecast, By Country
- Historical Market Size Value (USD Billion) Trend Analysis By Market Taxonomy, 2021 to 2025
- Market Size Value (USD Billion) Forecast By Market Taxonomy, 2026 to 2036
- By Country
- Brazil
- Mexico
- Argentina
- Chile
- By Product Type
- By Technology
- By Application
- By Sales Channel
- By Consumer Group
- By Country
- Market Attractiveness Analysis
- By Country
- By Product Type
- By Technology
- By Application
- By Sales Channel
- By Consumer Group
- Key Takeaways
- Western Europe Market Analysis and Forecast, By Country
- Historical Market Size Value (USD Billion) Trend Analysis By Market Taxonomy, 2021 to 2025
- Market Size Value (USD Billion) Forecast By Market Taxonomy, 2026 to 2036
- By Country
- Germany
- France
- United Kingdom
- Italy
- Spain
- Benelux
- Nordics
- By Product Type
- By Technology
- By Application
- By Sales Channel
- By Consumer Group
- By Country
- Market Attractiveness Analysis
- By Country
- By Product Type
- By Technology
- By Application
- By Sales Channel
- By Consumer Group
- Key Takeaways
- Eastern Europe Market Analysis and Forecast, By Country
- Historical Market Size Value (USD Billion) Trend Analysis By Market Taxonomy, 2021 to 2025
- Market Size Value (USD Billion) Forecast By Market Taxonomy, 2026 to 2036
- By Country
- Poland
- Czech Republic
- Romania
- Hungary
- By Product Type
- By Technology
- By Application
- By Sales Channel
- By Consumer Group
- By Country
- Market Attractiveness Analysis
- By Country
- By Product Type
- By Technology
- By Application
- By Sales Channel
- By Consumer Group
- Key Takeaways
- East Asia Market Analysis and Forecast, By Country
- Historical Market Size Value (USD Billion) Trend Analysis By Market Taxonomy, 2021 to 2025
- Market Size Value (USD Billion) Forecast By Market Taxonomy, 2026 to 2036
- By Country
- Japan
- South Korea
- By Product Type
- By Technology
- By Application
- By Sales Channel
- By Consumer Group
- By Country
- Market Attractiveness Analysis
- By Country
- By Product Type
- By Technology
- By Application
- By Sales Channel
- By Consumer Group
- Key Takeaways
- South Asia and Pacific Market Analysis and Forecast, By Country
- Historical Market Size Value (USD Billion) Trend Analysis By Market Taxonomy, 2021 to 2025
- Market Size Value (USD Billion) Forecast By Market Taxonomy, 2026 to 2036
- By Country
- India
- ASEAN
- Australia and New Zealand
- By Product Type
- By Technology
- By Application
- By Sales Channel
- By Consumer Group
- By Country
- Market Attractiveness Analysis
- By Country
- By Product Type
- By Technology
- By Application
- By Sales Channel
- By Consumer Group
- Key Takeaways
- Middle East and Africa Market Analysis and Forecast, By Country
- Historical Market Size Value (USD Billion) Trend Analysis By Market Taxonomy, 2021 to 2025
- Market Size Value (USD Billion) Forecast By Market Taxonomy, 2026 to 2036
- By Country
- GCC Countries
- South Africa
- Türkiye
- Israel
- By Product Type
- By Technology
- By Application
- By Sales Channel
- By Consumer Group
- By Country
- Market Attractiveness Analysis
- By Country
- By Product Type
- By Technology
- By Application
- By Sales Channel
- By Consumer Group
- Key Takeaways
- Key Countries Market Analysis
- United States
- Pricing Analysis
- Market Share Analysis, 2025
- By Product Type
- By Technology
- By Application
- By Sales Channel
- By Consumer Group
- Canada
- Pricing Analysis
- Market Share Analysis, 2025
- By Product Type
- By Technology
- By Application
- By Sales Channel
- By Consumer Group
- Mexico
- Pricing Analysis
- Market Share Analysis, 2025
- By Product Type
- By Technology
- By Application
- By Sales Channel
- By Consumer Group
- Brazil
- Pricing Analysis
- Market Share Analysis, 2025
- By Product Type
- By Technology
- By Application
- By Sales Channel
- By Consumer Group
- Chile
- Pricing Analysis
- Market Share Analysis, 2025
- By Product Type
- By Technology
- By Application
- By Sales Channel
- By Consumer Group
- Germany
- Pricing Analysis
- Market Share Analysis, 2025
- By Product Type
- By Technology
- By Application
- By Sales Channel
- By Consumer Group
- United Kingdom
- Pricing Analysis
- Market Share Analysis, 2025
- By Product Type
- By Technology
- By Application
- By Sales Channel
- By Consumer Group
- Italy
- Pricing Analysis
- Market Share Analysis, 2025
- By Product Type
- By Technology
- By Application
- By Sales Channel
- By Consumer Group
- Spain
- Pricing Analysis
- Market Share Analysis, 2025
- By Product Type
- By Technology
- By Application
- By Sales Channel
- By Consumer Group
- France
- Pricing Analysis
- Market Share Analysis, 2025
- By Product Type
- By Technology
- By Application
- By Sales Channel
- By Consumer Group
- India
- Pricing Analysis
- Market Share Analysis, 2025
- By Product Type
- By Technology
- By Application
- By Sales Channel
- By Consumer Group
- ASEAN
- Pricing Analysis
- Market Share Analysis, 2025
- By Product Type
- By Technology
- By Application
- By Sales Channel
- By Consumer Group
- Australia and New Zealand
- Pricing Analysis
- Market Share Analysis, 2025
- By Product Type
- By Technology
- By Application
- By Sales Channel
- By Consumer Group
- Japan
- Pricing Analysis
- Market Share Analysis, 2025
- By Product Type
- By Technology
- By Application
- By Sales Channel
- By Consumer Group
- South Korea
- Pricing Analysis
- Market Share Analysis, 2025
- By Product Type
- By Technology
- By Application
- By Sales Channel
- By Consumer Group
- Poland
- Pricing Analysis
- Market Share Analysis, 2025
- By Product Type
- By Technology
- By Application
- By Sales Channel
- By Consumer Group
- Hungary
- Pricing Analysis
- Market Share Analysis, 2025
- By Product Type
- By Technology
- By Application
- By Sales Channel
- By Consumer Group
- Türkiye
- Pricing Analysis
- Market Share Analysis, 2025
- By Product Type
- By Technology
- By Application
- By Sales Channel
- By Consumer Group
- South Africa
- Pricing Analysis
- Market Share Analysis, 2025
- By Product Type
- By Technology
- By Application
- By Sales Channel
- By Consumer Group
- Finland
- Pricing Analysis
- Market Share Analysis, 2025
- By Product Type
- By Technology
- By Application
- By Sales Channel
- By Consumer Group
- United States
- Market Structure Analysis
- Competition Dashboard
- Competition Benchmarking
- Market Share Analysis of Top Players
- By Regional
- By Product Type
- By Technology
- By Application
- By Sales Channel
- By Consumer Group
- Emerging Startups
- Innovation Benchmarking
- Competition Analysis
- Competition Deep Dive
- Oura Health Oy
- Overview
- Product Portfolio
- Profitability by Market Segments
- Sales Footprint
- Strategy Overview
- Marketing Strategy
- Product Strategy
- Channel Strategy
- Whoop, Inc.
- Apple Inc.
- Samsung Electronics Co., Ltd.
- Garmin Ltd.
- Google LLC
- Ultrahuman Healthcare Pvt. Ltd.
- Withings SA
- RingConn Ltd.
- Elemind Technologies, Inc.
- Oura Health Oy
- Case Studies
- Success Stories
- Recent Developments
- Competition Deep Dive
- Assumptions & Acronyms Used


