Reports

- Global Locations -

Headquarters

Future Market Insights, Inc.

Christiana Corporate, 200
Continental Drive, Suite 401,
Newark, Delaware - 19713,
United States

T: +1-845-579-5705

Americas

Future Market Insights, Inc.

616 Corporate Way, Suite 2-9018,
Valley Cottage, NY 10989, United States

T: +1-347-918-3531

MEA

Future Market Insights

1602-6 Jumeirah Bay X2 Tower, Plot No: JLT-PH2-X2A,
Jumeirah Lakes Towers, Dubai,
United Arab Emirates

Europe

Future Market Insights

3rd Floor, 207 Regent Street,
W1B 3HH London
United Kingdom

T: + 44 (0) 20 8123 9659
D: +44 (0) 20 3287 4268

Asia Pacific

Future Market Insights

IndiaLand Global Tech Park, Unit UG-1, Behind Grand HighStreet, Phase 1, Hinjawadi, MH, Pune – 411057, India

Smart Motors Market Outlook (2023 to 2033)

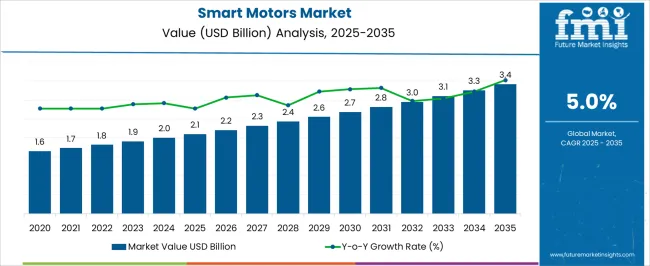
In 2023, the worldwide smart motors market achieved a valuation of US$ 1.9 billion, and it is anticipated to expand at a steady pace of 5.2% between 2023 and 2033, ultimately reaching an impressive value of US$ 3.2 billion by 2033.

Revolutionary variable speed drives (VSDs) in smart motors efficiently adjust rotation speed, conserving 25-30% energy. This transformative technology supports industry growth, paving the way for a promising future.

The market demand for smart motors is anticipated to spike significantly throughout the forecast period as a result of strict restrictions relating to carbon emissions by regulatory organizations such as the US Environmental Protection Agency (EPA) and the European Union.

Attributes Details
Smart Motors Market Value (2023) US$ 1.9 billion
Smart Motors Market Value (2033) US$ 3.2 billion
Smart Motors Market Growth Rate (2023 to 2033) 5.2%

Don't pay for what you don't need

Customize your report by selecting specific countries or regions and save 30%!

What is the 2023 to 2033 Smart Motors Market Outlook in Comparison to 2018 to 2022 Growth?

Based on FMI research findings, the global smart motors market exhibited a valuation of around US$ 1.8 billion in 2022 as compared to the projected value of US$ 1.9 billion in 2023 and eventually reaching around US$ 3.2 billion by 2033.

The market has witnessed significant growth from 2018 to 2022, with increasing demand and technological advancements driving the market expansion. With the continuous integration of smart technologies and the rising need for energy efficiency across various industries, the smart motors industry is predicted to experience significant growth and surpass the achievements of the previous years.

The market is projected to exhibit substantial expansion, presenting key opportunities and demonstrating a notable advancement in terms of market size, revenue, and adoption.

As per FMI, the market for smart motors is predicted to advance at a CAGR of 5.2% from 2023 to 2033.

What are the Growth Prospects for the Smart Motors Industry?

  • The escalating cost of fossil fuels, driven by intense competition, has created a demand for energy-efficient solutions.
  • Smart motors have experienced peaked adoption in the industrial sector, finding applications in mixers, extruders, pumps, fans, compressors, vibrator motors, wire, and drawing machines.
  • Integration of smart motor controllers in automation processes contributes to energy conservation.
  • Intelligent motors control (IMC) systems monitor motor load conditions and adjust voltage input accordingly, providing energy efficiency gains of up to 3-5%.
  • Growing concerns over carbon emissions and the need to reduce reliance on fossil fuels have led to the implementation of emission control standards and policies promoting the adoption of electric vehicles worldwide.
  • The rising adoption of electric vehicles has subsequently fueled the development of the intelligent motors market.
  • The automotive industry, particularly electric vehicle manufacturers, is placing increasing emphasis on the adoption of smart, flexible, and integrated solutions, thereby driving the demand for smart motor control systems in automobiles.

How is the Market Projected to Expand due to the Rising Demand for Industrial Automation, Robotics, and Efficient Material Handling Solutions?

  • Growing demand for industrial automation, robotics, and efficient material handling solutions is projected to drive market expansion.
  • Increased adoption of automated systems and robotics in industries leads to improved productivity, operational efficiency, and cost savings.
  • Efficient material handling solutions enable streamlined processes, reducing manual labor and enhancing overall operational effectiveness.
  • Advancements in technology, such as AI, machine learning, and IoT, are facilitating the integration of automation and robotics into various industries.
  • The need for optimized workflows, enhanced safety measures, and precise material handling capabilities is fueling the demand for industrial automation solutions.
  • Rising focus on achieving high production output, reducing errors, and minimizing downtime is propelling the market growth for these solutions.
  • Increasing awareness about the benefits of industrial automation, robotics, and efficient material handling solutions is driving their adoption across diverse industries.
  • Market players are continually innovating and offering advanced solutions to cater to the evolving needs of industries, further boosting market expansion.

What are the Limitations and Challenges Faced by the Smart Motors Industry?

  • Limited awareness and understanding of smart motor technology among potential users and stakeholders.
  • High initial costs associated with implementing smart motor systems, including the purchase of equipment and installation expenses.
  • Integration challenges when upgrading existing systems to incorporate smart motor technology.
  • Compatibility issues with legacy equipment and infrastructure, requiring additional investments or modifications.
  • Technical complexities related to programming, maintenance, and troubleshooting of smart motor systems.
  • Dependence on the reliable power supply and potential disruptions in case of power outages or electrical disturbances.
  • Data security and privacy concerns arising from the connectivity and digitalization of smart motor systems.
  • Regulatory and compliance requirements that may vary across different regions or industries, impacting the adoption and implementation of smart motor technology.
  • Resistance to change or lack of willingness to embrace new technologies and adapt to smart motor systems in some organizations.

Comparative View of the Smart Motors Market

Smart Motors Market:

Attributes Smart Motors Market
CAGR (2023 to 2033) 5.2%
Market Value (2033) US$ 3.2 billion
Opportunity Integration of smart motors in renewable energy systems for enhanced efficiency, control, and seamless integration with smart grids amidst global sustainability goals.
Key Trends Increasing adoption of IoT and connectivity technologies in smart motors, enabling real-time monitoring, predictive maintenance, energy optimization, and improved operational performance.

Electric Utility Vehicles Market:

Attributes Electric Utility Vehicles Market
CAGR (2023 to 2033) 15.4%
Market Value (2033) US$ 38.55 billion
Opportunity Government initiatives worldwide provide a significant opportunity for market growth, supported by increasing regulatory support and incentives.
Key Trends The burgeoning e-commerce market is the key trend in the market as the demand for efficient, eco-friendly electric utility vehicles is set to soar with the rapid expansion of online retail and last-mile delivery services, driving the market growth.

Electric Motor Market:

Attributes Electric Motor Market
CAGR (2023 to 2033) 6.64%
Market Value (2033) US$ 252.6 billion
Opportunity Both developed and developing countries are poised to present substantial growth prospects for the product, driven by new unit installations and replacement sales.
Key Trends The market experiences growth propelled by the rise in urbanization, creating favorable conditions for expansion and development.
Nikhil Kaitwade
Nikhil Kaitwade

Principal Consultant

Talk to Analyst

Find your sweet spots for generating winning opportunities in this market.

Country-wise Insights

Country The United States of America
CAGR (2023 to 2033) 4.1%
Market Size (2033) US$ 1 billion
Country The United Kingdom
CAGR (2023 to 2033) 4.4%
Market Size (2033) US$ 153.7 million
Country China
CAGR (2023 to 2033) 6.2%
Market Size (2033) US$ 257.3 million
Country Japan
CAGR (2023 to 2033) 4.7%
Market Size (2033) US$ 217.4 million
Country South Korea
CAGR (2023 to 2033) 5.6%
Market Size (2033) US$ 121.3 million

What can be Attributed to the Supremacy of the Market in the United States of America?

The supremacy of the smart motors market in the United States of America can be attributed to multiple factors that are contributing to the country’s anticipated growth rate of 4.1% during the forecast period, touching US$ 1 billion in 2033.

The country's strong industrial sector, encompassing manufacturing, automotive, and aerospace industries, drives the demand for smart motors.

The United States has a culture of technological innovation and adoption, with significant investments in research and development. Supportive government initiatives, favorable regulatory frameworks, and incentives for energy efficiency contribute to market dominance.

The presence of established market players, technological expertise, and a large customer base further solidify the United States' position as a leader in the smart motors market.

The market demand for smart motors in the region is expected to be driven further by the increased need to adopt energy-efficient solutions, fueled by stringent environmental regulations set by the US Environmental Protection Agency. These regulations, aimed at reducing carbon emissions, have created a growing necessity for businesses to embrace energy-efficient technologies such as smart motors. As a result, the market for smart motors is anticipated to expand as organizations strive to comply with environmental regulations while optimizing their energy consumption.

What Factors Contribute to the Market Potential and Opportunities for the Smart Motors Industry in the United Kingdom?

The market potential and opportunities for the smart motors industry in the United Kingdom are driven by supportive government initiatives as they play a significant role in creating a conducive environment for the adoption of smart motors.

The United Kingdom government has implemented policies, regulations, and incentives that prioritize energy efficiency and sustainability, thereby promoting the use of smart motors across various sectors. The increasing focus on energy efficiency and carbon emissions reduction drives the demand for smart motors.

There is a growing preference for energy-efficient solutions as organizations and individuals become aware of the importance of energy conservation. Smart motors offer enhanced efficiency, control, and optimization of energy consumption, making them a compelling choice.

As per the FMI study, the market for smart motors in the United Kingdom is anticipated to garner revenue of US$ 153.7 million by 2033, securing a 4.4% CAGR from 2023 to 2033.

How is the Smart Motors Industry in China Evolving?

The notable industrial manufacturing sector in China is mostly attributed to the country’s projected market share of US$ 257.3 million in 2033. As per FMI, the market for smart motors in China is likely to move forward at 6.2% CAGR in the forthcoming years.

Due to supportive government initiatives like "Make in China 2025," which is likely to encourage the use of smart motors in a variety of industries and thereby increase market demand, the industrial sector in the country is also predicted to experience massive growth.

China's growing emphasis on renewable energy and sustainability has provided a significant boost to the smart motors market. Smart motors are increasingly being utilized in renewable energy generation and distribution systems to optimize efficiency, control, and integration with smart grids.

Category-wise Insights

Which Sub-segment is Likely to be at the Forefront of the Market by Product Type?

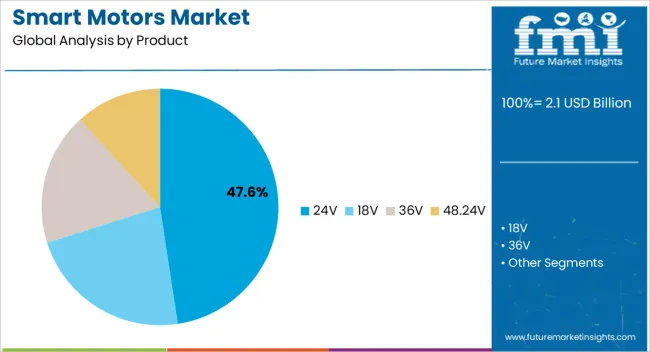
The 24V sub-segment is anticipated progress at a CAGR of 5.1% from 2023 to 2033 on the global level.

Excellent power and reliability are factors that boost the segment's growth. Even while operating under a heavy load, it does so quietly and smoothly, making it suited for heavy loads in a small space. However, it can also be utilized as an industrial-grade continuous usage motor because it offers strong and dependable performance. Additionally, it provides industrial power tools with high torque and economy as well as robotic applications.

The sub-segment supremacy can be attributed mostly to low cost, extended life, high reliability, precise operation, and efficient operation without losses. Moreover, it provides incredibly silent operation and is appropriate for applications that require minimum audible noise.

Which Application is Gaining Prominence in the Market?

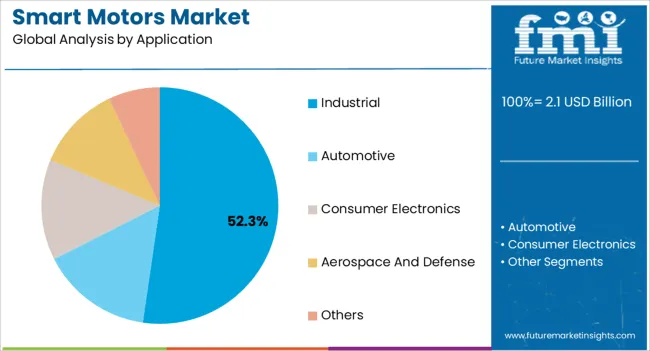
By the end of the forecast period, it is anticipated that the industrial application segment is likely to capture a huge market share with a CAGR of 5.0% from 2023 to 2033.

Smart motors are extensively utilized in industries due to their remarkable energy efficiency and effectiveness. They find wide-ranging applications in various industrial processes, including compressors, conveyor systems, automation, and material handling.

The growing global focus on regulations concerning carbon emissions has generated a heightened emphasis on the adoption of energy-efficient solutions in industries. As a result, the demand for smart motors in the industrial sector has witnessed an upsurge, driven by the need to reduce energy consumption, propelling the market growth.
Get the data you need at a Fraction of the cost

Personalize your report by choosing insights you need
and save 40%!

What is the Competitive Landscape in the Market for Smart Motors?

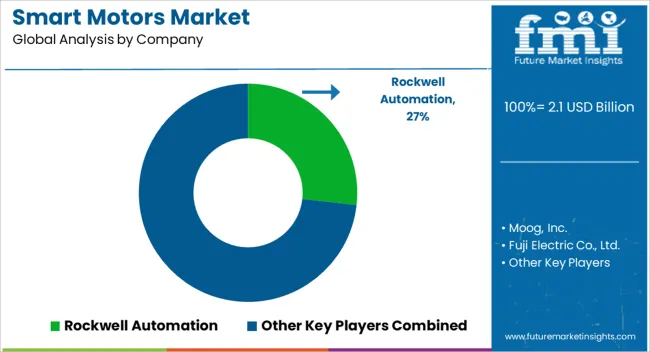
The smart motors industry is characterized by intense competition, due to the presence of numerous prominent companies offering smart motor products. The companies present in the market actively engage in strategic partnerships and product advancements as part of their ongoing efforts to expand their market share.

Key Players invest significant resources in fostering strategic collaborations with other industry players, aiming to leverage complementary strengths and enhance their market position. Additionally, these companies prioritize continuous product development, introducing innovative features and technologies to meet evolving customer demands and stay ahead in the competitive landscape.

Key Players in the Market

  • Rockwell Automation
  • Moog, Inc.
  • Fuji Electric Co., Ltd.
  • ABB Ltd.
  • Siemens AG
  • Schneider Electric SE
  • General Electric
  • Dunkermotoren GmbH
  • Technosoft SA
  • RobotShop, Inc.
  • Roboteq, Inc.

Developments in the Market:

  • WEG introduced the CFW900, an advanced variable-speed drive for induction and permanent magnet motors, offering precise control and high performance across various applications.
  • ABB unveiled the FusionAir Smart Sensor, enhancing indoor air quality by monitoring temperature, humidity, CO2, and VOCs.
  • Rockwell expanded its capabilities with the acquisition of Fiix Inc., a cloud software company specializing in maintenance solutions.

Market Segmentation by Category

By Product:

  • 24V
  • 18V
  • 36V
  • 48.24V

By Application:

  • Industrial
  • Automotive
  • Consumer Electronics
  • Aerospace and Defense
  • Others

By Region:

  • North America
  • Latin America
  • Europe
  • Asia Pacific
  • The Middle East and Africa

Frequently Asked Questions

What is the Growth Potential of the Smart Motors Market?

The growth potential of the gastrointestinal stent market is 5.2% through 2033.

What Limits the Growth Potential of the Market?

The rising cost is likely to limit market growth.

What is the United States Expected CAGR by 2033?

The United States is likely to capture a CAGR of 4.1% by 2033.

How Big will the Market be in China by 2033?

The market in China will capture a CAGR of 6.2% by 2033.

Which Country is Set to Register Exponential Growth in the Smart Motors Market?

The United States, the United Kingdom and China may witness significant growth in the market.

Table of Content

1. Executive Summary

    1.1. Global Market Outlook

    1.2. Demand-side Trends

    1.3. Supply-side Trends

    1.4. Technology Roadmap Analysis

    1.5. Analysis and Recommendations

2. Market Overview

    2.1. Market Coverage / Taxonomy

    2.2. Market Definition / Scope / Limitations

3. Market Background

    3.1. Market Dynamics

        3.1.1. Drivers

        3.1.2. Restraints

        3.1.3. Opportunity

        3.1.4. Trends

    3.2. Scenario Forecast

        3.2.1. Demand in Optimistic Scenario

        3.2.2. Demand in Likely Scenario

        3.2.3. Demand in Conservative Scenario

    3.3. Opportunity Map Analysis

    3.4. Product Life Cycle Analysis

    3.5. Supply Chain Analysis

        3.5.1. Supply Side Participants and their Roles

            3.5.1.1. Producers

            3.5.1.2. Mid-Level Participants (Traders/ Agents/ Brokers)

            3.5.1.3. Wholesalers and Distributors

        3.5.2. Value Added and Value Created at Node in the Supply Chain

        3.5.3. List of Raw Material Suppliers

        3.5.4. List of Existing and Potential Buyer’s

    3.6. Investment Feasibility Matrix

    3.7. Value Chain Analysis

        3.7.1. Profit Margin Analysis

        3.7.2. Wholesalers and Distributors

        3.7.3. Retailers

    3.8. PESTLE and Porter’s Analysis

    3.9. Regulatory Landscape

        3.9.1. By Key Regions

        3.9.2. By Key Countries

    3.10. Regional Parent Market Outlook

    3.11. Production and Consumption Statistics

    3.12. Import and Export Statistics

4. Global Market Analysis 2018 to 2022 and Forecast, 2023 to 2033

    4.1. Historical Market Size Value (US$ Million) & Volume (Units) Analysis, 2018 to 2022

    4.2. Current and Future Market Size Value (US$ Million) & Volume (Units) Projections, 2023 to 2033

        4.2.1. Y-o-Y Growth Trend Analysis

        4.2.2. Absolute $ Opportunity Analysis

5. Global Market Analysis 2018 to 2022 and Forecast 2023 to 2033, By Product

    5.1. Introduction / Key Findings

    5.2. Historical Market Size Value (US$ Million) & Volume (Units) Analysis By Product, 2018 to 2022

    5.3. Current and Future Market Size Value (US$ Million) & Volume (Units) Analysis and Forecast By Product, 2023 to 2033

        5.3.1. 24V

        5.3.2. 18V

        5.3.3. 36V

        5.3.4. 48.24V

    5.4. Y-o-Y Growth Trend Analysis By Product, 2018 to 2022

    5.5. Absolute $ Opportunity Analysis By Product, 2023 to 2033

6. Global Market Analysis 2018 to 2022 and Forecast 2023 to 2033, By Application

    6.1. Introduction / Key Findings

    6.2. Historical Market Size Value (US$ Million) & Volume (Units) Analysis By Application, 2018 to 2022

    6.3. Current and Future Market Size Value (US$ Million) & Volume (Units) Analysis and Forecast By Application, 2023 to 2033

        6.3.1. Industrial

        6.3.2. Automotive

        6.3.3. Consumer Electronics

        6.3.4. Aerospace and Defense

        6.3.5. Others

    6.4. Y-o-Y Growth Trend Analysis By Application, 2018 to 2022

    6.5. Absolute $ Opportunity Analysis By Application, 2023 to 2033

7. Global Market Analysis 2018 to 2022 and Forecast 2023 to 2033, By Region

    7.1. Introduction

    7.2. Historical Market Size Value (US$ Million) & Volume (Units) Analysis By Region, 2018 to 2022

    7.3. Current Market Size Value (US$ Million) & Volume (Units) Analysis and Forecast By Region, 2023 to 2033

        7.3.1. North America

        7.3.2. Latin America

        7.3.3. Europe

        7.3.4. Asia Pacific

        7.3.5. MEA

    7.4. Market Attractiveness Analysis By Region

8. North America Market Analysis 2018 to 2022 and Forecast 2023 to 2033, By Country

    8.1. Historical Market Size Value (US$ Million) & Volume (Units) Trend Analysis By Market Taxonomy, 2018 to 2022

    8.2. Market Size Value (US$ Million) & Volume (Units) Forecast By Market Taxonomy, 2023 to 2033

        8.2.1. By Country

            8.2.1.1. U.S.

            8.2.1.2. Canada

        8.2.2. By Product

        8.2.3. By Application

    8.3. Market Attractiveness Analysis

        8.3.1. By Country

        8.3.2. By Product

        8.3.3. By Application

    8.4. Key Takeaways

9. Latin America Market Analysis 2018 to 2022 and Forecast 2023 to 2033, By Country

    9.1. Historical Market Size Value (US$ Million) & Volume (Units) Trend Analysis By Market Taxonomy, 2018 to 2022

    9.2. Market Size Value (US$ Million) & Volume (Units) Forecast By Market Taxonomy, 2023 to 2033

        9.2.1. By Country

            9.2.1.1. Brazil

            9.2.1.2. Mexico

            9.2.1.3. Rest of Latin America

        9.2.2. By Product

        9.2.3. By Application

    9.3. Market Attractiveness Analysis

        9.3.1. By Country

        9.3.2. By Product

        9.3.3. By Application

    9.4. Key Takeaways

10. Europe Market Analysis 2018 to 2022 and Forecast 2023 to 2033, By Country

    10.1. Historical Market Size Value (US$ Million) & Volume (Units) Trend Analysis By Market Taxonomy, 2018 to 2022

    10.2. Market Size Value (US$ Million) & Volume (Units) Forecast By Market Taxonomy, 2023 to 2033

        10.2.1. By Country

            10.2.1.1. Germany

            10.2.1.2. U.K.

            10.2.1.3. France

            10.2.1.4. Spain

            10.2.1.5. Italy

            10.2.1.6. Rest of Europe

        10.2.2. By Product

        10.2.3. By Application

    10.3. Market Attractiveness Analysis

        10.3.1. By Country

        10.3.2. By Product

        10.3.3. By Application

    10.4. Key Takeaways

11. Asia Pacific Market Analysis 2018 to 2022 and Forecast 2023 to 2033, By Country

    11.1. Historical Market Size Value (US$ Million) & Volume (Units) Trend Analysis By Market Taxonomy, 2018 to 2022

    11.2. Market Size Value (US$ Million) & Volume (Units) Forecast By Market Taxonomy, 2023 to 2033

        11.2.1. By Country

            11.2.1.1. China

            11.2.1.2. Japan

            11.2.1.3. South Korea

            11.2.1.4. Singapore

            11.2.1.5. Thailand

            11.2.1.6. Indonesia

            11.2.1.7. Australia

            11.2.1.8. New Zealand

            11.2.1.9. Rest of Asia Pacific

        11.2.2. By Product

        11.2.3. By Application

    11.3. Market Attractiveness Analysis

        11.3.1. By Country

        11.3.2. By Product

        11.3.3. By Application

    11.4. Key Takeaways

12. MEA Market Analysis 2018 to 2022 and Forecast 2023 to 2033, By Country

    12.1. Historical Market Size Value (US$ Million) & Volume (Units) Trend Analysis By Market Taxonomy, 2018 to 2022

    12.2. Market Size Value (US$ Million) & Volume (Units) Forecast By Market Taxonomy, 2023 to 2033

        12.2.1. By Country

            12.2.1.1. GCC Countries

            12.2.1.2. South Africa

            12.2.1.3. Israel

            12.2.1.4. Rest of MEA

        12.2.2. By Product

        12.2.3. By Application

    12.3. Market Attractiveness Analysis

        12.3.1. By Country

        12.3.2. By Product

        12.3.3. By Application

    12.4. Key Takeaways

13. Key Countries Market Analysis

    13.1. U.S.

        13.1.1. Pricing Analysis

        13.1.2. Market Share Analysis, 2022

            13.1.2.1. By Product

            13.1.2.2. By Application

    13.2. Canada

        13.2.1. Pricing Analysis

        13.2.2. Market Share Analysis, 2022

            13.2.2.1. By Product

            13.2.2.2. By Application

    13.3. Brazil

        13.3.1. Pricing Analysis

        13.3.2. Market Share Analysis, 2022

            13.3.2.1. By Product

            13.3.2.2. By Application

    13.4. Mexico

        13.4.1. Pricing Analysis

        13.4.2. Market Share Analysis, 2022

            13.4.2.1. By Product

            13.4.2.2. By Application

    13.5. Germany

        13.5.1. Pricing Analysis

        13.5.2. Market Share Analysis, 2022

            13.5.2.1. By Product

            13.5.2.2. By Application

    13.6. U.K.

        13.6.1. Pricing Analysis

        13.6.2. Market Share Analysis, 2022

            13.6.2.1. By Product

            13.6.2.2. By Application

    13.7. France

        13.7.1. Pricing Analysis

        13.7.2. Market Share Analysis, 2022

            13.7.2.1. By Product

            13.7.2.2. By Application

    13.8. Spain

        13.8.1. Pricing Analysis

        13.8.2. Market Share Analysis, 2022

            13.8.2.1. By Product

            13.8.2.2. By Application

    13.9. Italy

        13.9.1. Pricing Analysis

        13.9.2. Market Share Analysis, 2022

            13.9.2.1. By Product

            13.9.2.2. By Application

    13.10. China

        13.10.1. Pricing Analysis

        13.10.2. Market Share Analysis, 2022

            13.10.2.1. By Product

            13.10.2.2. By Application

    13.11. Japan

        13.11.1. Pricing Analysis

        13.11.2. Market Share Analysis, 2022

            13.11.2.1. By Product

            13.11.2.2. By Application

    13.12. South Korea

        13.12.1. Pricing Analysis

        13.12.2. Market Share Analysis, 2022

            13.12.2.1. By Product

            13.12.2.2. By Application

    13.13. Singapore

        13.13.1. Pricing Analysis

        13.13.2. Market Share Analysis, 2022

            13.13.2.1. By Product

            13.13.2.2. By Application

    13.14. Thailand

        13.14.1. Pricing Analysis

        13.14.2. Market Share Analysis, 2022

            13.14.2.1. By Product

            13.14.2.2. By Application

    13.15. Indonesia

        13.15.1. Pricing Analysis

        13.15.2. Market Share Analysis, 2022

            13.15.2.1. By Product

            13.15.2.2. By Application

    13.16. Australia

        13.16.1. Pricing Analysis

        13.16.2. Market Share Analysis, 2022

            13.16.2.1. By Product

            13.16.2.2. By Application

    13.17. New Zealand

        13.17.1. Pricing Analysis

        13.17.2. Market Share Analysis, 2022

            13.17.2.1. By Product

            13.17.2.2. By Application

    13.18. GCC Countries

        13.18.1. Pricing Analysis

        13.18.2. Market Share Analysis, 2022

            13.18.2.1. By Product

            13.18.2.2. By Application

    13.19. South Africa

        13.19.1. Pricing Analysis

        13.19.2. Market Share Analysis, 2022

            13.19.2.1. By Product

            13.19.2.2. By Application

    13.20. Israel

        13.20.1. Pricing Analysis

        13.20.2. Market Share Analysis, 2022

            13.20.2.1. By Product

            13.20.2.2. By Application

14. Market Structure Analysis

    14.1. Competition Dashboard

    14.2. Competition Benchmarking

    14.3. Market Share Analysis of Top Players

        14.3.1. By Regional

        14.3.2. By Product

        14.3.3. By Application

15. Competition Analysis

    15.1. Competition Deep Dive

        15.1.1. Rockwell Automation

            15.1.1.1. Overview

            15.1.1.2. Product Portfolio

            15.1.1.3. Profitability by Market Segments

            15.1.1.4. Sales Footprint

            15.1.1.5. Strategy Overview

                15.1.1.5.1. Marketing Strategy

                15.1.1.5.2. Product Strategy

                15.1.1.5.3. Channel Strategy

        15.1.2. Moog, Inc

            15.1.2.1. Overview

            15.1.2.2. Product Portfolio

            15.1.2.3. Profitability by Market Segments

            15.1.2.4. Sales Footprint

            15.1.2.5. Strategy Overview

                15.1.2.5.1. Marketing Strategy

                15.1.2.5.2. Product Strategy

                15.1.2.5.3. Channel Strategy

        15.1.3. Fuji Electric Co., Ltd.

            15.1.3.1. Overview

            15.1.3.2. Product Portfolio

            15.1.3.3. Profitability by Market Segments

            15.1.3.4. Sales Footprint

            15.1.3.5. Strategy Overview

                15.1.3.5.1. Marketing Strategy

                15.1.3.5.2. Product Strategy

                15.1.3.5.3. Channel Strategy

        15.1.4. ABB Ltd

            15.1.4.1. Overview

            15.1.4.2. Product Portfolio

            15.1.4.3. Profitability by Market Segments

            15.1.4.4. Sales Footprint

            15.1.4.5. Strategy Overview

                15.1.4.5.1. Marketing Strategy

                15.1.4.5.2. Product Strategy

                15.1.4.5.3. Channel Strategy

        15.1.5. Siemens AG

            15.1.5.1. Overview

            15.1.5.2. Product Portfolio

            15.1.5.3. Profitability by Market Segments

            15.1.5.4. Sales Footprint

            15.1.5.5. Strategy Overview

                15.1.5.5.1. Marketing Strategy

                15.1.5.5.2. Product Strategy

                15.1.5.5.3. Channel Strategy

        15.1.6. Schneider Electric SE

            15.1.6.1. Overview

            15.1.6.2. Product Portfolio

            15.1.6.3. Profitability by Market Segments

            15.1.6.4. Sales Footprint

            15.1.6.5. Strategy Overview

                15.1.6.5.1. Marketing Strategy

                15.1.6.5.2. Product Strategy

                15.1.6.5.3. Channel Strategy

        15.1.7. General Electric

            15.1.7.1. Overview

            15.1.7.2. Product Portfolio

            15.1.7.3. Profitability by Market Segments

            15.1.7.4. Sales Footprint

            15.1.7.5. Strategy Overview

                15.1.7.5.1. Marketing Strategy

                15.1.7.5.2. Product Strategy

                15.1.7.5.3. Channel Strategy

        15.1.8. Dunkermotoren GmbH

            15.1.8.1. Overview

            15.1.8.2. Product Portfolio

            15.1.8.3. Profitability by Market Segments

            15.1.8.4. Sales Footprint

            15.1.8.5. Strategy Overview

                15.1.8.5.1. Marketing Strategy

                15.1.8.5.2. Product Strategy

                15.1.8.5.3. Channel Strategy

        15.1.9. Technosoft SA

            15.1.9.1. Overview

            15.1.9.2. Product Portfolio

            15.1.9.3. Profitability by Market Segments

            15.1.9.4. Sales Footprint

            15.1.9.5. Strategy Overview

                15.1.9.5.1. Marketing Strategy

                15.1.9.5.2. Product Strategy

                15.1.9.5.3. Channel Strategy

        15.1.10. RobotShop, Inc.

            15.1.10.1. Overview

            15.1.10.2. Product Portfolio

            15.1.10.3. Profitability by Market Segments

            15.1.10.4. Sales Footprint

            15.1.10.5. Strategy Overview

                15.1.10.5.1. Marketing Strategy

                15.1.10.5.2. Product Strategy

                15.1.10.5.3. Channel Strategy

        15.1.11. Roboteq, Inc.

            15.1.11.1. Overview

            15.1.11.2. Product Portfolio

            15.1.11.3. Profitability by Market Segments

            15.1.11.4. Sales Footprint

            15.1.11.5. Strategy Overview

                15.1.11.5.1. Marketing Strategy

                15.1.11.5.2. Product Strategy

                15.1.11.5.3. Channel Strategy

16. Assumptions & Acronyms Used

17. Research Methodology

List of Tables

Table 1: Global Market Value (US$ Million) Forecast by Region, 2018 to 2033

Table 2: Global Market Volume (Units) Forecast by Region, 2018 to 2033

Table 3: Global Market Value (US$ Million) Forecast by Product, 2018 to 2033

Table 4: Global Market Volume (Units) Forecast by Product, 2018 to 2033

Table 5: Global Market Value (US$ Million) Forecast by Application, 2018 to 2033

Table 6: Global Market Volume (Units) Forecast by Application, 2018 to 2033

Table 7: North America Market Value (US$ Million) Forecast by Country, 2018 to 2033

Table 8: North America Market Volume (Units) Forecast by Country, 2018 to 2033

Table 9: North America Market Value (US$ Million) Forecast by Product, 2018 to 2033

Table 10: North America Market Volume (Units) Forecast by Product, 2018 to 2033

Table 11: North America Market Value (US$ Million) Forecast by Application, 2018 to 2033

Table 12: North America Market Volume (Units) Forecast by Application, 2018 to 2033

Table 13: Latin America Market Value (US$ Million) Forecast by Country, 2018 to 2033

Table 14: Latin America Market Volume (Units) Forecast by Country, 2018 to 2033

Table 15: Latin America Market Value (US$ Million) Forecast by Product, 2018 to 2033

Table 16: Latin America Market Volume (Units) Forecast by Product, 2018 to 2033

Table 17: Latin America Market Value (US$ Million) Forecast by Application, 2018 to 2033

Table 18: Latin America Market Volume (Units) Forecast by Application, 2018 to 2033

Table 19: Europe Market Value (US$ Million) Forecast by Country, 2018 to 2033

Table 20: Europe Market Volume (Units) Forecast by Country, 2018 to 2033

Table 21: Europe Market Value (US$ Million) Forecast by Product, 2018 to 2033

Table 22: Europe Market Volume (Units) Forecast by Product, 2018 to 2033

Table 23: Europe Market Value (US$ Million) Forecast by Application, 2018 to 2033

Table 24: Europe Market Volume (Units) Forecast by Application, 2018 to 2033

Table 25: Asia Pacific Market Value (US$ Million) Forecast by Country, 2018 to 2033

Table 26: Asia Pacific Market Volume (Units) Forecast by Country, 2018 to 2033

Table 27: Asia Pacific Market Value (US$ Million) Forecast by Product, 2018 to 2033

Table 28: Asia Pacific Market Volume (Units) Forecast by Product, 2018 to 2033

Table 29: Asia Pacific Market Value (US$ Million) Forecast by Application, 2018 to 2033

Table 30: Asia Pacific Market Volume (Units) Forecast by Application, 2018 to 2033

Table 31: MEA Market Value (US$ Million) Forecast by Country, 2018 to 2033

Table 32: MEA Market Volume (Units) Forecast by Country, 2018 to 2033

Table 33: MEA Market Value (US$ Million) Forecast by Product, 2018 to 2033

Table 34: MEA Market Volume (Units) Forecast by Product, 2018 to 2033

Table 35: MEA Market Value (US$ Million) Forecast by Application, 2018 to 2033

Table 36: MEA Market Volume (Units) Forecast by Application, 2018 to 2033

List of Charts

Figure 1: Global Market Value (US$ Million) by Product, 2023 to 2033

Figure 2: Global Market Value (US$ Million) by Application, 2023 to 2033

Figure 3: Global Market Value (US$ Million) by Region, 2023 to 2033

Figure 4: Global Market Value (US$ Million) Analysis by Region, 2018 to 2033

Figure 5: Global Market Volume (Units) Analysis by Region, 2018 to 2033

Figure 6: Global Market Value Share (%) and BPS Analysis by Region, 2023 to 2033

Figure 7: Global Market Y-o-Y Growth (%) Projections by Region, 2023 to 2033

Figure 8: Global Market Value (US$ Million) Analysis by Product, 2018 to 2033

Figure 9: Global Market Volume (Units) Analysis by Product, 2018 to 2033

Figure 10: Global Market Value Share (%) and BPS Analysis by Product, 2023 to 2033

Figure 11: Global Market Y-o-Y Growth (%) Projections by Product, 2023 to 2033

Figure 12: Global Market Value (US$ Million) Analysis by Application, 2018 to 2033

Figure 13: Global Market Volume (Units) Analysis by Application, 2018 to 2033

Figure 14: Global Market Value Share (%) and BPS Analysis by Application, 2023 to 2033

Figure 15: Global Market Y-o-Y Growth (%) Projections by Application, 2023 to 2033

Figure 16: Global Market Attractiveness by Product, 2023 to 2033

Figure 17: Global Market Attractiveness by Application, 2023 to 2033

Figure 18: Global Market Attractiveness by Region, 2023 to 2033

Figure 19: North America Market Value (US$ Million) by Product, 2023 to 2033

Figure 20: North America Market Value (US$ Million) by Application, 2023 to 2033

Figure 21: North America Market Value (US$ Million) by Country, 2023 to 2033

Figure 22: North America Market Value (US$ Million) Analysis by Country, 2018 to 2033

Figure 23: North America Market Volume (Units) Analysis by Country, 2018 to 2033

Figure 24: North America Market Value Share (%) and BPS Analysis by Country, 2023 to 2033

Figure 25: North America Market Y-o-Y Growth (%) Projections by Country, 2023 to 2033

Figure 26: North America Market Value (US$ Million) Analysis by Product, 2018 to 2033

Figure 27: North America Market Volume (Units) Analysis by Product, 2018 to 2033

Figure 28: North America Market Value Share (%) and BPS Analysis by Product, 2023 to 2033

Figure 29: North America Market Y-o-Y Growth (%) Projections by Product, 2023 to 2033

Figure 30: North America Market Value (US$ Million) Analysis by Application, 2018 to 2033

Figure 31: North America Market Volume (Units) Analysis by Application, 2018 to 2033

Figure 32: North America Market Value Share (%) and BPS Analysis by Application, 2023 to 2033

Figure 33: North America Market Y-o-Y Growth (%) Projections by Application, 2023 to 2033

Figure 34: North America Market Attractiveness by Product, 2023 to 2033

Figure 35: North America Market Attractiveness by Application, 2023 to 2033

Figure 36: North America Market Attractiveness by Country, 2023 to 2033

Figure 37: Latin America Market Value (US$ Million) by Product, 2023 to 2033

Figure 38: Latin America Market Value (US$ Million) by Application, 2023 to 2033

Figure 39: Latin America Market Value (US$ Million) by Country, 2023 to 2033

Figure 40: Latin America Market Value (US$ Million) Analysis by Country, 2018 to 2033

Figure 41: Latin America Market Volume (Units) Analysis by Country, 2018 to 2033

Figure 42: Latin America Market Value Share (%) and BPS Analysis by Country, 2023 to 2033

Figure 43: Latin America Market Y-o-Y Growth (%) Projections by Country, 2023 to 2033

Figure 44: Latin America Market Value (US$ Million) Analysis by Product, 2018 to 2033

Figure 45: Latin America Market Volume (Units) Analysis by Product, 2018 to 2033

Figure 46: Latin America Market Value Share (%) and BPS Analysis by Product, 2023 to 2033

Figure 47: Latin America Market Y-o-Y Growth (%) Projections by Product, 2023 to 2033

Figure 48: Latin America Market Value (US$ Million) Analysis by Application, 2018 to 2033

Figure 49: Latin America Market Volume (Units) Analysis by Application, 2018 to 2033

Figure 50: Latin America Market Value Share (%) and BPS Analysis by Application, 2023 to 2033

Figure 51: Latin America Market Y-o-Y Growth (%) Projections by Application, 2023 to 2033

Figure 52: Latin America Market Attractiveness by Product, 2023 to 2033

Figure 53: Latin America Market Attractiveness by Application, 2023 to 2033

Figure 54: Latin America Market Attractiveness by Country, 2023 to 2033

Figure 55: Europe Market Value (US$ Million) by Product, 2023 to 2033

Figure 56: Europe Market Value (US$ Million) by Application, 2023 to 2033

Figure 57: Europe Market Value (US$ Million) by Country, 2023 to 2033

Figure 58: Europe Market Value (US$ Million) Analysis by Country, 2018 to 2033

Figure 59: Europe Market Volume (Units) Analysis by Country, 2018 to 2033

Figure 60: Europe Market Value Share (%) and BPS Analysis by Country, 2023 to 2033

Figure 61: Europe Market Y-o-Y Growth (%) Projections by Country, 2023 to 2033

Figure 62: Europe Market Value (US$ Million) Analysis by Product, 2018 to 2033

Figure 63: Europe Market Volume (Units) Analysis by Product, 2018 to 2033

Figure 64: Europe Market Value Share (%) and BPS Analysis by Product, 2023 to 2033

Figure 65: Europe Market Y-o-Y Growth (%) Projections by Product, 2023 to 2033

Figure 66: Europe Market Value (US$ Million) Analysis by Application, 2018 to 2033

Figure 67: Europe Market Volume (Units) Analysis by Application, 2018 to 2033

Figure 68: Europe Market Value Share (%) and BPS Analysis by Application, 2023 to 2033

Figure 69: Europe Market Y-o-Y Growth (%) Projections by Application, 2023 to 2033

Figure 70: Europe Market Attractiveness by Product, 2023 to 2033

Figure 71: Europe Market Attractiveness by Application, 2023 to 2033

Figure 72: Europe Market Attractiveness by Country, 2023 to 2033

Figure 73: Asia Pacific Market Value (US$ Million) by Product, 2023 to 2033

Figure 74: Asia Pacific Market Value (US$ Million) by Application, 2023 to 2033

Figure 75: Asia Pacific Market Value (US$ Million) by Country, 2023 to 2033

Figure 76: Asia Pacific Market Value (US$ Million) Analysis by Country, 2018 to 2033

Figure 77: Asia Pacific Market Volume (Units) Analysis by Country, 2018 to 2033

Figure 78: Asia Pacific Market Value Share (%) and BPS Analysis by Country, 2023 to 2033

Figure 79: Asia Pacific Market Y-o-Y Growth (%) Projections by Country, 2023 to 2033

Figure 80: Asia Pacific Market Value (US$ Million) Analysis by Product, 2018 to 2033

Figure 81: Asia Pacific Market Volume (Units) Analysis by Product, 2018 to 2033

Figure 82: Asia Pacific Market Value Share (%) and BPS Analysis by Product, 2023 to 2033

Figure 83: Asia Pacific Market Y-o-Y Growth (%) Projections by Product, 2023 to 2033

Figure 84: Asia Pacific Market Value (US$ Million) Analysis by Application, 2018 to 2033

Figure 85: Asia Pacific Market Volume (Units) Analysis by Application, 2018 to 2033

Figure 86: Asia Pacific Market Value Share (%) and BPS Analysis by Application, 2023 to 2033

Figure 87: Asia Pacific Market Y-o-Y Growth (%) Projections by Application, 2023 to 2033

Figure 88: Asia Pacific Market Attractiveness by Product, 2023 to 2033

Figure 89: Asia Pacific Market Attractiveness by Application, 2023 to 2033

Figure 90: Asia Pacific Market Attractiveness by Country, 2023 to 2033

Figure 91: MEA Market Value (US$ Million) by Product, 2023 to 2033

Figure 92: MEA Market Value (US$ Million) by Application, 2023 to 2033

Figure 93: MEA Market Value (US$ Million) by Country, 2023 to 2033

Figure 94: MEA Market Value (US$ Million) Analysis by Country, 2018 to 2033

Figure 95: MEA Market Volume (Units) Analysis by Country, 2018 to 2033

Figure 96: MEA Market Value Share (%) and BPS Analysis by Country, 2023 to 2033

Figure 97: MEA Market Y-o-Y Growth (%) Projections by Country, 2023 to 2033

Figure 98: MEA Market Value (US$ Million) Analysis by Product, 2018 to 2033

Figure 99: MEA Market Volume (Units) Analysis by Product, 2018 to 2033

Figure 100: MEA Market Value Share (%) and BPS Analysis by Product, 2023 to 2033

Figure 101: MEA Market Y-o-Y Growth (%) Projections by Product, 2023 to 2033

Figure 102: MEA Market Value (US$ Million) Analysis by Application, 2018 to 2033

Figure 103: MEA Market Volume (Units) Analysis by Application, 2018 to 2033

Figure 104: MEA Market Value Share (%) and BPS Analysis by Application, 2023 to 2033

Figure 105: MEA Market Y-o-Y Growth (%) Projections by Application, 2023 to 2033

Figure 106: MEA Market Attractiveness by Product, 2023 to 2033

Figure 107: MEA Market Attractiveness by Application, 2023 to 2033

Figure 108: MEA Market Attractiveness by Country, 2023 to 2033

Recommendations

Automotive

Electric Vehicle Motor Market

Published : March 2024

Automotive

Electric Utility Vehicles Market

Published : December 2022

Explore Automotive Insights

View Reports