

- Market Size (2026)
- USD 2860.7 Mn
- Forecast (2036)
- USD 5951.1 Mn
- CAGR (2026 to 2036)
- 7.6%
How big is the Soft Touch Nonwovens Market in 2026?
USD 2,860.7 million in 2026 and USD 5,951.1 million by 2036 at a 7.6% CAGR.
Demand for soft touch nonwovens is projected to expand at 7.6% CAGR between 2026 and 2036, increasing valuation from USD 2,860.7 million in 2026 to USD 5,951.1 million by 2036. Converter qualification pressure is giving soft touch nonwovens a clearer role inside hygiene and medical material selection. INDA reported in May 2025 that North American nonwovens capacity reached 5.730 million tonnes in 2024. The figure keeps tactile webs inside nonwoven fabrics demand planning for converters seeking stable supply.
India and China are projected to grow faster as converter expansion and hygiene product output support higher soft web consumption. The United States, Germany and Japan are expected to expand through approved supplier lists, complaint history and medical-grade documentation. Hygiene converters are likely to purchase soft touch nonwovens to protect surface feel during faster diaper and wipes production.
Hygiene converters and diaper brand teams are expected to purchase soft touch nonwovens to protect product feel during faster line speeds. Their approval process is shaped by surface softness and tensile behavior during unwinding across high-speed plants. Baby diaper programs use these webs at the skin-contact layer, so sourcing teams test roll consistency before approving broader volume. Medical product manufacturers also review lint control and device contact requirements before accepting a new web grade.
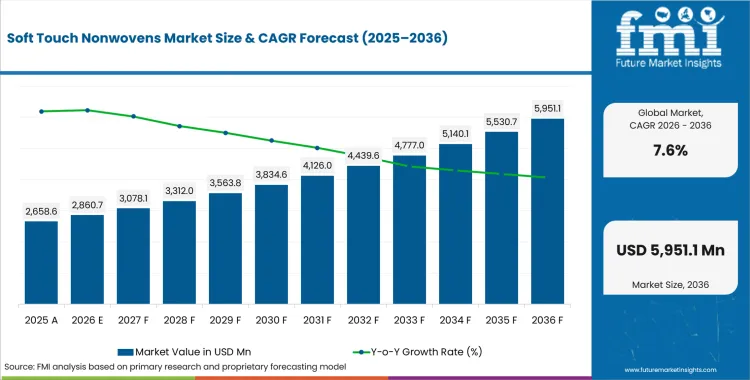
| Metric | Value |
|---|---|
| 2025 Market Size | USD 2,658.6 million |
| 2026 Market Size | USD 2,860.7 million |
| 2036 Market Size | USD 5,951.1 million |
| Forecast CAGR (2026-2036) | 7.6% |
| Sales Channel Focus | Direct to Converters |
| Direct to Converters Share (2026) | 58.5% |
| Fiber Type Focus | Polypropylene |
| Polypropylene Share (2026) | 38.0% |
| Technology Focus | Spunbond |
| Spunbond Share (2026) | 38.0% |
| Fastest-growing Country | India |
| India CAGR by 2036 | 9.83% |
Summary of the Soft Touch Nonwovens Market
| Market Signal | Commercial Impact |
|---|---|
| Demand and Growth Drivers | Converter approval is expected to move spending toward soft touch nonwovens used in hygiene and medical applications. Documentation discipline is projected to turn tactile feel into a measurable buying requirement.
|
| Product and Segment View | Direct converter sales and polypropylene are expected to lead their parent categories in 2026. Spunbond is forecast to remain the main technology route for scalable soft web production.
|
| Geography and Growth Outlook | India and China are projected to form the higher-growth tier due to converter investment and consumer hygiene volume. Europe and Japan are expected to grow under more documented qualification cycles.
|
| Competitive Landscape | Competition is moderately concentrated around nonwoven rollstock capability and converter account access.
|
| Analyst Perspective | Soft touch nonwovens are becoming a converter-risk decision. Suppliers are expected to be judged by whether softness remains stable through bonding, unwinding and high-speed hygiene production.
|
Source: FMI's proprietary forecasting model and primary research
How is the Soft Touch Nonwovens Market segmented?
The soft touch nonwovens industry is segmented by fiber type, technology, application, end use, sales channel, and region.
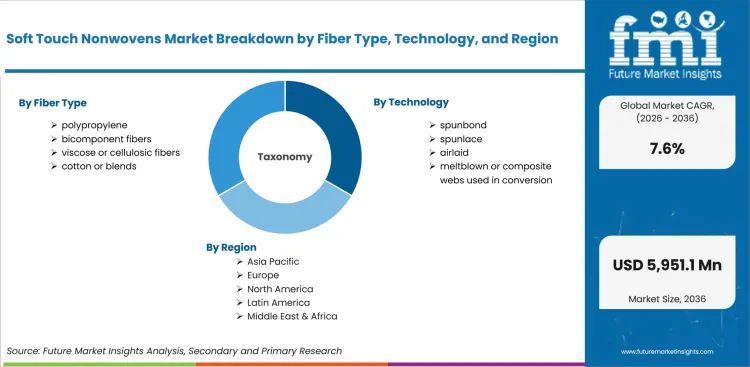
The soft touch nonwovens market is segmented by fiber type, technology, application, end use, sales channel, and region. By fiber type, the market covers polypropylene, bicomponent fibers, viscose or cellulosic fibers, and cotton blends. By technology, the scope covers spunbond, spunlace, airlaid, and meltblown or composite webs used in conversion. By application, it covers baby diapers, feminine hygiene, adult incontinence, and wipes or personal care. By end use, it covers hygiene products, medical or healthcare, personal care, and home care. By sales channel, it covers direct to converters, distributors, and private-label supply routes used for approval. Regional coverage includes North America, Latin America, Europe, East Asia, South Asia and Pacific, and the Middle East and Africa, aligned to technical textiles sourcing.
How does direct to converters shape purchasing within the sales channel category?
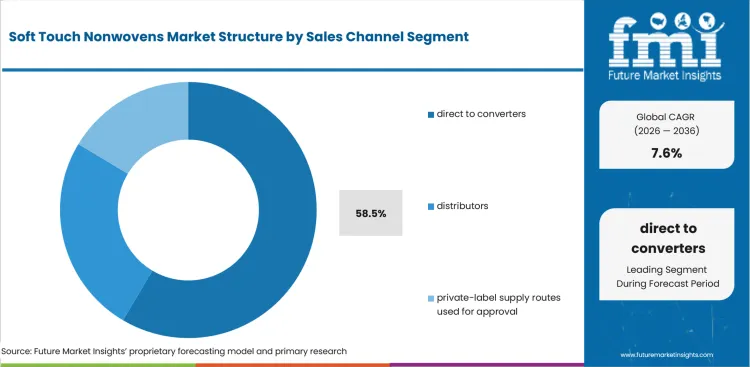
Converter-led qualification requires fewer handoffs between rollstock producers and hygiene product plants before repeat approval. Amcor completed its combination with Berry Global in April 2025, giving converter accounts a broader material platform and larger service footprint. Direct sales support faster specification review and clearer issue ownership before a soft touch web enters repeat diaper or wipes production.
- By sales channel, direct to converters is projected to account for 58.5% share in 2026 driven by faster service escalation and specification control. Amcor completed its Berry Global combination in April 2025, which expands direct account reach for hygiene and healthcare packaging customers needing fewer handoffs during material approval.
- Direct converter access is witnessing demand from hygiene producers owing to tighter roll-change scheduling and line-service needs. Converters testing wet wipes sourcing teams need named technical contacts and complaint-response records before replacing an approved soft touch rollstock grade in recurring production.
What supports polypropylene demand within the fiber type category?
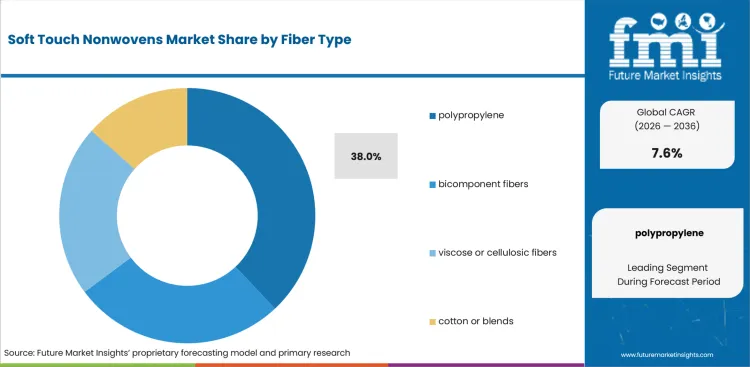
Polypropylene selection starts at resin familiarity and ends at skin-contact comfort targets in diapers and wipes. Braskem and Fitesa announced in April 2025 that a bio-based HDPE grade was designed for Fitesa nonwovens, reinforcing converter interest in polyolefin options used in hygiene webs.
- By fiber type, polypropylene is estimated to hold 38.0% share in 2026 owing to resin availability and converter familiarity. Braskem and Fitesa announced in April 2025 that bio-based HDPE was designed for Fitesa nonwovens, which keeps polyolefin substitution inside supplier qualification reviews.
- Demand for polypropylene is expected to grow among hygiene converters attributable to stable extrusion behavior and established converting knowledge. PP nonwovens also fit cost-control discussions where diaper producers compare softness against line yield and raw-material volatility. Some converters compare biobased binder options before approving softer skin-contact web variants during early formulation review.
How is spunbond positioned within the technology category?
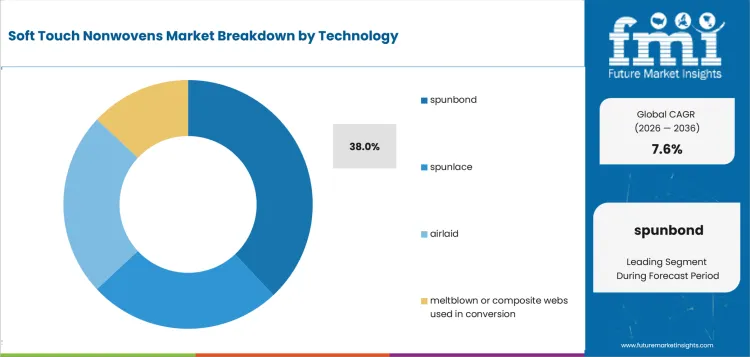
Spunbond decisions are shaped by line speed and uniform web formation during absorbent hygiene conversion. Freudenberg Performance Materials introduced fine filament spunbond nonwoven technology in April 2025, describing polymer and blend flexibility across technical applications. The same technology direction supports converters that need repeatable softness and controlled basis weight for skin-contact layers in absorbent hygiene goods.
- By technology, spunbond is forecast to represent 38.0% share in 2026 driven by basis-weight control and roll consistency. Freudenberg Performance Materials introduced fine filament spunbond nonwoven technology in April 2025, which supports converter interest in lighter webs and more controlled surface feel.
- Spunbond adoption is gaining momentum in diaper and hygiene lines supported by high-speed compatibility and fewer wet-process constraints. Converters comparing non-woven fabric rolls evaluate web formation and softness drift before switching approved materials used in baby topsheets.
How do hygiene products anchor demand within the end use category?
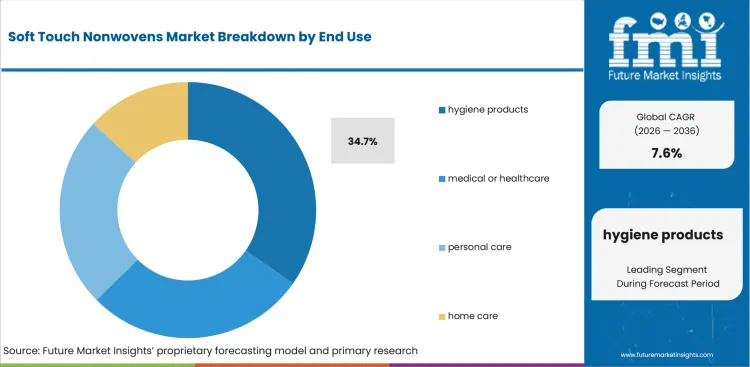
Hygiene product qualification connects softness to repeat use and complaint prevention across diaper and wipes portfolios. FDA personal protective equipment guidance in January 2025 identifies infection-control products used in healthcare settings and keeps nonwoven documentation inside medical sourcing reviews.
- Hygiene products are likely to capture 34.7% of end use demand in 2026 attributable to diapers and wipes requiring skin-contact performance. FDA personal protective equipment guidance in January 2025 identifies infection-control products used in healthcare settings and keeps nonwoven documentation inside medical sourcing reviews.
- Purchase activity for hygiene products is anticipated to rise driven by brand focus on softness claims and complaint reduction.
What drives baby diapers within the application category?
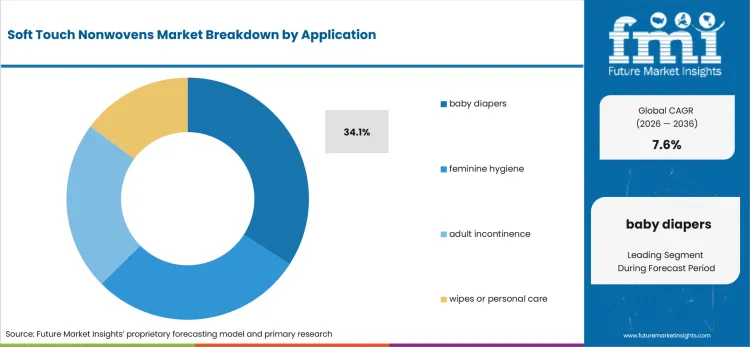
Baby diaper applications turn soft touch nonwovens into a product-performance decision at the shelf. INDA announced 2025 World of Wipes Innovation Award finalists in June 2025 and reinforced attention on wipe substrate performance.
- By application, baby diapers are set to lead with 34.1% share in 2026 due to topsheet comfort and retail quality testing. INDA announced 2025 World of Wipes Innovation Award finalists in June 2025 and reinforced converter attention on substrate performance.
- Baby diaper application demand is drawing attention from hygiene brands shaped by parent sensitivity to softness and leakage complaints. Personal care wipes demand also reinforces the same tactile review where converters choose webs that contact skin repeatedly.
What are the drivers, restraints, and opportunities in the Soft Touch Nonwovens Market?
Near-term purchases are being shaped by converter line stability, qualification time, and direct service access outlined below.
- Driver: Hygiene converters are expected to raise soft touch web trials to reduce line complaints and protect repeat product feel.
- Restraint: Qualification cycles are anticipated to delay adoption in accounts that lack roll-history data and tactile proof.
- Opportunity: Direct technical service is projected to open account access for suppliers that support converter trials and claim files.
Hygiene converters are expected to place more value on soft touch webs that reduce line interruptions and complaint risk. Braskem introduced in October 2025 an I'm green bio-based HDPE grade developed for the nonwovens segment and hygiene uses. The launch gives converters a clearer material-substitution option before they test soft polyolefin webs for diaper and wipes lines.
Technical sourcing teams are likely to slow approval where material files do not explain skin-contact performance and device compatibility. FDA personal protective equipment guidance in January 2025 lists gowns and masks inside infection-control product oversight. Healthcare sourcing reviews keep nonwoven documentation inside supplier qualification for product approval teams. The restraint is tied to proof gaps and unclear approval responsibility across teams. Approval teams need proof that soft webs meet use conditions without adding complaint exposure.
Direct support is expected to convert qualification friction into an account route for rollstock producers and specialty web suppliers. Ahlstrom announced a product-specific carbon footprint life cycle assessment tool in March 2025, supporting customers that need documentation for material choices. Documentation discipline also supports nonwoven filter media and hygiene web programs during supplier review. Suppliers that pair tactile evidence and service response are likely to receive broader converter trial access.
Which country CAGRs are profiled in the Soft Touch Nonwovens Market?
| Country | CAGR |
|---|---|
| United States | 6.43% |
| China | 8.83% |
| India | 9.83% |
| Germany | 5.83% |
| United Kingdom | 6.23% |
| Japan | 5.63% |
| South Korea | 7.03% |
Source: FMI's proprietary forecasting model and primary research
How do country-level CAGRs compare in the Soft Touch Nonwovens Market?
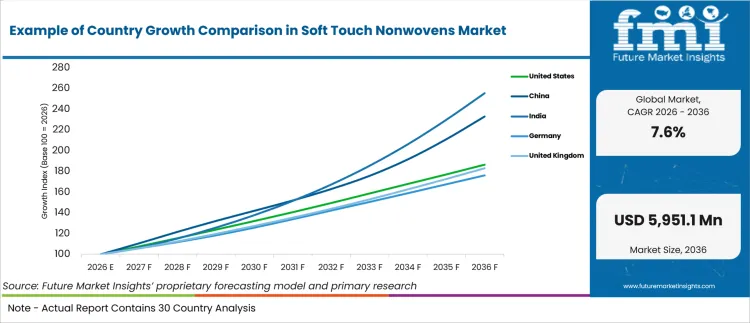
Country growth is expected to reflect converter access and hygiene product demand across each profiled region. India is projected at 9.83% CAGR and China is forecast at 8.83% CAGR through 2036. South Korea is estimated at 7.03% CAGR and the United States is likely to record 6.43% CAGR. The United Kingdom is predicted at 6.23% CAGR due to retailer-led service requirements. Germany and Japan are forecast at 5.83% and 5.63% CAGR under tighter qualification routines.
- United States diaper and wipes programs are shaped by large retail channels and strict brand complaint tracking. The United States is anticipated to record 6.43% CAGR by 2036, supported by hygiene converters that need approved soft topsheet grades. CDC reported 3.629 million registered births in July 2025 for calendar year 2024. Infant hygiene volume keeps diaper converters focused on tactile consistency and retailer audit files. Domestic producers also screen vendors for roll-history evidence before adding new grades to multi-plant programs.
- China combines large diaper output with fast supplier qualification cycles in coastal converting hubs. Soft touch nonwovens demand in China is forecast to rise at 8.83% CAGR over the forecast period, driven by high-volume absorbent hygiene production. The National Bureau of Statistics reported 9.54 million births in February 2025 for calendar year 2024. Birth volume supports local topsheet demand even while brand teams tighten price and softness targets. Local converters also need suppliers able to deliver quickly across regional plants and approved channels.
- India is building technical textile capacity and converting capability around hygiene and healthcare demand. India is projected to post 9.83% CAGR through 2036, supported by formal sourcing and wider converter participation. The Ministry of Textiles reported in August 2025 that textile and apparel exports grew 5.2% in FY 2024-25. Export momentum gives technical textile producers a reason to improve documentation and line-service readiness. Cost remains a hard filter for diaper and wipes converters operating across regional channels. Regional distributors also influence specification access across textile clusters before smaller converters accept trial inventory.
- Germany remains a specification-led market where approval teams expect repeatable material behavior before volume movement. Germany is estimated to advance at 5.83% CAGR during the assessment period, shaped by converter documentation and medical textile review. Destatis listed 677,117 live births in July 2025 for calendar year 2024 under its birth-order table. The figure keeps diaper demand visible even though adult hygiene and medical webs also influence qualification. German converters tend to screen suppliers for certificates and complaint history before price negotiation.
- United Kingdom hygiene converters face import exposure and service accountability pressures after supplier changes. The United Kingdom is predicted to record 6.23% CAGR by 2036, influenced by retailer specifications and dependable delivery. ONS reported 594,677 live births in England and Wales in July 2025 for calendar year 2024. The rise keeps baby diaper programs visible to converters and private-label retailers during annual range planning. Local accounts also evaluate service reach due to shorter approval windows and smaller production runs.
- Japan screens soft touch web materials carefully due to long qualification routines and consumer quality expectations. Japan is forecast to expand at 5.63% CAGR over the forecast period, supported by adult hygiene and premium diaper positioning. Japan MHLW vital statistics recorded 686,061 births in June 2025 for calendar year 2024. Lower birth volume shifts attention toward quality retention and premium comfort instead of pure volume expansion. Japanese converters also need suppliers that reduce inspection work and maintain exact roll specifications.
- South Korea combines compact supply chains with demanding hygiene brands that respond quickly to product feedback. In South Korea soft touch nonwovens demand is estimated to expand at 7.03% CAGR through 2036 led by rapid converter-service loops. Statistics Korea reported 238,300 births in February 2025 for calendar year 2024 under its annual vital statistics program. The first birth rebound in years gives baby hygiene converters a narrow volume lift and sharper launch planning.
Who are the notable companies in the Soft Touch Nonwovens Market?
Amcor (Berry Global nonwovens assets), Freudenberg Performance Materials, Suominen, Fitesa, Ahlstrom, Kimberly-Clark Professional, PFNonwovens, Avgol, Glatfelter, and Fibertex Nonwovens are the notable companies shaping this market.
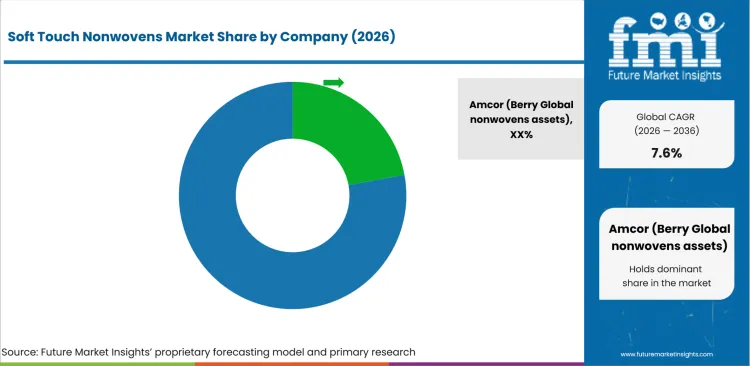
The market is moderately concentrated around producers that control fiber sourcing and web formation. Entry pathways are narrow due to converter qualification and retailer documentation needs across hygiene accounts. Large multinational producers hold scale and direct account access across hygiene and healthcare accounts. Regional specialists compete in narrower programs where service reach and application proof carry more weight.
- Scale-focused supply decisions place Amcor and PFNonwovens in converter programs that need broad rollstock access. Fitesa also competes for hygiene accounts where spunmelt experience and local service determine trial speed. These companies serve teams that want fewer supply interruptions during large diaper programs and retailer audits.
- Wipes and personal care programs create a different competitive screen for Suominen and Kimberly-Clark Professional. Their relevance is tied to surface feel and skin-contact use cases inside wipes and care products. Hygiene brand teams compare these suppliers where softness claims must hold during repeat purchases and retail review.
- Technical textile accounts give Freudenberg Performance Materials and Ahlstrom a role in higher-documentation programs. Medical and specialty product teams value their application evidence and material control during regulatory review. These suppliers fit accounts where lint control and standards review sit ahead of unit-price negotiation.
- Specialty web producers including Glatfelter and Fibertex Nonwovens serve accounts that need targeted materials and regional coverage. They are likely to retain attention in programs where converters require responsive support after trial approval. Freudenberg and Fitesa are expected to hold broader account access due to visible technology depth and service reach.
Competitive Benchmarking: Soft Touch Nonwovens Market
| Company | Fiber and web fit | Converter access | Documentation depth | Service reach |
|---|---|---|---|---|
| Amcor (Berry Global nonwovens assets) | High | High | Strong | Global |
| Freudenberg Performance Materials | Strong | Medium | High | Global |
| Suominen | Strong | High | High | Global |
| Fitesa | High | High | Strong | Global |
| Ahlstrom | Strong | Medium | High | Global |
| Kimberly-Clark Professional | Medium | High | High | Global |
| PFNonwovens | High | High | Medium | Global |
| Avgol | Strong | High | Medium | Global |
| Glatfelter | Medium | Medium | High | Regional |
| Fibertex Nonwovens | Strong | Medium | Medium | Regional |
Source: Future Market Insights competitive analysis, 2026. Ratings reflect relative portfolio relevance and workflow fit across converter qualification priorities. Service capability and geographic reach shape the remaining comparison for repeat account access.
Key Developments in the Soft Touch Nonwovens Market
- In April 2025, Amcor completed its combination with Berry Global following the closure of the planned transaction. The merger integrated Berry’s assets into a broader consumer and healthcare packaging platform, strengthening capabilities across flexible packaging and rollstock markets.
- In April 2025, Braskem and Fitesa announced the use of bio-based HDPE in Fitesa’s nonwoven production processes. The material was developed for nonwoven and polyolefin conversion applications commonly used in hygiene products.
Key Players in the Soft Touch Nonwovens Market
Nonwoven rollstock producers
- Amcor (Berry Global nonwovens assets)
- PFNonwovens
- Avgol
- Fitesa
Specialty and hygiene web suppliers
- Suominen
- Ahlstrom
- Kimberly-Clark Professional
Technical textile and regional web producers
- Freudenberg Performance Materials
- Glatfelter
- Fibertex Nonwovens
Soft Touch Nonwovens Market - Report Scope
| Coverage field | Report scope |
|---|---|
| Market breakdown | Soft Touch Nonwovens Market Breakdown By Fiber Type, Technology, Application, End Use, Sales Channel, and Region |
| Market Definition | Soft touch nonwovens are engineered rollstock webs that provide soft skin-contact surfaces for hygiene, medical, personal care, and home care converters. |
| Regions Covered | North America, Latin America, Europe, East Asia, South Asia and Pacific, and Middle East and Africa |
| Countries Covered | United States, China, India, Germany, United Kingdom, Japan, South Korea, and 30+ countries |
| Key Companies Profiled | Amcor (Berry Global nonwovens assets), Freudenberg Performance Materials, Suominen, Fitesa, Ahlstrom, Kimberly-Clark Professional, PFNonwovens, Avgol, Glatfelter, and Fibertex Nonwovens |
| Forecast Period | 2026 to 2036 |
| Approach | Hybrid bottom-up and top-down methodology using converter demand, fiber type mix, technology shares, hygiene application use cases, and supplier portfolio depth |
Source: Future Market Insights - analysis driven by proprietary forecasting models and primary research
Soft Touch Nonwovens Market - Research Methodology
| Method | Approach |
|---|---|
| Primary Research | FMI analysts interviewed hygiene converters, diaper brand sourcing teams and medical nonwoven purchasers that evaluate soft topsheet webs. Discussions covered tactile targets and roll stability during high-speed conversion. Teams also reviewed qualification time and complaint risk after trial approval. The interviews tested how converters judge hand-feel evidence, technical service response and repeat supply reliability before account expansion decisions. |
| Desk Research | Desk research reviewed CDC and ONS birth statistics, INDA and EDANA nonwovens output data and FDA material references. Company product pages and official press releases were checked against nonwoven web capability and hygiene application fit. The review excluded adjacent packaging films and unrelated textile products. Source checks focused on skin-contact webs, spunbond technology and converter service claims used in diaper and wipes approval. |
| Market Sizing and Forecasting | The forecast used a hybrid bottom-up and top-down model linking country hygiene demand to converter purchasing. Fiber type share and technology mix were reconciled against stated 2026 values. Sales channel weighting was tested against direct converter approval and distributor support needs. Forecast assumptions were adjusted for polypropylene cost exposure, spunbond roll performance and hygiene application requirements identified during primary interviews. |
| Data Validation | Forecasts were checked against country birth indicators and official nonwoven capacity references. Company portfolios were reviewed to avoid counting adjacent packaging films or unrelated textile products. Segment totals were reconciled against the 2026 market base and country CAGR pattern. Validation also tested whether baby diapers, wipes and medical hygiene demand supported the same soft-touch web qualification logic across regions. |
Source: Future Market Insights (FMI) analysis, based on proprietary forecasting model and primary research
Soft Touch Nonwovens Market by Segments
Soft Touch Nonwovens Market segmented by Fiber Type:
- Polypropylene
- Bicomponent Fibers
- Viscose / Cellulosic
- Cotton / Blends
Soft Touch Nonwovens Market segmented by Technology:
- Spunbond
- Spunlace
- Airlaid
- Meltblown / Composite
Soft Touch Nonwovens Market segmented by Application:
- Baby Diapers
- Feminine Hygiene
- Adult Incontinence
- Wipes / Personal Care
Soft Touch Nonwovens Market segmented by End Use:
- Hygiene Products
- Medical / Healthcare
- Personal Care
- Home Care
Soft Touch Nonwovens Market segmented by Sales Channel:
- Direct to Converters
- Distributors
- Private-label Supply
Soft Touch Nonwovens Market by Region:
- North America
- United States
- Canada
- Latin America
- Brazil
- Mexico
- Argentina
- Europe
- Germany
- United Kingdom
- France
- Italy
- Spain
- East Asia
- China
- Japan
- South Korea
- South Asia and Pacific
- India
- ASEAN
- Australia and New Zealand
- Middle East and Africa
- GCC Countries
- South Africa
- Rest of Middle East and Africa
Research Sources and Bibliography
- Centers for Disease Control and Prevention. (2025, July). Births in the United States, 2024. National Center for Health Statistics.
- National Bureau of Statistics of China. (2025, February). Statistical Communiqué of the People's Republic of China on the 2024 National Economic and Social Development. National Bureau of Statistics of China.
- Ministry of Textiles. (2025, August). Export target for textiles 2030. Press Information Bureau.
- Federal Statistical Office of Germany. (2025, July). Live births by birth order and region, 2024. Destatis.
- Office for National Statistics. (2025, July). Births in England and Wales: 2024. Office for National Statistics.
- Ministry of Health, Labour and Welfare. (2025, June). Vital Statistics of Japan, 2024. Ministry of Health, Labour and Welfare.
- Statistics Korea. (2025, February). Preliminary Results of Birth and Death Statistics in 2024. Ministry of Data and Statistics.
- INDA. (2025, May). 2025 INDA Supply Report Shows North American Nonwovens Industry's Continued Growth with a Focus on Sustainability. INDA.
- EDANA. (2026, April). 2025 Nonwoven Production in Greater Europe: European Nonwovens Industry Remains Strong Amid Challenging Market Conditions. EDANA.
- Amcor. (2025, April). Amcor completes combination with Berry Global. Amcor.
- Freudenberg Performance Materials. (2025, April). Unique fine filament spunbond nonwoven technology from Freudenberg enables high-quality, versatile applications in technical textiles. Freudenberg Performance Materials.
- Braskem. (2025, April). Braskem and Fitesa announce the use of Braskem's I'm green bio-based polyethylene grade for Fitesa's nonwovens. Braskem.
- Ahlstrom. (2025, March). Ahlstrom to provide product-specific carbon footprint - Life cycle assessment tool empowers customers to make sustainable choices. Ahlstrom.
- USA Food and Drug Administration. (2025, January). Personal Protective Equipment for Infection Control. USA Food and Drug Administration.
- Braskem. (2025, October). Braskem unveils bio-based product innovations at K 2025. Braskem.
- INDA. (2025, June). INDA Announces 2025 World of Wipes Innovation Award® Finalists Recognizing Breakthroughs in Sustainable Wipe Technology. INDA.
This bibliography is provided for reader reference and uses primary government, standards-body, official trade body, and company sources.
This Report Answers
- What value is the soft touch nonwovens market forecast to reach in 2026 and by 2036?
- What CAGR is forecast for the soft touch nonwovens market during the 2026 to 2036 period?
- Which segments shape demand across fiber type, technology, application, end use, and sales channel categories?
- Which converter and hygiene brand pressures are expected to support purchase activity?
- How do country CAGRs differ across the United States, China, India, Germany, United Kingdom, Japan, South Korea, and Rest of World?
- Which companies compete across fiber capability, converter access, documentation depth, and service reach?
- How does FMI validate forecasts using a hybrid bottom-up and top-down methodology?
- What should converters and sourcing teams address before broader account expansion or sourcing commitment?
- How do documentation review, infection-control requirements, and supplier evidence affect vendor selection?
Frequently Asked Questions
What is driving growth in the Soft Touch Nonwovens Market?
Growth is being driven by hygiene converter demand for skin-contact comfort and high-speed line stability. Diaper, wipes and medical accounts need consistent softness and quality evidence.
Who are the key players in the Soft Touch Nonwovens Market?
Key players include Amcor and PFNonwovens; Suominen and Fitesa; Freudenberg Performance Materials and Ahlstrom; Glatfelter and Fibertex Nonwovens. Competition centers on rollstock capability, converter access and softness evidence.
What is a significant restraint in the Soft Touch Nonwovens Market?
A significant restraint is slow qualification in accounts lacking roll-history data and tactile proof. Approval teams need evidence that soft webs meet use conditions without complaint exposure.
Why should executives track the Soft Touch Nonwovens Market?
Executives should track this market due to its link with diaper quality and converter operating risk. The category affects complaint rates and retail acceptance for hygiene products sold under quality-sensitive brands.
What business problem does the Soft Touch Nonwovens Market address?
The market addresses softness consistency and roll performance during hygiene conversion at diaper and wipes plants. It helps brand teams manage skin-contact claims and line reliability before recurring material approval.
What should procurement leaders evaluate before selecting suppliers?
Procurement leaders should evaluate hand-feel evidence and roll-history records before approving supply contracts. They should also review delivery reliability and service ownership before approval across production locations.
What factors limit return on investment for converters?
Return on investment is likely to be limited by long qualification cycles and weak tactile proof. Converter downtime during trials also reduces the value of a cheaper web during qualification work.
How should suppliers build long-term account confidence?
Suppliers are expected to build confidence by giving converters clear test files and fast technical support. Repeat account access also depends on stable roll quality during high-speed hygiene conversion.
Preview the report firsthand - request a free sample
Get SampleGet the brochure for pricing and purchase details.
Get PDFTable of Content
- Key Takeaways
- Market Size and CAGR
- Top Growth Driver
- Fastest Growing Segment
- Leading Region
- Key Companies
- Emerging Opportunities
- Executive Summary
- Global Market Outlook
- Demand-side Trends
- Supply-side Trends
- Technology Roadmap Analysis
- Analysis and Recommendations
- Analyst Perspective (What is happening? Why now? What should investors know?)
- Key Questions Answered
- How large is the market?
- What is the CAGR?
- What are key trends?
- Which region dominates?
- Who are the leaders?
- Market Overview
- Market Coverage / Taxonomy
- Market Definition / Scope / Limitations
- Research Methodology
- Chapter Orientation
- Analytical Lens and Working Hypotheses
- Market Structure, Signals, and Trend Drivers
- Benchmarking and Cross-market Comparability
- Market Sizing, Forecasting, and Opportunity Mapping
- Research Design and Evidence Framework
- Desk Research Programme (Secondary Evidence)
- Expert Input and Fieldwork (Primary Evidence)
- Tooling, Models, and Reference Databases
- Data Engineering and Model Build
- Quality Assurance and Audit Trail
- Market Background
- Market Dynamics (Drivers, Restraints, Opportunity, Trends)
- Scenario Forecast (Optimistic, Likely, Conservative)
- Impact Analysis
- AI Impact
- Sustainability Impact
- Regulatory Impact
- Technology Impact
- Consumer / Buyer Analysis
- Purchase Drivers
- Adoption Barriers
- Buyer Journey
- Opportunity Map Analysis
- Product Life Cycle Analysis
- Supply Chain Analysis
- Investment Feasibility Matrix
- Value Chain Analysis
- PESTLE and Porter's Analysis
- Regulatory Landscape
- Regional Parent Market Outlook
- Production and Consumption Statistics
- Import and Export Statistics
- Global Market Analysis and Forecast, 2021 to 2036
- Historical Market Size Value (USD Mn) Analysis, 2021 to 2025
- Current and Future Market Size Value (USD Mn) Projections, 2026 to 2036
- Y-o-Y Growth Trend Analysis
- Absolute $ Opportunity Analysis
- Global Market Pricing Analysis, 2021 to 2036
- Global Market Analysis and Forecast, By Fiber Type, 2021 to 2036
- Introduction / Key Findings
- Historical Market Size Value (USD Mn) Analysis By Fiber Type, 2021 to 2025
- Current and Future Market Size Value (USD Mn) Analysis and Forecast By Fiber Type, 2026 to 2036
- polypropylene
- bicomponent fibers
- viscose or cellulosic fibers
- cotton or blends
- polypropylene
- Y-o-Y Growth Trend Analysis By Fiber Type, 2021 to 2025
- Absolute $ Opportunity Analysis By Fiber Type, 2026 to 2036
- Global Market Analysis and Forecast, By Technology, 2021 to 2036
- Introduction / Key Findings
- Historical Market Size Value (USD Mn) Analysis By Technology, 2021 to 2025
- Current and Future Market Size Value (USD Mn) Analysis and Forecast By Technology, 2026 to 2036
- spunbond
- spunlace
- airlaid
- meltblown or composite webs used in conversion
- spunbond
- Y-o-Y Growth Trend Analysis By Technology, 2021 to 2025
- Absolute $ Opportunity Analysis By Technology, 2026 to 2036
- Global Market Analysis and Forecast, By Application, 2021 to 2036
- Introduction / Key Findings
- Historical Market Size Value (USD Mn) Analysis By Application, 2021 to 2025
- Current and Future Market Size Value (USD Mn) Analysis and Forecast By Application, 2026 to 2036
- baby diapers
- feminine hygiene
- adult incontinence
- wipes or personal care
- baby diapers
- Y-o-Y Growth Trend Analysis By Application, 2021 to 2025
- Absolute $ Opportunity Analysis By Application, 2026 to 2036
- Global Market Analysis and Forecast, By End Use, 2021 to 2036
- Introduction / Key Findings
- Historical Market Size Value (USD Mn) Analysis By End Use, 2021 to 2025
- Current and Future Market Size Value (USD Mn) Analysis and Forecast By End Use, 2026 to 2036
- hygiene products
- medical or healthcare
- personal care
- home care
- hygiene products
- Y-o-Y Growth Trend Analysis By End Use, 2021 to 2025
- Absolute $ Opportunity Analysis By End Use, 2026 to 2036
- Global Market Analysis and Forecast, By Sales Channel, 2021 to 2036
- Introduction / Key Findings
- Historical Market Size Value (USD Mn) Analysis By Sales Channel, 2021 to 2025
- Current and Future Market Size Value (USD Mn) Analysis and Forecast By Sales Channel, 2026 to 2036
- direct to converters
- distributors
- private-label supply routes used for approval
- direct to converters
- Y-o-Y Growth Trend Analysis By Sales Channel, 2021 to 2025
- Absolute $ Opportunity Analysis By Sales Channel, 2026 to 2036
- Global Market Analysis and Forecast, By Region, 2021 to 2036
- Introduction
- Historical Market Size Value (USD Mn) Analysis By Region, 2021 to 2025
- Current Market Size Value (USD Mn) Analysis and Forecast By Region, 2026 to 2036
- North America
- Latin America
- Western Europe
- Eastern Europe
- East Asia
- South Asia and Pacific
- Middle East & Africa
- Market Attractiveness Analysis By Region
- North America Market Analysis and Forecast, By Country, 2021 to 2036
- Historical Market Size Value (USD Mn) Trend Analysis By Market Taxonomy, 2021 to 2025
- Market Size Value (USD Mn) Forecast By Market Taxonomy, 2026 to 2036
- By Country
- USA
- Canada
- By Fiber Type
- By Technology
- By Application
- By End Use
- By Sales Channel
- By Country
- Market Attractiveness Analysis
- By Country
- By Fiber Type
- By Technology
- By Application
- By End Use
- By Sales Channel
- Key Takeaways
- Latin America Market Analysis and Forecast, By Country
- Historical Market Size Value (USD Mn) Trend Analysis By Market Taxonomy, 2021 to 2025
- Market Size Value (USD Mn) Forecast By Market Taxonomy, 2026 to 2036
- By Country
- Brazil
- Mexico
- Chile
- Rest of Latin America
- By Fiber Type
- By Technology
- By Application
- By End Use
- By Sales Channel
- By Country
- Market Attractiveness Analysis
- By Country
- By Fiber Type
- By Technology
- By Application
- By End Use
- By Sales Channel
- Key Takeaways
- Western Europe Market Analysis and Forecast, By Country
- Historical Market Size Value (USD Mn) Trend Analysis By Market Taxonomy, 2021 to 2025
- Market Size Value (USD Mn) Forecast By Market Taxonomy, 2026 to 2036
- By Country
- Germany
- UK
- Italy
- Spain
- France
- Nordic
- BENELUX
- Rest of Western Europe
- By Fiber Type
- By Technology
- By Application
- By End Use
- By Sales Channel
- By Country
- Market Attractiveness Analysis
- By Country
- By Fiber Type
- By Technology
- By Application
- By End Use
- By Sales Channel
- Key Takeaways
- Eastern Europe Market Analysis and Forecast, By Country
- Historical Market Size Value (USD Mn) Trend Analysis By Market Taxonomy, 2021 to 2025
- Market Size Value (USD Mn) Forecast By Market Taxonomy, 2026 to 2036
- By Country
- Russia
- Poland
- Hungary
- Balkan & Baltic
- Rest of Eastern Europe
- By Fiber Type
- By Technology
- By Application
- By End Use
- By Sales Channel
- By Country
- Market Attractiveness Analysis
- By Country
- By Fiber Type
- By Technology
- By Application
- By End Use
- By Sales Channel
- Key Takeaways
- East Asia Market Analysis and Forecast, By Country
- Historical Market Size Value (USD Mn) Trend Analysis By Market Taxonomy, 2021 to 2025
- Market Size Value (USD Mn) Forecast By Market Taxonomy, 2026 to 2036
- By Country
- China
- Japan
- South Korea
- By Fiber Type
- By Technology
- By Application
- By End Use
- By Sales Channel
- By Country
- Market Attractiveness Analysis
- By Country
- By Fiber Type
- By Technology
- By Application
- By End Use
- By Sales Channel
- Key Takeaways
- South Asia and Pacific Market Analysis and Forecast, By Country
- Historical Market Size Value (USD Mn) Trend Analysis By Market Taxonomy, 2021 to 2025
- Market Size Value (USD Mn) Forecast By Market Taxonomy, 2026 to 2036
- By Country
- India
- ASEAN
- Australia & New Zealand
- Rest of South Asia and Pacific
- By Fiber Type
- By Technology
- By Application
- By End Use
- By Sales Channel
- By Country
- Market Attractiveness Analysis
- By Country
- By Fiber Type
- By Technology
- By Application
- By End Use
- By Sales Channel
- Key Takeaways
- Middle East & Africa Market Analysis and Forecast, By Country
- Historical Market Size Value (USD Mn) Trend Analysis By Market Taxonomy, 2021 to 2025
- Market Size Value (USD Mn) Forecast By Market Taxonomy, 2026 to 2036
- By Country
- Kingdom of Saudi Arabia
- Other GCC Countries
- Türkiye
- South Africa
- Other African Union
- Rest of Middle East & Africa
- By Fiber Type
- By Technology
- By Application
- By End Use
- By Sales Channel
- By Country
- Market Attractiveness Analysis
- By Country
- By Fiber Type
- By Technology
- By Application
- By End Use
- By Sales Channel
- Key Takeaways
- Key Countries Market Analysis
- USA
- Pricing Analysis
- Market Share Analysis, 2025
- By Fiber Type
- By Technology
- By Application
- By End Use
- By Sales Channel
- Canada
- Pricing Analysis
- Market Share Analysis, 2025
- By Fiber Type
- By Technology
- By Application
- By End Use
- By Sales Channel
- Mexico
- Pricing Analysis
- Market Share Analysis, 2025
- By Fiber Type
- By Technology
- By Application
- By End Use
- By Sales Channel
- Brazil
- Pricing Analysis
- Market Share Analysis, 2025
- By Fiber Type
- By Technology
- By Application
- By End Use
- By Sales Channel
- Chile
- Pricing Analysis
- Market Share Analysis, 2025
- By Fiber Type
- By Technology
- By Application
- By End Use
- By Sales Channel
- Germany
- Pricing Analysis
- Market Share Analysis, 2025
- By Fiber Type
- By Technology
- By Application
- By End Use
- By Sales Channel
- UK
- Pricing Analysis
- Market Share Analysis, 2025
- By Fiber Type
- By Technology
- By Application
- By End Use
- By Sales Channel
- Italy
- Pricing Analysis
- Market Share Analysis, 2025
- By Fiber Type
- By Technology
- By Application
- By End Use
- By Sales Channel
- Spain
- Pricing Analysis
- Market Share Analysis, 2025
- By Fiber Type
- By Technology
- By Application
- By End Use
- By Sales Channel
- France
- Pricing Analysis
- Market Share Analysis, 2025
- By Fiber Type
- By Technology
- By Application
- By End Use
- By Sales Channel
- India
- Pricing Analysis
- Market Share Analysis, 2025
- By Fiber Type
- By Technology
- By Application
- By End Use
- By Sales Channel
- ASEAN
- Pricing Analysis
- Market Share Analysis, 2025
- By Fiber Type
- By Technology
- By Application
- By End Use
- By Sales Channel
- Australia & New Zealand
- Pricing Analysis
- Market Share Analysis, 2025
- By Fiber Type
- By Technology
- By Application
- By End Use
- By Sales Channel
- China
- Pricing Analysis
- Market Share Analysis, 2025
- By Fiber Type
- By Technology
- By Application
- By End Use
- By Sales Channel
- Japan
- Pricing Analysis
- Market Share Analysis, 2025
- By Fiber Type
- By Technology
- By Application
- By End Use
- By Sales Channel
- South Korea
- Pricing Analysis
- Market Share Analysis, 2025
- By Fiber Type
- By Technology
- By Application
- By End Use
- By Sales Channel
- Russia
- Pricing Analysis
- Market Share Analysis, 2025
- By Fiber Type
- By Technology
- By Application
- By End Use
- By Sales Channel
- Poland
- Pricing Analysis
- Market Share Analysis, 2025
- By Fiber Type
- By Technology
- By Application
- By End Use
- By Sales Channel
- Hungary
- Pricing Analysis
- Market Share Analysis, 2025
- By Fiber Type
- By Technology
- By Application
- By End Use
- By Sales Channel
- Kingdom of Saudi Arabia
- Pricing Analysis
- Market Share Analysis, 2025
- By Fiber Type
- By Technology
- By Application
- By End Use
- By Sales Channel
- Türkiye
- Pricing Analysis
- Market Share Analysis, 2025
- By Fiber Type
- By Technology
- By Application
- By End Use
- By Sales Channel
- South Africa
- Pricing Analysis
- Market Share Analysis, 2025
- By Fiber Type
- By Technology
- By Application
- By End Use
- By Sales Channel
- USA
- Market Structure Analysis
- Competition Dashboard
- Competition Benchmarking
- Market Share Analysis of Top Players
- By Regional
- By Fiber Type
- By Technology
- By Application
- By End Use
- By Sales Channel
- Emerging Startups
- Innovation Benchmarking
- Competition Analysis
- Competition Deep Dive
- Amcor (Berry Global nonwovens assets)
- Overview
- Product Portfolio
- Profitability by Market Segments
- Sales Footprint
- Strategy Overview
- Marketing Strategy
- Product Strategy
- Channel Strategy
- Freudenberg Performance Materials
- Suominen
- Fitesa
- Ahlstrom
- Kimberly-Clark Professional
- PFNonwovens
- Avgol
- Glatfelter
- Fibertex Nonwovens
- Amcor (Berry Global nonwovens assets)
- Case Studies
- Success Stories
- Recent Developments
- Competition Deep Dive
- Assumptions & Acronyms Used


