
- Market Size (2026)
- USD 5.9 Bn
- Forecast (2036)
- USD 31.8 Bn
- CAGR (2026 to 2036)
- 18.3%
How big is the solar microinverter market in 2026?
The solar microinverter market is estimated at USD 5.9 billion in 2026 and is forecast to reach USD 31.8 billion by 2036, at an 18.3% CAGR from 2026 to 2036.
Converting electricity close to each photovoltaic module changes both the design and servicing of a solar installation, making module compatibility and the complete electrical arrangement central to microinverter selection. Installers also need a way to identify and replace a failed unit after the roof is occupied, when physical access can be more difficult than during construction. Residential installations lead the 2026 end-use mix, while standalone devices and three-phase systems lead the product and phase classifications respectively. Commercial products must fit the site's supply and connection requirements, and small plug-in systems bring additional questions about complete-system certification and local connection rules. Research into new circuit designs expands the available engineering options, although prototype performance remains a separate step from qualification and sustained operation. Through 2036, clear installation documentation, workable fault diagnosis and dependable service arrangements will influence how readily suitable systems reach installation.
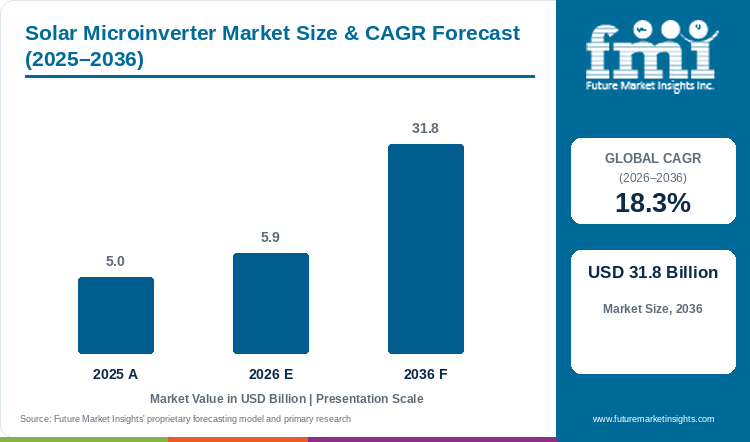
Key Market Trends & Insights
- The Standalone Microinverters segment is projected to account for 61.4% of product type demand in 2026.
- The Three Phase segment is projected to account for 54.0% of phase configuration demand in 2026.
- Residential is projected to account for 59.0% of end use demand in 2026.
- Module Level Power Electronics (MLPE) is projected to account for 42.0% of technology demand in 2026.
Regional Highlights
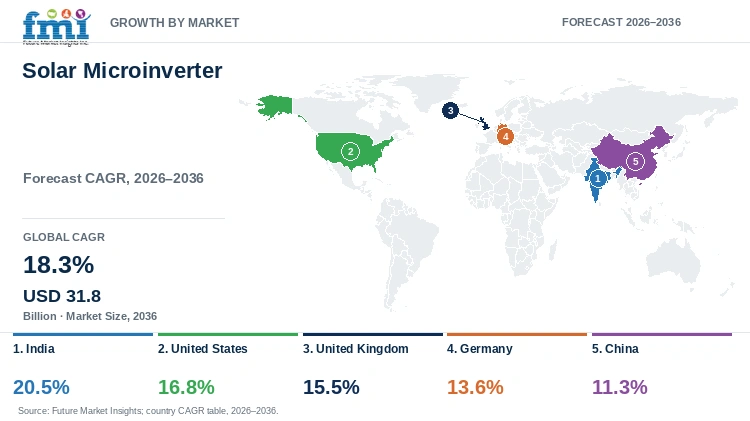
- India records the highest profiled forecast at 20.5% CAGR from 2026 to 2036.
- China is forecast at 11.3% CAGR over the same period. Country and combined-market rates are analyst estimates.
Market Size & Forecast
Table 1: Market Size and Forecast for Solar Microinverter Market, 2026 to 2036
| Metric | Value |
|---|---|
| 2025 market value | USD 5.0 billion |
| 2026 market estimate | USD 5.9 billion |
| 2036 market forecast | USD 31.8 billion |
| CAGR, 2026 to 2036 | 18.3% |
Purchasing Evidence and Operating Requirements
Table 2: Purchasing Evidence and Operating Requirements
| Source | Date | Evidence | Coverage |
|---|---|---|---|
| Enphase Energy | 2025-09-08 | Product pre-order announcement | U.S. commercial microinverter pre-orders announced September 2025.[1] |
| Elbaksawi and colleagues, Port Said University | 2025-08-22 | Laboratory prototype and simulation | Simulation and prototype study published 2025.[2] |
| VDE and DKE | 2025-11-14 | Standard publication announcement | Announcement November 2025; specified publication December 2025.[3] |
| Gerber and colleagues | 2025-04-21 | Technical and regulatory review | Regulatory and technical review as published April 2025.[4] |
Analyst Perspective
Microinverter value extends beyond initial conversion capability because the device must remain compatible with the modules, connection arrangement and service method of the complete installation. Planning fault identification and roof access before construction helps customers assess support requirements across the system's working life.
- Nikhil Kaitwade, Principal Analyst at Future Market Insights
How is the solar microinverter market segmented?
By product type, the categories are Standalone Microinverters, Integrated Microinverters. By phase configuration, the categories are Three Phase, Single Phase. By end use, the categories are Residential, Commercial, Industrial - Utility. By technology, the categories are Module Level Power Electronics (MLPE), Wireless Communication Enabled Systems, Advanced Semiconductor Based Systems. By installation type, the categories are New Installations, Retrofit Installations.
Why does the Standalone Microinverters segment account for 61.4% of product type demand in 2026?
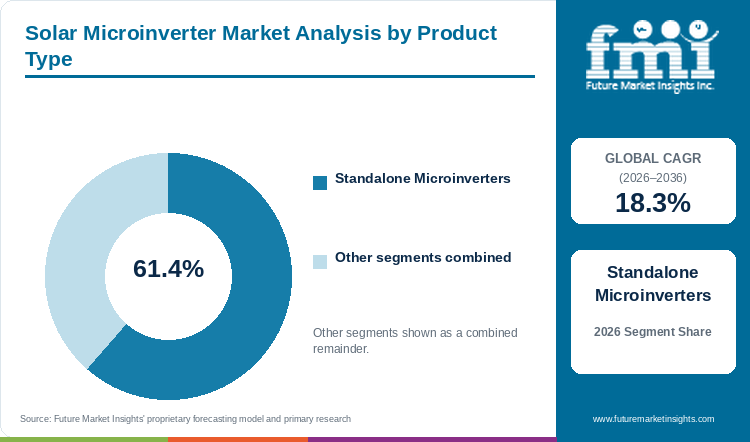
Standalone Microinverters represent 61.4% of product type demand in 2026, with individual conversion devices needing compatible module inputs and communications within the wider PV system.
Table 3: Product Type Share for Solar Microinverter Market, 2026
| Product Type | Share (2026) |
|---|---|
| Standalone Microinverters | 61.4% |
| Other product type segments | 38.6% |
| Total | 100.0% |
A failed standalone device can be harder to reach after the roof is fully occupied than during the initial array build, making replacement access an early design consideration. Solar mounting structures influence that access beneath the modules, while electrical inputs and communications establish whether the selected microinverter can work within the proposed system. The category's large share therefore carries a continuing support requirement, with the installer needing a clear way to identify the affected unit and replace it without unnecessary work on the rest of the array.
- The Standalone Microinverters segment accounts for 61.4% of product type demand in 2026.
- Roof access affects the service cost of individual conversion devices.
Why does the Three Phase segment account for 54.0% of phase configuration demand in 2026?
Three Phase systems account for 54.0% of phase configuration demand in 2026, describing the supply arrangement that the microinverter installation and its protection must accommodate.
Table 4: Phase Configuration Share for Solar Microinverter Market, 2026
| Phase Configuration | Share (2026) |
|---|---|
| Three Phase | 54.0% |
| Other phase configuration segments | 46.0% |
| Total | 100.0% |
Phase configuration concerns the electrical installation into which the devices connect, so a Three Phase product has to be assessed with the site's distribution and protection arrangements. That work belongs with the project's electrical design before equipment is selected, allowing the proposed conversion system to fit the actual supply. Product choice can then be compared on compatibility and service support within that arrangement, with installation documentation explaining how the complete system will be connected and maintained after commissioning.
- The Three Phase segment accounts for 54.0% of phase configuration demand in 2026.
- Three-phase systems need a compatible supply arrangement.
What are the drivers, restraints, and opportunities in the solar microinverter market?
Driver: Commercial products widen installation options
Enphase's September 2025 announcement opened United States pre-orders for a three-phase commercial microinverter, illustrating the development of products for commercial solar installations.[1] Electrical enclosures provide space for the associated connection and protection equipment, which needs to be coordinated with the installation's supply arrangement and service access.
Restraint: Complete-system approval can constrain small installations
VDE's 2025 announcement distinguishes inverter feed-in and module power within a defined plug-in-system scope, while Berkeley Lab's coauthored review discusses safety and interconnection barriers.[3][4] The complete installation therefore needs its applicable requirements established before ordering, with test and measurement equipment supporting technical evaluation within the necessary certification process.
Opportunity: Circuit innovation creates product development options
Port Said University's study verified a standalone thin-film-capacitor microinverter prototype and examined the grid-connected arrangement through simulation, leaving further qualification for that operating context.[2] Around the resulting installation, cable compounds need to provide insulation compatible with the electrical design and the conditions the connected components will encounter.
Which country and market growth rates are profiled?
Table 5: Country CAGR Comparison for Solar Microinverter Market, 2026 to 2036
| Country | CAGR |
|---|---|
| India | 20.5% |
| United States | 16.8% |
| United Kingdom | 15.5% |
| Germany | 13.6% |
| China | 11.3% |
Growth rates in the table are FMI analyst forecasts.
Country-wise Analysis
India
India's 20.5% CAGR forecast for 2026 to 2036 is the strongest in the country profiles, placing a substantial installation opportunity alongside the need for capable local support. A module-level arrangement can involve higher conversion costs and more devices on the roof, making warranty handling and practical replacement access consequential to ownership. Selection therefore needs to connect the proposed modules and electrical supply with an installer who can diagnose faults and maintain the system after the original construction work is complete.
United States
Enphase announced United States commercial microinverter pre-orders in September 2025, identifying product activity before delivery and installation are established.[1] The wider market is forecast at 16.8% CAGR over 2026 to 2036, with new product choice becoming useful when module compatibility and site connection requirements can be satisfied together. Local support also needs to follow the selected arrangement, allowing customers to assess the installation and warranty proposition alongside the device specification rather than treating a product announcement as an installed outcome.
United Kingdom
Fault identification can determine how much roof work is needed when one microinverter fails on a United Kingdom array. A design that preserves device access and records the installed configuration gives the service team a clearer route to replacement, particularly once the roof is occupied. These ownership considerations accompany the 15.5% CAGR forecast from 2026 to 2036, with compatibility documentation needing to reflect the proposed electrical connection and the physical conditions under which the system will be maintained.
Germany
Germany's plug-in-solar pre-standard distinguishes inverter feed-in power from module power under defined plug arrangements and excludes some rooftop and storage configurations.[3] The distinction matters before a supplier presents a small system as suitable for a particular connection, because the complete product arrangement determines which scope applies. Germany's demand forecast is 13.6% CAGR during 2026 to 2036, with proposals needing clear product and connection information so that installers can qualify the intended use against the relevant requirements.
China
Chinese manufacturing and installation opportunities involve different product and grid configurations, leaving destination-specific qualification to be established even where supply is broad. An export product's approvals cannot be assumed to describe domestic installation demand, which is forecast to grow at 11.3% CAGR from 2026 to 2036. Purchasers need confirmed module compatibility and a workable support arrangement for the selected market, allowing the device to be assessed as part of the system it will actually serve.
Who are the notable companies in the solar microinverter market?
Enphase Energy Inc.; Hoymiles Power Electronics Inc.; Altenergy Power System; Zhejiang Envertech; AEconversion GmbH
Enphase, Hoymiles, APsystems, Envertech and AEconversion provide relevant microinverter products whose suitability depends on module compatibility and the destination installation. Comparing the selected device and local support gives the installer a practical basis for qualification, including the connection arrangement and service method required after the array enters use.
Competitive Benchmarking: Solar Microinverter Market
Table 6: Competitive Benchmarking
| Participant | Relevant portfolio | Purchasing comparison |
|---|---|---|
| Enphase Energy Inc. | Module-level inverter systems | Compatibility and service platform |
| Hoymiles Power Electronics Inc. | Microinverter products | Electrical configuration and support |
| Altenergy Power System | APsystems microinverters | System architecture and installation |
| Zhejiang Envertech | Microinverter products | Product qualification and compatibility |
| AEconversion GmbH | Module-level conversion | Application and connection requirements |
Key Developments in the Solar Microinverter Market
- Enphase announced U.S. pre-orders for its IQ9N-3P commercial microinverter in September 2025, with production shipments then expected in December 2025.[1]
- VDE announced its plug-in-solar product pre-standard in November 2025 for December publication, including distinct inverter and module-power limits within the stated scope.[3]
Key Players in the Solar Microinverter Market
- Enphase Energy Inc.: Module-level inverter systems.
- Hoymiles Power Electronics Inc.: Microinverter products.
- Altenergy Power System: APsystems microinverters.
- Zhejiang Envertech: Microinverter products.
- AEconversion GmbH: Module-level conversion.
Solar Microinverter Market - Report Scope
Table 7: Report Scope for Solar Microinverter Market
| Coverage field | Report scope |
|---|---|
| Market definition | Module-level photovoltaic inverters and their use in rooftop and small plug-in solar systems. |
| Historical reference year | 2025 |
| Market breakdown | product type, phase configuration, end use, technology, installation type |
| Quantitative Units | USD Billion |
| Regions covered | North America; Latin America; Western Europe; Eastern Europe; East Asia; South Asia and Pacific; Middle East and Africa |
| Countries profiled | India; United States; United Kingdom; Germany; China |
| Forecast period | 2026 to 2036 |
| Key companies profiled | Enphase Energy Inc.; Hoymiles Power Electronics Inc.; Altenergy Power System; Zhejiang Envertech; AEconversion GmbH |
Solar Microinverter Market - Research Methodology
Table 8: Research Methodology
| Method | Approach |
|---|---|
| Quantitative analysis | Market values, category shares and country forecasts are presented as FMI analyst estimates. |
| Desk research | Government records, public procurement and technical research establish application conditions and documented activity. |
| Evidence assessment | Awards are distinguished from tenders. Laboratory and modeled results retain their stated operating limits. |
| Segmentation framework | Shares use the stated segment axis as their denominator; country rates use the stated forecast period. |
Solar Microinverter Market by Segments
Product Type
- Standalone Microinverters
- Integrated Microinverters
Phase Configuration
- Three Phase
- Single Phase
End Use
- Residential
- Commercial
- Industrial - Utility
Technology
- Module Level Power Electronics (MLPE)
- Wireless Communication Enabled Systems
- Advanced Semiconductor Based Systems
Installation Type
- New Installations
- Retrofit Installations
Solar Microinverter Market by Region
- North America
- United States
- Canada
- Latin America
- Brazil
- Mexico
- Argentina
- Chile
- Western Europe
- Germany
- France
- United Kingdom
- Italy
- Spain
- Benelux
- Nordics
- Eastern Europe
- Poland
- Czech Republic
- Romania
- Hungary
- East Asia
- China
- Japan
- South Korea
- South Asia and Pacific
- India
- ASEAN
- Australia and New Zealand
- Middle East and Africa
- GCC Countries
- South Africa
- Türkiye
- Israel
Research Sources and Bibliography
- [1] Enphase Energy. (2025-09-08). Enphase Energy Opens U.S. Pre-Orders for IQ9 Commercial Microinverters with GaN, Built for 480 V Three-Phase Systems
- [2] Elbaksawi and colleagues, Port Said University; Scientific Reports. (2025-08-22). A novel wide input range transformerless PV microinverter with natural power decoupling
- [3] VDE and DKE. (2025-11-14). DKE publishes world's first product standard for plug-in solar devices
- [4] Gerber and colleagues; Lawrence Berkeley National Laboratory; Energies. (2025-04-21). Barriers to Balcony Solar and Plug-In Distributed Energy Resources in the United States
- Future Market Insights. (2026). Solar Microinverter Market: Global industry analysis and opportunity assessment 2036.
This Report Answers
- How large is the solar microinverter market in 2026?
- What market value is forecast for 2036?
- Which product type category leads in 2026?
- Why does Three Phase lead its category?
- Which profiled market has the highest forecast growth?
- Which companies participate in the solar microinverter market?
Table of Content
Table of Content
- Key Takeaways
- Market Size and CAGR
- Top Growth Driver
- Fastest Growing Segment
- Leading Region
- Key Companies
- Emerging Opportunities
- Executive Summary
- Global Market Outlook
- Demand-side Trends
- Supply-side Trends
- Technology Roadmap Analysis
- Analysis and Recommendations
- Analyst Perspective (What is happening? Why now? What should investors know?)
- Key Questions Answered
- How large is the market?
- What is the CAGR?
- What are key trends?
- Which region dominates?
- Who are the leaders?
Read More...
- Market Overview
- Market Coverage / Taxonomy
- Market Definition / Scope / Limitations
- Research Methodology
- Chapter Orientation
- Analytical Lens and Working Hypotheses
- Market Structure, Signals, and Trend Drivers
- Benchmarking and Cross-market Comparability
- Market Sizing, Forecasting, and Opportunity Mapping
- Research Design and Evidence Framework
- Desk Research Programme (Secondary Evidence)
- Expert Input and Fieldwork (Primary Evidence)
- Tooling, Models, and Reference Databases
- Data Engineering and Model Build
- Quality Assurance and Audit Trail
- Market Background
- Market Dynamics (Drivers, Restraints, Opportunity, Trends)
- Scenario Forecast (Optimistic, Likely, Conservative)
- Impact Analysis
- AI Impact
- Sustainability Impact
- Regulatory Impact
- Technology Impact
- Consumer / Buyer Analysis
- Purchase Drivers
- Adoption Barriers
- Buyer Journey
- Opportunity Map Analysis
- Product Life Cycle Analysis
- Supply Chain Analysis
- Investment Feasibility Matrix
- Value Chain Analysis
- PESTLE and Porter's Analysis
- Regulatory Landscape
- Regional Parent Market Outlook
- Production and Consumption Statistics
- Import and Export Statistics
- Global Market Analysis and Forecast, 2021 to 2036
- Historical Market Size Value (USD Billion) Analysis, 2021 to 2025
- Current and Future Market Size Value (USD Billion) Projections, 2026 to 2036
- Y-o-Y Growth Trend Analysis
- Absolute $ Opportunity Analysis
- Global Market Pricing Analysis, 2021 to 2036
- Global Market Analysis and Forecast, By Product Type, 2021 to 2036
- Introduction / Key Findings
- Historical Market Size Value (USD Billion) Analysis By Product Type, 2021 to 2025
- Current and Future Market Size Value (USD Billion) Analysis and Forecast By Product Type, 2026 to 2036
- Standalone Microinverters
- Integrated Microinverters
- Y-o-Y Growth Trend Analysis By Product Type, 2021 to 2025
- Absolute $ Opportunity Analysis By Product Type, 2026 to 2036
- Global Market Analysis and Forecast, By Phase Configuration, 2021 to 2036
- Introduction / Key Findings
- Historical Market Size Value (USD Billion) Analysis By Phase Configuration, 2021 to 2025
- Current and Future Market Size Value (USD Billion) Analysis and Forecast By Phase Configuration, 2026 to 2036
- Three Phase
- Single Phase
- Y-o-Y Growth Trend Analysis By Phase Configuration, 2021 to 2025
- Absolute $ Opportunity Analysis By Phase Configuration, 2026 to 2036
- Global Market Analysis and Forecast, By End Use, 2021 to 2036
- Introduction / Key Findings
- Historical Market Size Value (USD Billion) Analysis By End Use, 2021 to 2025
- Current and Future Market Size Value (USD Billion) Analysis and Forecast By End Use, 2026 to 2036
- Residential
- Commercial
- Industrial - Utility
- Y-o-Y Growth Trend Analysis By End Use, 2021 to 2025
- Absolute $ Opportunity Analysis By End Use, 2026 to 2036
- Global Market Analysis and Forecast, By Technology, 2021 to 2036
- Introduction / Key Findings
- Historical Market Size Value (USD Billion) Analysis By Technology, 2021 to 2025
- Current and Future Market Size Value (USD Billion) Analysis and Forecast By Technology, 2026 to 2036
- Module Level Power Electronics (MLPE)
- Wireless Communication Enabled Systems
- Advanced Semiconductor Based Systems
- Y-o-Y Growth Trend Analysis By Technology, 2021 to 2025
- Absolute $ Opportunity Analysis By Technology, 2026 to 2036
- Global Market Analysis and Forecast, By Installation Type, 2021 to 2036
- Introduction / Key Findings
- Historical Market Size Value (USD Billion) Analysis By Installation Type, 2021 to 2025
- Current and Future Market Size Value (USD Billion) Analysis and Forecast By Installation Type, 2026 to 2036
- New Installations
- Retrofit Installations
- Y-o-Y Growth Trend Analysis By Installation Type, 2021 to 2025
- Absolute $ Opportunity Analysis By Installation Type, 2026 to 2036
- Global Market Analysis and Forecast, By Region, 2021 to 2036
- Introduction
- Historical Market Size Value (USD Billion) Analysis By Region, 2021 to 2025
- Current Market Size Value (USD Billion) Analysis and Forecast By Region, 2026 to 2036
- North America
- Latin America
- Western Europe
- Eastern Europe
- East Asia
- South Asia and Pacific
- Middle East and Africa
- Market Attractiveness Analysis By Region
- North America Market Analysis and Forecast, By Country, 2021 to 2036
- Historical Market Size Value (USD Billion) Trend Analysis By Market Taxonomy, 2021 to 2025
- Market Size Value (USD Billion) Forecast By Market Taxonomy, 2026 to 2036
- By Country
- United States
- Canada
- By Product Type
- By Phase Configuration
- By End Use
- By Technology
- By Installation Type
- By Country
- Market Attractiveness Analysis
- By Country
- By Product Type
- By Phase Configuration
- By End Use
- By Technology
- By Installation Type
- Key Takeaways
- Latin America Market Analysis and Forecast, By Country
- Historical Market Size Value (USD Billion) Trend Analysis By Market Taxonomy, 2021 to 2025
- Market Size Value (USD Billion) Forecast By Market Taxonomy, 2026 to 2036
- By Country
- Brazil
- Mexico
- Argentina
- Chile
- By Product Type
- By Phase Configuration
- By End Use
- By Technology
- By Installation Type
- By Country
- Market Attractiveness Analysis
- By Country
- By Product Type
- By Phase Configuration
- By End Use
- By Technology
- By Installation Type
- Key Takeaways
- Western Europe Market Analysis and Forecast, By Country
- Historical Market Size Value (USD Billion) Trend Analysis By Market Taxonomy, 2021 to 2025
- Market Size Value (USD Billion) Forecast By Market Taxonomy, 2026 to 2036
- By Country
- Germany
- France
- United Kingdom
- Italy
- Spain
- Benelux
- Nordics
- By Product Type
- By Phase Configuration
- By End Use
- By Technology
- By Installation Type
- By Country
- Market Attractiveness Analysis
- By Country
- By Product Type
- By Phase Configuration
- By End Use
- By Technology
- By Installation Type
- Key Takeaways
- Eastern Europe Market Analysis and Forecast, By Country
- Historical Market Size Value (USD Billion) Trend Analysis By Market Taxonomy, 2021 to 2025
- Market Size Value (USD Billion) Forecast By Market Taxonomy, 2026 to 2036
- By Country
- Poland
- Czech Republic
- Romania
- Hungary
- By Product Type
- By Phase Configuration
- By End Use
- By Technology
- By Installation Type
- By Country
- Market Attractiveness Analysis
- By Country
- By Product Type
- By Phase Configuration
- By End Use
- By Technology
- By Installation Type
- Key Takeaways
- East Asia Market Analysis and Forecast, By Country
- Historical Market Size Value (USD Billion) Trend Analysis By Market Taxonomy, 2021 to 2025
- Market Size Value (USD Billion) Forecast By Market Taxonomy, 2026 to 2036
- By Country
- China
- Japan
- South Korea
- By Product Type
- By Phase Configuration
- By End Use
- By Technology
- By Installation Type
- By Country
- Market Attractiveness Analysis
- By Country
- By Product Type
- By Phase Configuration
- By End Use
- By Technology
- By Installation Type
- Key Takeaways
- South Asia and Pacific Market Analysis and Forecast, By Country
- Historical Market Size Value (USD Billion) Trend Analysis By Market Taxonomy, 2021 to 2025
- Market Size Value (USD Billion) Forecast By Market Taxonomy, 2026 to 2036
- By Country
- India
- ASEAN
- Australia and New Zealand
- By Product Type
- By Phase Configuration
- By End Use
- By Technology
- By Installation Type
- By Country
- Market Attractiveness Analysis
- By Country
- By Product Type
- By Phase Configuration
- By End Use
- By Technology
- By Installation Type
- Key Takeaways
- Middle East and Africa Market Analysis and Forecast, By Country
- Historical Market Size Value (USD Billion) Trend Analysis By Market Taxonomy, 2021 to 2025
- Market Size Value (USD Billion) Forecast By Market Taxonomy, 2026 to 2036
- By Country
- GCC Countries
- South Africa
- Türkiye
- Israel
- By Product Type
- By Phase Configuration
- By End Use
- By Technology
- By Installation Type
- By Country
- Market Attractiveness Analysis
- By Country
- By Product Type
- By Phase Configuration
- By End Use
- By Technology
- By Installation Type
- Key Takeaways
- Key Countries Market Analysis
- United States
- Pricing Analysis
- Market Share Analysis, 2025
- By Product Type
- By Phase Configuration
- By End Use
- By Technology
- By Installation Type
- Canada
- Pricing Analysis
- Market Share Analysis, 2025
- By Product Type
- By Phase Configuration
- By End Use
- By Technology
- By Installation Type
- Mexico
- Pricing Analysis
- Market Share Analysis, 2025
- By Product Type
- By Phase Configuration
- By End Use
- By Technology
- By Installation Type
- Brazil
- Pricing Analysis
- Market Share Analysis, 2025
- By Product Type
- By Phase Configuration
- By End Use
- By Technology
- By Installation Type
- Chile
- Pricing Analysis
- Market Share Analysis, 2025
- By Product Type
- By Phase Configuration
- By End Use
- By Technology
- By Installation Type
- Germany
- Pricing Analysis
- Market Share Analysis, 2025
- By Product Type
- By Phase Configuration
- By End Use
- By Technology
- By Installation Type
- United Kingdom
- Pricing Analysis
- Market Share Analysis, 2025
- By Product Type
- By Phase Configuration
- By End Use
- By Technology
- By Installation Type
- Italy
- Pricing Analysis
- Market Share Analysis, 2025
- By Product Type
- By Phase Configuration
- By End Use
- By Technology
- By Installation Type
- Spain
- Pricing Analysis
- Market Share Analysis, 2025
- By Product Type
- By Phase Configuration
- By End Use
- By Technology
- By Installation Type
- France
- Pricing Analysis
- Market Share Analysis, 2025
- By Product Type
- By Phase Configuration
- By End Use
- By Technology
- By Installation Type
- India
- Pricing Analysis
- Market Share Analysis, 2025
- By Product Type
- By Phase Configuration
- By End Use
- By Technology
- By Installation Type
- ASEAN
- Pricing Analysis
- Market Share Analysis, 2025
- By Product Type
- By Phase Configuration
- By End Use
- By Technology
- By Installation Type
- Australia and New Zealand
- Pricing Analysis
- Market Share Analysis, 2025
- By Product Type
- By Phase Configuration
- By End Use
- By Technology
- By Installation Type
- China
- Pricing Analysis
- Market Share Analysis, 2025
- By Product Type
- By Phase Configuration
- By End Use
- By Technology
- By Installation Type
- Japan
- Pricing Analysis
- Market Share Analysis, 2025
- By Product Type
- By Phase Configuration
- By End Use
- By Technology
- By Installation Type
- South Korea
- Pricing Analysis
- Market Share Analysis, 2025
- By Product Type
- By Phase Configuration
- By End Use
- By Technology
- By Installation Type
- Poland
- Pricing Analysis
- Market Share Analysis, 2025
- By Product Type
- By Phase Configuration
- By End Use
- By Technology
- By Installation Type
- Hungary
- Pricing Analysis
- Market Share Analysis, 2025
- By Product Type
- By Phase Configuration
- By End Use
- By Technology
- By Installation Type
- Türkiye
- Pricing Analysis
- Market Share Analysis, 2025
- By Product Type
- By Phase Configuration
- By End Use
- By Technology
- By Installation Type
- South Africa
- Pricing Analysis
- Market Share Analysis, 2025
- By Product Type
- By Phase Configuration
- By End Use
- By Technology
- By Installation Type
- United States
- Market Structure Analysis
- Competition Dashboard
- Competition Benchmarking
- Market Share Analysis of Top Players
- By Regional
- By Product Type
- By Phase Configuration
- By End Use
- By Technology
- By Installation Type
- Emerging Startups
- Innovation Benchmarking
- Competition Analysis
- Competition Deep Dive
- Enphase Energy Inc.
- Overview
- Product Portfolio
- Profitability by Market Segments
- Sales Footprint
- Strategy Overview
- Marketing Strategy
- Product Strategy
- Channel Strategy
- Hoymiles Power Electronics Inc.
- Altenergy Power System
- Zhejiang Envertech
- AEconversion GmbH
- Enphase Energy Inc.: Module-level inverter systems.
- Hoymiles Power Electronics Inc.: Microinverter products.
- Altenergy Power System: APsystems microinverters.
- Zhejiang Envertech: Microinverter products.
- AEconversion GmbH: Module-level conversion.
- Enphase Energy Inc.
- Case Studies
- Success Stories
- Recent Developments
- Competition Deep Dive
- Assumptions & Acronyms Used
List of Tables
- Table 1: Global Market Value (USD Billion) Forecast by Region, 2021 to 2036
- Table 2: Global Market Value (USD Billion) Forecast by Product Type, 2021 to 2036
- Table 3: Global Market Value (USD Billion) Forecast by Phase Configuration, 2021 to 2036
- Table 4: Global Market Value (USD Billion) Forecast by End Use, 2021 to 2036
- Table 5: Global Market Value (USD Billion) Forecast by Technology, 2021 to 2036
- Table 6: Global Market Value (USD Billion) Forecast by Installation Type, 2021 to 2036
- Table 7: North America Market Value (USD Billion) Forecast by Country, 2021 to 2036
- Table 8: North America Market Value (USD Billion) Forecast by Product Type, 2021 to 2036
- Table 9: North America Market Value (USD Billion) Forecast by Phase Configuration, 2021 to 2036
- Table 10: North America Market Value (USD Billion) Forecast by End Use, 2021 to 2036
- Table 11: North America Market Value (USD Billion) Forecast by Technology, 2021 to 2036
- Table 12: North America Market Value (USD Billion) Forecast by Installation Type, 2021 to 2036
- Table 13: Latin America Market Value (USD Billion) Forecast by Country, 2021 to 2036
- Table 14: Latin America Market Value (USD Billion) Forecast by Product Type, 2021 to 2036
- Table 15: Latin America Market Value (USD Billion) Forecast by Phase Configuration, 2021 to 2036
- Table 16: Latin America Market Value (USD Billion) Forecast by End Use, 2021 to 2036
- Table 17: Latin America Market Value (USD Billion) Forecast by Technology, 2021 to 2036
- Table 18: Latin America Market Value (USD Billion) Forecast by Installation Type, 2021 to 2036
- Table 19: Western Europe Market Value (USD Billion) Forecast by Country, 2021 to 2036
- Table 20: Western Europe Market Value (USD Billion) Forecast by Product Type, 2021 to 2036
- Table 21: Western Europe Market Value (USD Billion) Forecast by Phase Configuration, 2021 to 2036
- Table 22: Western Europe Market Value (USD Billion) Forecast by End Use, 2021 to 2036
- Table 23: Western Europe Market Value (USD Billion) Forecast by Technology, 2021 to 2036
- Table 24: Western Europe Market Value (USD Billion) Forecast by Installation Type, 2021 to 2036
- Table 25: Eastern Europe Market Value (USD Billion) Forecast by Country, 2021 to 2036
- Table 26: Eastern Europe Market Value (USD Billion) Forecast by Product Type, 2021 to 2036
- Table 27: Eastern Europe Market Value (USD Billion) Forecast by Phase Configuration, 2021 to 2036
- Table 28: Eastern Europe Market Value (USD Billion) Forecast by End Use, 2021 to 2036
- Table 29: Eastern Europe Market Value (USD Billion) Forecast by Technology, 2021 to 2036
- Table 30: Eastern Europe Market Value (USD Billion) Forecast by Installation Type, 2021 to 2036
- Table 31: East Asia Market Value (USD Billion) Forecast by Country, 2021 to 2036
- Table 32: East Asia Market Value (USD Billion) Forecast by Product Type, 2021 to 2036
- Table 33: East Asia Market Value (USD Billion) Forecast by Phase Configuration, 2021 to 2036
- Table 34: East Asia Market Value (USD Billion) Forecast by End Use, 2021 to 2036
- Table 35: East Asia Market Value (USD Billion) Forecast by Technology, 2021 to 2036
- Table 36: East Asia Market Value (USD Billion) Forecast by Installation Type, 2021 to 2036
- Table 37: South Asia and Pacific Market Value (USD Billion) Forecast by Country, 2021 to 2036
- Table 38: South Asia and Pacific Market Value (USD Billion) Forecast by Product Type, 2021 to 2036
- Table 39: South Asia and Pacific Market Value (USD Billion) Forecast by Phase Configuration, 2021 to 2036
- Table 40: South Asia and Pacific Market Value (USD Billion) Forecast by End Use, 2021 to 2036
- Table 41: South Asia and Pacific Market Value (USD Billion) Forecast by Technology, 2021 to 2036
- Table 42: South Asia and Pacific Market Value (USD Billion) Forecast by Installation Type, 2021 to 2036
- Table 43: Middle East and Africa Market Value (USD Billion) Forecast by Country, 2021 to 2036
- Table 44: Middle East and Africa Market Value (USD Billion) Forecast by Product Type, 2021 to 2036
- Table 45: Middle East and Africa Market Value (USD Billion) Forecast by Phase Configuration, 2021 to 2036
- Table 46: Middle East and Africa Market Value (USD Billion) Forecast by End Use, 2021 to 2036
- Table 47: Middle East and Africa Market Value (USD Billion) Forecast by Technology, 2021 to 2036
- Table 48: Middle East and Africa Market Value (USD Billion) Forecast by Installation Type, 2021 to 2036
List of Figures
- Figure 1: Global Market Pricing Analysis
- Figure 2: Global Market Value (USD Billion) Forecast 2021-2036
- Figure 3: Global Market Value Share and BPS Analysis by Product Type, 2026 and 2036
- Figure 4: Global Market Y-o-Y Growth Comparison by Product Type, 2026-2036
- Figure 5: Global Market Attractiveness Analysis by Product Type
- Figure 6: Global Market Value Share and BPS Analysis by Phase Configuration, 2026 and 2036
- Figure 7: Global Market Y-o-Y Growth Comparison by Phase Configuration, 2026-2036
- Figure 8: Global Market Attractiveness Analysis by Phase Configuration
- Figure 9: Global Market Value Share and BPS Analysis by End Use, 2026 and 2036
- Figure 10: Global Market Y-o-Y Growth Comparison by End Use, 2026-2036
- Figure 11: Global Market Attractiveness Analysis by End Use
- Figure 12: Global Market Value Share and BPS Analysis by Technology, 2026 and 2036
- Figure 13: Global Market Y-o-Y Growth Comparison by Technology, 2026-2036
- Figure 14: Global Market Attractiveness Analysis by Technology
- Figure 15: Global Market Value Share and BPS Analysis by Installation Type, 2026 and 2036
- Figure 16: Global Market Y-o-Y Growth Comparison by Installation Type, 2026-2036
- Figure 17: Global Market Attractiveness Analysis by Installation Type
- Figure 18: Global Market Value (USD Billion) Share and BPS Analysis by Region, 2026 and 2036
- Figure 19: Global Market Y-o-Y Growth Comparison by Region, 2026-2036
- Figure 20: Global Market Attractiveness Analysis by Region
- Figure 21: North America Market Incremental Dollar Opportunity, 2026-2036
- Figure 22: Latin America Market Incremental Dollar Opportunity, 2026-2036
- Figure 23: Western Europe Market Incremental Dollar Opportunity, 2026-2036
- Figure 24: Eastern Europe Market Incremental Dollar Opportunity, 2026-2036
- Figure 25: East Asia Market Incremental Dollar Opportunity, 2026-2036
- Figure 26: South Asia and Pacific Market Incremental Dollar Opportunity, 2026-2036
- Figure 27: Middle East and Africa Market Incremental Dollar Opportunity, 2026-2036
- Figure 28: North America Market Value Share and BPS Analysis by Country, 2026 and 2036
- Figure 29: North America Market Value Share and BPS Analysis by Product Type, 2026 and 2036
- Figure 30: North America Market Y-o-Y Growth Comparison by Product Type, 2026-2036
- Figure 31: North America Market Attractiveness Analysis by Product Type
- Figure 32: North America Market Value Share and BPS Analysis by Phase Configuration, 2026 and 2036
- Figure 33: North America Market Y-o-Y Growth Comparison by Phase Configuration, 2026-2036
- Figure 34: North America Market Attractiveness Analysis by Phase Configuration
- Figure 35: North America Market Value Share and BPS Analysis by End Use, 2026 and 2036
- Figure 36: North America Market Y-o-Y Growth Comparison by End Use, 2026-2036
- Figure 37: North America Market Attractiveness Analysis by End Use
- Figure 38: North America Market Value Share and BPS Analysis by Technology, 2026 and 2036
- Figure 39: North America Market Y-o-Y Growth Comparison by Technology, 2026-2036
- Figure 40: North America Market Attractiveness Analysis by Technology
- Figure 41: North America Market Value Share and BPS Analysis by Installation Type, 2026 and 2036
- Figure 42: North America Market Y-o-Y Growth Comparison by Installation Type, 2026-2036
- Figure 43: North America Market Attractiveness Analysis by Installation Type
- Figure 44: Latin America Market Value Share and BPS Analysis by Country, 2026 and 2036
- Figure 45: Latin America Market Value Share and BPS Analysis by Product Type, 2026 and 2036
- Figure 46: Latin America Market Y-o-Y Growth Comparison by Product Type, 2026-2036
- Figure 47: Latin America Market Attractiveness Analysis by Product Type
- Figure 48: Latin America Market Value Share and BPS Analysis by Phase Configuration, 2026 and 2036
- Figure 49: Latin America Market Y-o-Y Growth Comparison by Phase Configuration, 2026-2036
- Figure 50: Latin America Market Attractiveness Analysis by Phase Configuration
- Figure 51: Latin America Market Value Share and BPS Analysis by End Use, 2026 and 2036
- Figure 52: Latin America Market Y-o-Y Growth Comparison by End Use, 2026-2036
- Figure 53: Latin America Market Attractiveness Analysis by End Use
- Figure 54: Latin America Market Value Share and BPS Analysis by Technology, 2026 and 2036
- Figure 55: Latin America Market Y-o-Y Growth Comparison by Technology, 2026-2036
- Figure 56: Latin America Market Attractiveness Analysis by Technology
- Figure 57: Latin America Market Value Share and BPS Analysis by Installation Type, 2026 and 2036
- Figure 58: Latin America Market Y-o-Y Growth Comparison by Installation Type, 2026-2036
- Figure 59: Latin America Market Attractiveness Analysis by Installation Type
- Figure 60: Western Europe Market Value Share and BPS Analysis by Country, 2026 and 2036
- Figure 61: Western Europe Market Value Share and BPS Analysis by Product Type, 2026 and 2036
- Figure 62: Western Europe Market Y-o-Y Growth Comparison by Product Type, 2026-2036
- Figure 63: Western Europe Market Attractiveness Analysis by Product Type
- Figure 64: Western Europe Market Value Share and BPS Analysis by Phase Configuration, 2026 and 2036
- Figure 65: Western Europe Market Y-o-Y Growth Comparison by Phase Configuration, 2026-2036
- Figure 66: Western Europe Market Attractiveness Analysis by Phase Configuration
- Figure 67: Western Europe Market Value Share and BPS Analysis by End Use, 2026 and 2036
- Figure 68: Western Europe Market Y-o-Y Growth Comparison by End Use, 2026-2036
- Figure 69: Western Europe Market Attractiveness Analysis by End Use
- Figure 70: Western Europe Market Value Share and BPS Analysis by Technology, 2026 and 2036
- Figure 71: Western Europe Market Y-o-Y Growth Comparison by Technology, 2026-2036
- Figure 72: Western Europe Market Attractiveness Analysis by Technology
- Figure 73: Western Europe Market Value Share and BPS Analysis by Installation Type, 2026 and 2036
- Figure 74: Western Europe Market Y-o-Y Growth Comparison by Installation Type, 2026-2036
- Figure 75: Western Europe Market Attractiveness Analysis by Installation Type
- Figure 76: Eastern Europe Market Value Share and BPS Analysis by Country, 2026 and 2036
- Figure 77: Eastern Europe Market Value Share and BPS Analysis by Product Type, 2026 and 2036
- Figure 78: Eastern Europe Market Y-o-Y Growth Comparison by Product Type, 2026-2036
- Figure 79: Eastern Europe Market Attractiveness Analysis by Product Type
- Figure 80: Eastern Europe Market Value Share and BPS Analysis by Phase Configuration, 2026 and 2036
- Figure 81: Eastern Europe Market Y-o-Y Growth Comparison by Phase Configuration, 2026-2036
- Figure 82: Eastern Europe Market Attractiveness Analysis by Phase Configuration
- Figure 83: Eastern Europe Market Value Share and BPS Analysis by End Use, 2026 and 2036
- Figure 84: Eastern Europe Market Y-o-Y Growth Comparison by End Use, 2026-2036
- Figure 85: Eastern Europe Market Attractiveness Analysis by End Use
- Figure 86: Eastern Europe Market Value Share and BPS Analysis by Technology, 2026 and 2036
- Figure 87: Eastern Europe Market Y-o-Y Growth Comparison by Technology, 2026-2036
- Figure 88: Eastern Europe Market Attractiveness Analysis by Technology
- Figure 89: Eastern Europe Market Value Share and BPS Analysis by Installation Type, 2026 and 2036
- Figure 90: Eastern Europe Market Y-o-Y Growth Comparison by Installation Type, 2026-2036
- Figure 91: Eastern Europe Market Attractiveness Analysis by Installation Type
- Figure 92: East Asia Market Value Share and BPS Analysis by Country, 2026 and 2036
- Figure 93: East Asia Market Value Share and BPS Analysis by Product Type, 2026 and 2036
- Figure 94: East Asia Market Y-o-Y Growth Comparison by Product Type, 2026-2036
- Figure 95: East Asia Market Attractiveness Analysis by Product Type
- Figure 96: East Asia Market Value Share and BPS Analysis by Phase Configuration, 2026 and 2036
- Figure 97: East Asia Market Y-o-Y Growth Comparison by Phase Configuration, 2026-2036
- Figure 98: East Asia Market Attractiveness Analysis by Phase Configuration
- Figure 99: East Asia Market Value Share and BPS Analysis by End Use, 2026 and 2036
- Figure 100: East Asia Market Y-o-Y Growth Comparison by End Use, 2026-2036
- Figure 101: East Asia Market Attractiveness Analysis by End Use
- Figure 102: East Asia Market Value Share and BPS Analysis by Technology, 2026 and 2036
- Figure 103: East Asia Market Y-o-Y Growth Comparison by Technology, 2026-2036
- Figure 104: East Asia Market Attractiveness Analysis by Technology
- Figure 105: East Asia Market Value Share and BPS Analysis by Installation Type, 2026 and 2036
- Figure 106: East Asia Market Y-o-Y Growth Comparison by Installation Type, 2026-2036
- Figure 107: East Asia Market Attractiveness Analysis by Installation Type
- Figure 108: South Asia and Pacific Market Value Share and BPS Analysis by Country, 2026 and 2036
- Figure 109: South Asia and Pacific Market Value Share and BPS Analysis by Product Type, 2026 and 2036
- Figure 110: South Asia and Pacific Market Y-o-Y Growth Comparison by Product Type, 2026-2036
- Figure 111: South Asia and Pacific Market Attractiveness Analysis by Product Type
- Figure 112: South Asia and Pacific Market Value Share and BPS Analysis by Phase Configuration, 2026 and 2036
- Figure 113: South Asia and Pacific Market Y-o-Y Growth Comparison by Phase Configuration, 2026-2036
- Figure 114: South Asia and Pacific Market Attractiveness Analysis by Phase Configuration
- Figure 115: South Asia and Pacific Market Value Share and BPS Analysis by End Use, 2026 and 2036
- Figure 116: South Asia and Pacific Market Y-o-Y Growth Comparison by End Use, 2026-2036
- Figure 117: South Asia and Pacific Market Attractiveness Analysis by End Use
- Figure 118: South Asia and Pacific Market Value Share and BPS Analysis by Technology, 2026 and 2036
- Figure 119: South Asia and Pacific Market Y-o-Y Growth Comparison by Technology, 2026-2036
- Figure 120: South Asia and Pacific Market Attractiveness Analysis by Technology
- Figure 121: South Asia and Pacific Market Value Share and BPS Analysis by Installation Type, 2026 and 2036
- Figure 122: South Asia and Pacific Market Y-o-Y Growth Comparison by Installation Type, 2026-2036
- Figure 123: South Asia and Pacific Market Attractiveness Analysis by Installation Type
- Figure 124: Middle East and Africa Market Value Share and BPS Analysis by Country, 2026 and 2036
- Figure 125: Middle East and Africa Market Value Share and BPS Analysis by Product Type, 2026 and 2036
- Figure 126: Middle East and Africa Market Y-o-Y Growth Comparison by Product Type, 2026-2036
- Figure 127: Middle East and Africa Market Attractiveness Analysis by Product Type
- Figure 128: Middle East and Africa Market Value Share and BPS Analysis by Phase Configuration, 2026 and 2036
- Figure 129: Middle East and Africa Market Y-o-Y Growth Comparison by Phase Configuration, 2026-2036
- Figure 130: Middle East and Africa Market Attractiveness Analysis by Phase Configuration
- Figure 131: Middle East and Africa Market Value Share and BPS Analysis by End Use, 2026 and 2036
- Figure 132: Middle East and Africa Market Y-o-Y Growth Comparison by End Use, 2026-2036
- Figure 133: Middle East and Africa Market Attractiveness Analysis by End Use
- Figure 134: Middle East and Africa Market Value Share and BPS Analysis by Technology, 2026 and 2036
- Figure 135: Middle East and Africa Market Y-o-Y Growth Comparison by Technology, 2026-2036
- Figure 136: Middle East and Africa Market Attractiveness Analysis by Technology
- Figure 137: Middle East and Africa Market Value Share and BPS Analysis by Installation Type, 2026 and 2036
- Figure 138: Middle East and Africa Market Y-o-Y Growth Comparison by Installation Type, 2026-2036
- Figure 139: Middle East and Africa Market Attractiveness Analysis by Installation Type
- Figure 140: Global Market - Tier Structure Analysis
- Figure 141: Global Market - Company Share Analysis
Frequently Asked Questions
How large is the solar microinverter market in 2026?
The market is estimated at USD 5.9 billion in 2026, compared with USD 5.0 billion in 2025.
What market value is forecast for 2036?
The forecast is USD 31.8 billion in 2036 at an 18.3% CAGR from 2026 to 2036.
Which product type category leads in 2026?
The Standalone Microinverters segment is projected to account for 61.4% of product type demand in 2026.
Why does Three Phase lead its category?
The Three Phase segment is projected to account for 54.0% of phase configuration demand in 2026.
Which profiled market has the highest forecast growth?
India has the highest profiled rate at 20.5% CAGR during 2026 to 2036.
Which companies participate in the solar microinverter market?
Enphase Energy Inc.; Hoymiles Power Electronics Inc.; Altenergy Power System; Zhejiang Envertech; AEconversion GmbH.
Preview the report firsthand - request a free sample
Get SampleGet the brochure for pricing and purchase details.
Get PDF
