Sonar Absorbing Rubber Composites Market Size and Share Forecast Outlook 2025 to 2035

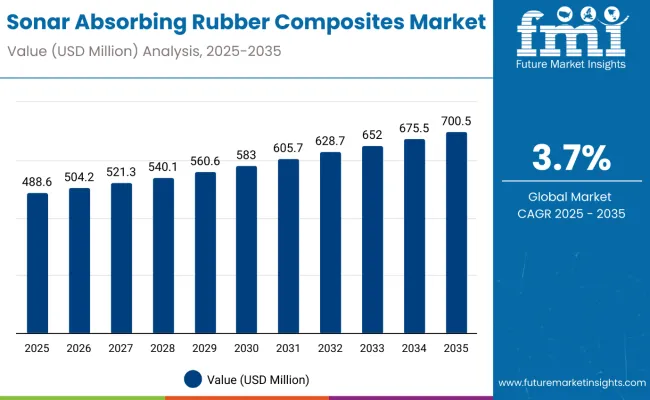
The global sonar absorbing rubber composites market is expected to be valued at USD 488.6 million in 2025 and projected to reach approximately USD 700.5 million by 2035. This represents an absolute value increase of USD 211.9 million, marking a 43.4% expansion over the forecast period. The market is forecast to grow at a compound annual growth rate (CAGR) of 3.7%, with overall size projected to increase by nearly 1.43X between 2025 and 2035.
Quick Stats - Sonar Absorbing Rubber Composites Market

  • Industry Value (2025): USD 488.6 million
  • Forecast Value (2035): USD 700.5 million
  • Forecast CAGR: 3.7%
  • Leading Segment (2025): Submarine Application (58% share)
  • Key Growth Region: China (4.6% CAGR)
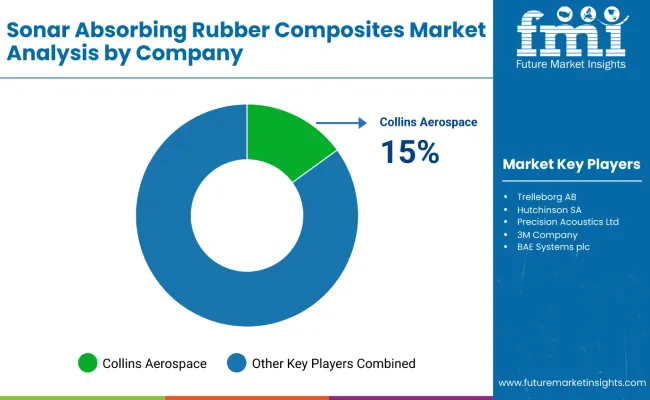
  • Top Key Players: Collins Aerospace, Trelleborg AB, Hutchinson SA, BAE Systems plc, GeoAcoustics Ltd.

Sonar Absorbing Rubber Composites Market

Metric Value
Industry Size (2025E) USD 488.6 million
Industry Size (2035F) USD 700.5 million
CAGR (2025 to 2035) 3.7%

Between 2025 and 2030, the market is projected to rise from USD 488.6 million to USD 583.0 million, contributing approximately USD 94.4 million, or 44.5% of the total ten-year growth. This early phase is likely to be shaped by increased deployment of acoustic signature reduction technologies across naval defense platforms, supported by global maritime security investments and submarine fleet modernization.

During the 2030 to 2035 period, the market is expected to grow from USD 583.0 million to USD 700.5 million, generating the remaining USD 117.5 million in value. Growth in this later phase is anticipated to be driven by advancements in composite formulation, increased integration with autonomous underwater vehicles (AUVs), and broader adoption in dual-use civil-military applications such as offshore infrastructure and undersea surveillance systems.

Between 2020 and 2025, the sonar absorbing rubber composites market expanded, with total industry value rising from USD 422.3 million in 2020 to USD 488.6 million in 2025. This growth trajectory was primarily supported by increased naval modernization programs across major defense economies, particularly in submarine stealth optimization, sonar decoy shielding, and acoustic dampening linings for hull structures.

During this period, rising geopolitical tensions in strategic maritime zones such as the South China Sea, Baltic Sea, and Eastern Mediterranean prompted accelerated investments in undersea warfare capabilities. Countries including the United States, China, India, and Russia increased procurement of sonar-absorbing composites for fleet upgrades and new vessel classes. The shift toward quieter and stealthier naval platforms also fueled demand for elastomeric rubber composites embedded with microbubble or matrix-based sound absorption technologies.

Material suppliers focused on enhancing polymer durability, water resistance, and low-frequency absorption efficiency. Developments in polyurethane rubber blends, reinforced EPDM compounds, and filled silicone elastomers allowed for broader adoption across hull geometries and composite panel architectures.

Analyzing Sonar Absorbing Rubber Composites Market by Top Investment Segments

The market is segmented by frequency absorption into low, medium, and broadband ranges to suit various underwater acoustic needs. Material types include natural rubber, EPDM, silicone rubber, PU rubber, and others, each offering unique damping properties.

Applications span submarines, defense systems, unmanned underwater vehicles, sonar buoy housings, and more, indicating core use in naval stealth operations. Regional analysis covers North America, Latin America, Western and Eastern Europe, East Asia, South Asia and Pacific, and the Middle East and Africa, capturing global demand variations and growth trends.
Low Frequency Absorbing Composites Lead Adoption Due to Strategic Naval Requirements

Sonar Absorbing Rubber Composites Market By Frequency Absorption

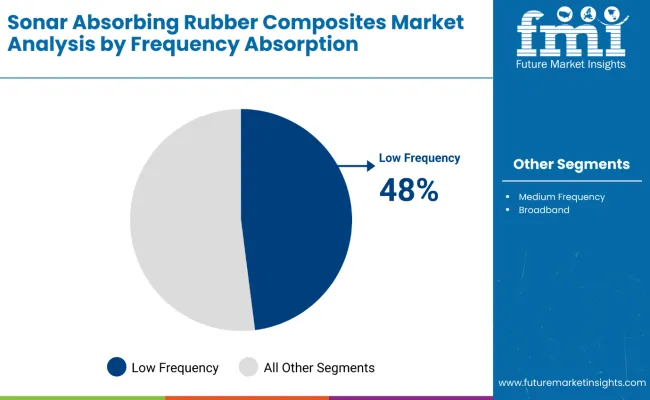
Low frequency absorption composites are projected to hold a 48% share in the frequency absorption segment in 2025, emerging as the dominant category through the forecast period. Their usage is prioritized for stealth applications in submarine and naval vessel design, where low-frequency sonar detection poses significant strategic risks.

These composites effectively dampen longer wavelength sonar signals, reducing acoustic signatures in deep-sea conditions. As navies expand anti-submarine warfare capabilities and stealth infrastructure, material solutions with optimal attenuation at low frequencies are expected to witness continued specification in new designs and retrofits.
Natural Rubber Continues as the Preferred Material in Composite Fabrication

Sonar Absorbing Rubber Composites Market By Material Type

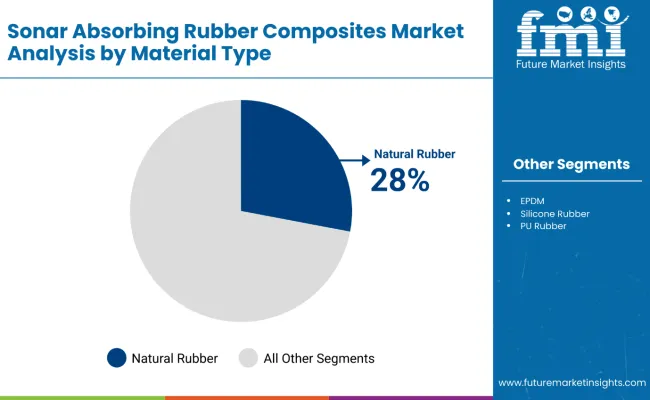
Natural rubber is expected to contribute 28% of the market in the material type segment in 2025. Its continued preference is based on favorable acoustic impedance properties, high flexibility, and cost efficiency. Natural rubber blends well with fillers and additives to produce composites with superior sound absorption at target frequencies, particularly in mid-to-low ranges.

Its ease of processing and compatibility with lamination and molding processes also support widespread deployment in sonar-absorbing panels, tiles, and conformal coatings across naval platforms.
Submarines Remain the Dominant Application Driving Volume Demand

Sonar Absorbing Rubber Composites Market By Application

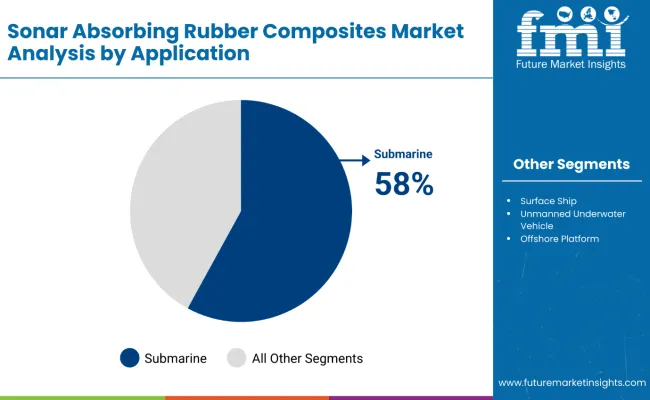
Submarine platforms are projected to account for 58% of the application share in 2025, solidifying their position as the core application area. The adoption of sonar absorbing composites in submarine hulls and sail structures is driven by operational imperatives of minimizing detectability in hostile waters.

The growing global fleet of conventional and nuclear submarines, particularly in Asia-Pacific and NATO countries, continues to fuel demand for tailored rubber composites. Long-term naval procurement cycles and modernization programs are further anchoring submarine-based applications as the primary growth vector for the market.

Why the Sonar Absorbing Rubber Composites Market Is Growing?

The sonar absorbing rubber composites market is witnessing sustained growth due to the confluence of rising underwater stealth requirements, expanded naval procurement budgets, and technological advances in acoustic dampening materials.

Global defense priorities are increasingly emphasizing sonar signature reduction as an essential capability for next-generation submarines, surface vessels, and autonomous underwater systems. This trend is reinforced by evolving naval strategies focused on operating in contested littoral and deep-sea environments where acoustic detectability is a critical limitation.

Geopolitical rivalries in maritime corridors and the proliferation of advanced sonar systems have led to growing investments in passive stealth materials that reduce the acoustic reflectivity of hull structures. National security programs across the United States, China, South Korea, India, and NATO countries are incorporating rubber-based acoustic composites into existing and new fleets to reduce sonar return signatures and increase mission survivability.

Parallel to military drivers, increased offshore infrastructure development-including subsea pipelines, research stations, and ocean monitoring systems-has catalyzed adoption of sonar-absorbing composites for civil marine applications. These systems require materials capable of minimizing acoustic interference and improving the fidelity of underwater signal processing.

Material innovation remains a key enabler of market expansion. Developments in microcellular elastomer design, viscoelastic damping layers, and composite lamination techniques have led to improved acoustic attenuation across a broad frequency range. Moreover, the integration of sonar-absorbing composites with lightweight fiber reinforcements and modular panel structures is enhancing installation efficiency across vessel classes and subsea modules.

What Are the Drivers, Restraints, and Key Trends of the Sonar Absorbing Rubber Composites Market?

The market for sonar absorbing rubber composites is being driven by growing demand for acoustic stealth in naval defense systems, expanded use of autonomous underwater vehicles (AUVs), and increased deployment of subsea communication networks.

However, adoption remains constrained by the high cost of specialized elastomers, complex molding requirements, and the lack of standardization across international procurement programs. Environmental degradation, biofouling, and performance variability in extreme marine conditions present additional challenges to material reliability and lifecycle economics.

Underwater Stealth Demands Push Composite Adoption in Next-Gen Naval Platforms

Navies across North America, Europe, and Asia are investing heavily in sonar-absorbing technologies to minimize vessel detectability and counter the growing sophistication of active sonar systems. Submarine hulls, torpedo casings, and sonar dome enclosures are increasingly lined with rubber composites that attenuate acoustic waves and reduce reflected energy signatures.

Modern combat vessels are required to operate in multi-threat environments, reinforcing the need for passive acoustic cloaking materials that function without emitting counter-signals. The shift toward low-frequency and broadband sonar coverage has further necessitated customized elastomeric formulations with layered absorption profiles.

Material Engineering Advances Improve Frequency Band Performance and Durability

Technological progress in composite rubber design-particularly the incorporation of viscoelastic polymers, microcellular fillers, and fiber-reinforced elastomers-is enabling tailored sound absorption across targeted frequency bands. These engineered materials can now absorb energy from sonar pulses in both low and mid-frequency ranges while maintaining hydrodynamic shape stability.

Surface treatments that resist marine biofouling and microcracking have also improved long-term deployment outcomes. Additionally, multilayered laminate constructions combining rubber with metallic or ceramic barriers are extending the utility of these composites to harsh underwater terrains and fluctuating thermal environments.
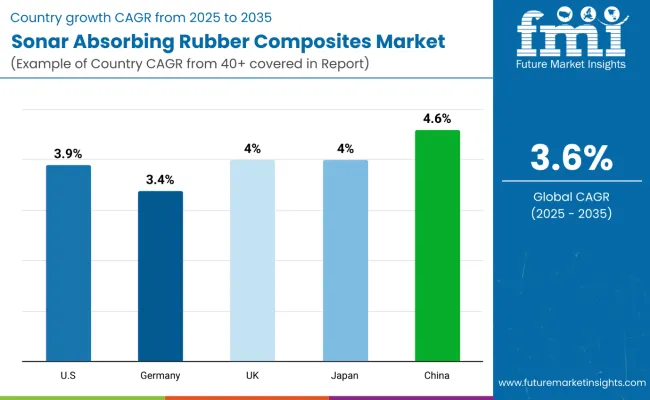
Key Countries: Growth Outlook

Sonar Absorbing Rubber Composites Market Country Wise Analysis

Europe Market Split by Country

Country 2025
Germany 16%
Italy 12%
France 18%
UK 14%
Spain 7%
BENELUX 2%
Russia 15%
Rest of Europe 16%
Country 2035
Germany 17%
Italy 11%
France 19%
UK 13%
Spain 8%
BENELUX 3%
Russia 16%
Rest of Europe 13%

France is projected to remain the largest contributor to Europe's sonar absorbing rubber composites market, growing from 18% in 2025 to 19% in 2035. The country continues to lead due to its extensive naval defense modernization, including upgrades to the Barracuda-class submarines and investments in sonar stealth capabilities.

Germany follows with a steady increase from 16% to 17%, backed by high-value shipbuilding contracts and export-oriented sonar system production. Russia maintains a strong share, growing from 15% to 16%, supported by fleet renewals and domestic composite material sourcing.

Meanwhile, the UK’s share is projected to decline slightly from 14% to 13%, although defense-led demand remains significant. Spain is expected to grow marginally from 7% to 8% due to increased coastal surveillance infrastructure. Italy’s share is forecast to decline from 12% to 11%, while BENELUX is expected to gain a slight uptick from 2% to 3%. Rest of Europe is projected to decrease from 16% to 13%.
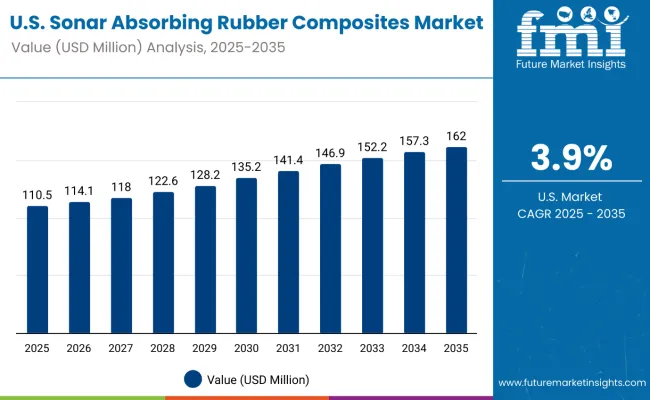
United States: Naval Technology Upgrades Support 3.9% CAGR

United States Sonar Absorbing Rubber Composites Market

The USA market is expected to expand at a CAGR of 3.9%, driven by growing procurement of advanced submarine and naval assets. Ongoing investments in stealth technologies, including sonar attenuation materials for Virginia-class submarines and AUV programs, are driving demand.

  • Strong defense budget allocation for underwater defense programs
  • Usage in oceanographic survey and sonar calibration systems
  • Development of multi-frequency absorbing coatings
  • Rising investments in marine unmanned systems

Germany: Export-Driven Naval Equipment Manufacturing to Register 3.4% CAGR

Germany is projected to grow at a CAGR of 3.4%, supported by naval exports and advanced shipyard capabilities. Rubber composites are increasingly used in hull-mounted sonar domes and propulsion noise dampening.

  • Production of sonar domes for domestic and allied fleets
  • Shipbuilding yards focusing on quiet propulsion technologies
  • Demand from EU-funded maritime security programs
  • Emphasis on high-durability composites with anti-corrosive features

United Kingdom: AUV and Stealth Programs Catalyze 4.0% CAGR

The UK is forecast to grow at a CAGR of 4.0% owing to its long-term naval modernization strategy and expansion of undersea drone fleets. Lightweight rubber composites are being integrated into both defense and civilian subsea systems.

  • Ministry of Defence initiatives supporting stealth acoustics
  • Use in transducer arrays and towed array sonar coatings
  • Integration with low-frequency sonar dampening systems
  • Focus on noise reduction in submarine escape and rescue vessels

Japan: Defense Realignment and Maritime Security Boosting 4.0% CAGR

Japan’s sonar absorbing rubber composites market is expected to post a CAGR of 4.0%, driven by maritime border surveillance and modern submarine fleet expansion. Demand is increasing for rubber composites compatible with layered hull insulation systems.

  • Procurement of new Soryu-class and Taigei-class submarines
  • Collaborations with domestic defense material suppliers
  • High demand for thermally stable, frequency-adaptive coatings
  • Strong naval R&D funding into acoustic counter-detection

China: Rapid Naval Fleet Expansion Driving 4.6% CAGR

China is projected to be the fastest-growing market with a CAGR of 4.6%, led by expansive submarine manufacturing, coastal surveillance deployment, and rising exports of naval systems.

  • High demand from Type-093 and Type-095 class submarine platforms
  • Absorbing rubber sheets used in stealth frigates and unmanned surface vehicles
  • Localized production and self-reliant composite formulations
  • Integration with multifunctional acoustic insulation modules

EPDM-Based Composites Preferred for Maritime Durability in Japan

EPDM rubber is projected to hold a 29% share in Japan's sonar absorbing composite material usage by 2025. Its weather resilience and consistent acoustic performance make it ideal for naval systems exposed to saltwater, pressure variation, and long deployment cycles. Natural rubber (24%) continues to serve in older sonar architectures, while silicone rubber (18%) is favored for electronics shielding in shallow-water or research-grade sonar units. PU rubber (16%) supports localized vibration isolation in sonar panel arrays.

  • EPDM adopted in naval sonar skins and stealth signal dampers
  • Silicone selected for acoustic electronics and transducer covers
  • PU rubber used in hybrid foam layers for structural damping
  • Japanese manufacturers focusing on miniaturized composite layering for ship-based sonar

Defense-Grade Sonar Panels Drive Low-Frequency Absorption Demand in South Korea

South Korea’s composite materials market is led by low-frequency absorption technologies, comprising 42% of the demand. These are tailored for stealth missions, long-range acoustic sensing, and naval intelligence systems on submarines and frigates. Medium frequency absorbers (38%) are common in surface vessel installations and unmanned underwater vehicles (UUVs). Broadband absorption holds a 20% share and is gradually expanding in anti-submarine warfare and ship-mounted array upgrades.
  • Low-frequency composites embedded in hull cladding for sonar invisibility
  • Medium-frequency solutions optimized for mine detection and sonar buoys
  • Broadband materials under prototyping for multi-band naval platforms
  • Local defense contractors prioritizing frequency-specific rubber layering systems

Competition Outlook

Sonar Absorbing Rubber Composites Market By Company

Competition in the sonar-absorbing rubber composites market is being shaped by advancements in materials and acoustic technologies. New coatings and composite solutions are being developed to reduce vessel detection risk and enhance underwater stealth capabilities. Investment in research and development is being prioritized to improve absorption efficiency, durability, and performance under diverse operational conditions.

  • In April 2025, GeoAcoustics Ltd. announced its upcoming launch of advanced sonar technologies and related services at Ocean Business 2025. The company highlighted its continued investment in acoustic innovations, including materials and sonar systems intended for improved underwater sensing and reduced detection risk, aligning with rising demand for enhanced naval surveillance and oceanographic applications.
  • In January 2025, an analysis by Army Recognition detailed Russia’s deployment of a new sonar-absorbing rubber composite coating for its latest submarines. This innovative material was reported to significantly reduce the acoustic signature of vessels, supporting stealth capabilities and lowering the probability of detection by enemy sonar systems.

Companies

  • Collins Aerospace
  • Trelleborg AB
  • Hutchinson SA
  • Precision Acoustics Ltd.
  • 3M Company
  • BAE Systems plc
  • Geo Acoustics Ltd.
  • Elastomer Engineering Ltd.
  • Naval Group
  • Northrop Grumman Corporation

Scope Table

Item Value
Quantitative Units USD 488.6 Million (2025)
Material Type Natural Rubber, EPDM, Silicone Rubber, PU Rubber, Others
Frequency Absorption Low Frequency, Medium Frequency, Broadband
Application Naval Submarines, Surface Ships, Unmanned Underwater Vehicles (UUVs), Offshore Platforms, Research Equipment
Regions Covered North America, Europe, East Asia, South Asia & Pacific, Latin America, Middle East & Africa
Countries Covered United States, Germany, United Kingdom, Japan, China
Key Companies Profiled Trelleborg AB, Meggitt PLC, Furuno Electric Co. Ltd., Thales Group, Ultra Electronics, KENNO Corporation, Cuming Microwave Corporation, CompositeTechs LLC, Hunan Zhongke Shield Technology Co. Ltd., Sonatech Inc.

Key Segments

By Frequency Absorption:

  • Low Frequency
  • Medium Frequency
  • Broadband

By Material Type:

  • Natural Rubber
  • EPDM
  • Silicone Rubber
  • PU Rubber
  • Others

By Application:

  • Submarines
  • Defense Systems
  • Unmanned Underwater Vehicles
  • Sonar Buoys Housing
  • Others

By Region:

  • North America
  • Latin America
  • Western Europe
  • Eastern Europe
  • East Asia
  • South Asia & Pacific
  • Middle East & Africa

Table of Content

  1. Executive Summary
    • Global Market Outlook
    • Demand-side Trends
    • Supply-side Trends
    • Technology Roadmap Analysis
    • Analysis and Recommendations
  2. Market Overview
    • Market Coverage / Taxonomy
    • Market Definition / Scope / Limitations
  3. Market Background
    • Market Dynamics
      • Drivers
      • Restraints
      • Opportunity
      • Trends
    • Scenario Forecast
      • Demand in Optimistic Scenario
      • Demand in Likely Scenario
      • Demand in Conservative Scenario
    • Key Success Factors
    • Industry Developments
    • Supply Chain Analysis
      • Sourcing and Procurement
        • Raw Material / Component Suppliers
        • Technology Providers
      • Product Manufacturers
      • Channel Partners
      • End Users / Customers
    • Market Assessment Factors
      • Macro-economic Factors
      • Forecast Factors
  4. 3.10. Parent Market Outlook
  5. Global Market Analysis 2020 to 2024 and Forecast, 2025 to 2035
    • Historical Market Size Value (USD Million) & Volume (Tons) Analysis, 2020 to 2024
    • Current and Future Market Size Value (USD Million) & Volume (Tons) Projections, 2025 to 2035
      • Y-o-Y Growth Trend Analysis
      • Absolute $ Opportunity Analysis
  6. Global Market Pricing Analysis 2020 to 2024 and Forecast 2025 to 2035
  7. Global Market Analysis 2020 to 2024 and Forecast 2025 to 2035, By Frequency Absorption
    • Introduction / Key Findings
    • Historical Market Size Value (USD Million) & Volume (Tons) Analysis By Frequency Absorption, 2020 to 2024
    • Current and Future Market Size Value (USD Million) & Volume (Tons) Analysis and Forecast By Frequency Absorption, 2025 to 2035
      • Low Frequency
      • Medium Frequency
      • Broadband
    • Y-o-Y Growth Trend Analysis By Frequency Absorption, 2020 to 2024
    • Absolute $ Opportunity Analysis By Frequency Absorption, 2025 to 2035
  8. Global Market Analysis 2020 to 2024 and Forecast 2025 to 2035, By Material Type
    • Introduction / Key Findings
    • Historical Market Size Value (USD Million) & Volume (Tons) Analysis By Material Type, 2020 to 2024
    • Current and Future Market Size Value (USD Million) & Volume (Tons) Analysis and Forecast By Material Type, 2025 to 2035
      • Natural Rubber
      • EPDM
      • Silicone Rubber
      • PU Rubber
      • Others
    • Y-o-Y Growth Trend Analysis By Material Type, 2020 to 2024
    • Absolute $ Opportunity Analysis By Material Type, 2025 to 2035
  9. Global Market Analysis 2020 to 2024 and Forecast 2025 to 2035, By Application
    • Introduction / Key Findings
    • Historical Market Size Value (USD Million) & Volume (Tons) Analysis By Application, 2020 to 2024
    • Current and Future Market Size Value (USD Million) & Volume (Tons) Analysis and Forecast By Application, 2025 to 2035
      • Submarines
      • Defense Systems
      • Unmanned Underwater Vehicles
      • Sonar Buoys Housing
      • Others
    • Y-o-Y Growth Trend Analysis By Application, 2020 to 2024
    • Absolute $ Opportunity Analysis By Application, 2025 to 2035
  10. Global Market Analysis 2020 to 2024 and Forecast 2025 to 2035, By Region
    • Introduction
    • Historical Market Size Value (USD Million) & Volume (Tons) Analysis By Region, 2020 to 2024
    • Current Market Size Value (USD Million) & Volume (Tons) Analysis and Forecast By Region, 2025 to 2035
      • North America
      • Latin America
      • Western Europe
      • Eastern Europe
      • East Asia
      • South Asia & Pacific
      • Middle East & Africa
    • Market Attractiveness Analysis By Region
  11. North America Market Analysis 2020 to 2024 and Forecast 2025 to 2035, By Country
    • Historical Market Size Value (USD Million) & Volume (Tons) Trend Analysis By Market Taxonomy, 2020 to 2024
    • Market Size Value (USD Million) & Volume (Tons) Forecast By Market Taxonomy, 2025 to 2035
      • By Country
        • USA
        • Canada
        • Mexico
      • By Frequency Absorption
      • By Material Type
      • By Application
    • Market Attractiveness Analysis
      • By Country
      • By Frequency Absorption
      • By Material Type
      • By Application
    • Key Takeaways
  12. Latin America Market Analysis 2020 to 2024 and Forecast 2025 to 2035, By Country
    • Historical Market Size Value (USD Million) & Volume (Tons) Trend Analysis By Market Taxonomy, 2020 to 2024
    • Market Size Value (USD Million) & Volume (Tons) Forecast By Market Taxonomy, 2025 to 2035
      • By Country
        • Brazil
        • Argentina
        • Rest of Latin America
      • By Frequency Absorption
      • By Material Type
      • By Application
    • Market Attractiveness Analysis
      • By Country
      • By Frequency Absorption
      • By Material Type
      • By Application
    • Key Takeaways
  13. Western Europe Market Analysis 2020 to 2024 and Forecast 2025 to 2035, By Country
    • Historical Market Size Value (USD Million) & Volume (Tons) Trend Analysis By Market Taxonomy, 2020 to 2024
    • Market Size Value (USD Million) & Volume (Tons) Forecast By Market Taxonomy, 2025 to 2035
      • By Country
        • Germany
        • Italy
        • France
        • UK
        • Spain
        • BENELUX
        • Nordics
        • Rest of W. Europe
      • By Frequency Absorption
      • By Material Type
      • By Application
    • Market Attractiveness Analysis
      • By Country
      • By Frequency Absorption
      • By Material Type
      • By Application
    • Key Takeaways
  14. Eastern Europe Market Analysis 2020 to 2024 and Forecast 2025 to 2035, By Country
    • Historical Market Size Value (USD Million) & Volume (Tons) Trend Analysis By Market Taxonomy, 2020 to 2024
    • Market Size Value (USD Million) & Volume (Tons) Forecast By Market Taxonomy, 2025 to 2035
      • By Country
        • Hungary
        • Poland
        • Russia
        • Balkan & Baltics
        • Rest of E.Europe
      • By Frequency Absorption
      • By Material Type
      • By Application
    • Market Attractiveness Analysis
      • By Country
      • By Frequency Absorption
      • By Material Type
      • By Application
    • Key Takeaways
  15. East Asia Market Analysis 2020 to 2024 and Forecast 2025 to 2035, By Country
    • Historical Market Size Value (USD Million) & Volume (Tons) Trend Analysis By Market Taxonomy, 2020 to 2024
    • Market Size Value (USD Million) & Volume (Tons) Forecast By Market Taxonomy, 2025 to 2035
      • By Country
        • China
        • Japan
        • South Korea
      • By Frequency Absorption
      • By Material Type
      • By Application
    • Market Attractiveness Analysis
      • By Country
      • By Frequency Absorption
      • By Material Type
      • By Application
    • Key Takeaways
  16. South Asia & Pacific Market Analysis 2020 to 2024 and Forecast 2025 to 2035, By Country
    • Historical Market Size Value (USD Million) & Volume (Tons) Trend Analysis By Market Taxonomy, 2020 to 2024
    • Market Size Value (USD Million) & Volume (Tons) Forecast By Market Taxonomy, 2025 to 2035
      • By Country
        • India
        • ASEAN
        • Australia & New Zealand
      • By Frequency Absorption
      • By Material Type
      • By Application
    • Market Attractiveness Analysis
      • By Country
      • By Frequency Absorption
      • By Material Type
      • By Application
    • Key Takeaways
  17. Middle East & Africa Market Analysis 2020 to 2024 and Forecast 2025 to 2035, By Country
    • Historical Market Size Value (USD Million) & Volume (Tons) Trend Analysis By Market Taxonomy, 2020 to 2024
    • Market Size Value (USD Million) & Volume (Tons) Forecast By Market Taxonomy, 2025 to 2035
      • By Country
        • GCC Countries
        • Turkiye
        • Northern Africa
        • South Africa
        • Rest of MEA
      • By Frequency Absorption
      • By Material Type
      • By Application
    • Market Attractiveness Analysis
      • By Country
      • By Frequency Absorption
      • By Material Type
      • By Application
    • Key Takeaways
  18. Key Countries Market Analysis
    • USA
      • Pricing Analysis
      • Market Share Analysis, 2024
        • By Frequency Absorption
        • By Material Type
        • By Application
    • Canada
      • Pricing Analysis
      • Market Share Analysis, 2024
        • By Frequency Absorption
        • By Material Type
        • By Application
    • Mexico
      • Pricing Analysis
      • Market Share Analysis, 2024
        • By Frequency Absorption
        • By Material Type
        • By Application
    • Brazil
      • Pricing Analysis
      • Market Share Analysis, 2024
        • By Frequency Absorption
        • By Material Type
        • By Application
    • Argentina
      • Pricing Analysis
      • Market Share Analysis, 2024
        • By Frequency Absorption
        • By Material Type
        • By Application
    • Germany
      • Pricing Analysis
      • Market Share Analysis, 2024
        • By Frequency Absorption
        • By Material Type
        • By Application
    • Italy
      • Pricing Analysis
      • Market Share Analysis, 2024
        • By Frequency Absorption
        • By Material Type
        • By Application
    • France
      • Pricing Analysis
      • Market Share Analysis, 2024
        • By Frequency Absorption
        • By Material Type
        • By Application
    • UK
      • Pricing Analysis
      • Market Share Analysis, 2024
        • By Frequency Absorption
        • By Material Type
        • By Application
    • Spain
      • Pricing Analysis
      • Market Share Analysis, 2024
        • By Frequency Absorption
        • By Material Type
        • By Application
    • BENELUX
      • Pricing Analysis
      • Market Share Analysis, 2024
        • By Frequency Absorption
        • By Material Type
        • By Application
    • Nordics
      • Pricing Analysis
      • Market Share Analysis, 2024
        • By Frequency Absorption
        • By Material Type
        • By Application
    • Russia
      • Pricing Analysis
      • Market Share Analysis, 2024
        • By Frequency Absorption
        • By Material Type
        • By Application
    • Hungary
      • Pricing Analysis
      • Market Share Analysis, 2024
        • By Frequency Absorption
        • By Material Type
        • By Application
    • Poland
      • Pricing Analysis
      • Market Share Analysis, 2024
        • By Frequency Absorption
        • By Material Type
        • By Application
    • Balkan & Baltics
      • Pricing Analysis
      • Market Share Analysis, 2024
        • By Frequency Absorption
        • By Material Type
        • By Application
    • China
      • Pricing Analysis
      • Market Share Analysis, 2024
        • By Frequency Absorption
        • By Material Type
        • By Application
    • Japan
      • Pricing Analysis
      • Market Share Analysis, 2024
        • By Frequency Absorption
        • By Material Type
        • By Application
    • South Korea
      • Pricing Analysis
      • Market Share Analysis, 2024
        • By Frequency Absorption
        • By Material Type
        • By Application
    • India
      • Pricing Analysis
      • Market Share Analysis, 2024
        • By Frequency Absorption
        • By Material Type
        • By Application
    • ASEAN
      • Pricing Analysis
      • Market Share Analysis, 2024
        • By Frequency Absorption
        • By Material Type
        • By Application
    • Australia & New Zealand
      • Pricing Analysis
      • Market Share Analysis, 2024
        • By Frequency Absorption
        • By Material Type
        • By Application
    • GCC Countries
      • Pricing Analysis
      • Market Share Analysis, 2024
        • By Frequency Absorption
        • By Material Type
        • By Application
    • Turkiye
      • Pricing Analysis
      • Market Share Analysis, 2024
        • By Frequency Absorption
        • By Material Type
        • By Application
    • Northern Africa
      • Pricing Analysis
      • Market Share Analysis, 2024
        • By Frequency Absorption
        • By Material Type
        • By Application
    • South Africa
      • Pricing Analysis
      • Market Share Analysis, 2024
        • By Frequency Absorption
        • By Material Type
        • By Application
  19. Market Structure Analysis
    • Competition Dashboard
    • Competition Benchmarking
    • Market Share Analysis of Top Players
      • By Regional
      • By Frequency Absorption
      • By Material Type
      • By Application
  20. Competition Analysis
    • Competition Deep Dive
      • Collins Aerospace
        • Overview
        • Product Portfolio
        • Profitability by Market Segments
        • Sales Footprint
        • Strategy Overview
      • Trelleborg AB
        • Overview
        • Product Portfolio
        • Profitability by Market Segments
        • Sales Footprint
        • Strategy Overview
      • Hutchinson SA
        • Overview
        • Product Portfolio
        • Profitability by Market Segments
        • Sales Footprint
        • Strategy Overview
      • Precision Acoustics Ltd.
        • Overview
        • Product Portfolio
        • Profitability by Market Segments
        • Sales Footprint
        • Strategy Overview
      • 3M Company
        • Overview
        • Product Portfolio
        • Profitability by Market Segments
        • Sales Footprint
        • Strategy Overview
      • BAE Systems plc
        • Overview
        • Product Portfolio
        • Profitability by Market Segments
        • Sales Footprint
        • Strategy Overview
      • Geo Acoustics Ltd.
        • Overview
        • Product Portfolio
        • Profitability by Market Segments
        • Sales Footprint
        • Strategy Overview
      • Elastomer Engineering Ltd.
        • Overview
        • Product Portfolio
        • Profitability by Market Segments
        • Sales Footprint
        • Strategy Overview
      • Naval Group
        • Overview
        • Product Portfolio
        • Profitability by Market Segments
        • Sales Footprint
        • Strategy Overview
      • Northrop Grumman Corporation
        • Overview
        • Product Portfolio
        • Profitability by Market Segments
        • Sales Footprint
        • Strategy Overview
  21. Assumptions & Acronyms Used
  22. Research Methodology

List of Tables

  • Table 1: Global Market Value (USD Million) Forecast by Region, 2020-2035
  • Table 2: Global Market Volume (Tons) Forecast by Region, 2020-2035
  • Table 3: Global Market Value (USD Million) Forecast by Frequency Absorption, 2020-2035
  • Table 4: Global Market Volume (Tons) Forecast by Frequency Absorption, 2020-2035
  • Table 5: Global Market Value (USD Million) Forecast by Material Type, 2020-2035
  • Table 6: Global Market Volume (Tons) Forecast by Material Type, 2020-2035
  • Table 7: Global Market Value (USD Million) Forecast by Application, 2020-2035
  • Table 8: Global Market Volume (Tons) Forecast by Application, 2020-2035
  • Table 9: North America Market Value (USD Million) Forecast by Country, 2020-2035
  • Table 10: North America Market Volume (Tons) Forecast by Country, 2020-2035
  • Table 11: North America Market Value (USD Million) Forecast by Frequency Absorption, 2020-2035
  • Table 12: North America Market Volume (Tons) Forecast by Frequency Absorption, 2020-2035
  • Table 13: North America Market Value (USD Million) Forecast by Material Type, 2020-2035
  • Table 14: North America Market Volume (Tons) Forecast by Material Type, 2020-2035
  • Table 15: North America Market Value (USD Million) Forecast by Application, 2020-2035
  • Table 16: North America Market Volume (Tons) Forecast by Application, 2020-2035
  • Table 17: Latin America Market Value (USD Million) Forecast by Country, 2020-2035
  • Table 18: Latin America Market Volume (Tons) Forecast by Country, 2020-2035
  • Table 19: Latin America Market Value (USD Million) Forecast by Frequency Absorption, 2020-2035
  • Table 20: Latin America Market Volume (Tons) Forecast by Frequency Absorption, 2020-2035
  • Table 21: Latin America Market Value (USD Million) Forecast by Material Type, 2020-2035
  • Table 22: Latin America Market Volume (Tons) Forecast by Material Type, 2020-2035
  • Table 23: Latin America Market Value (USD Million) Forecast by Application, 2020-2035
  • Table 24: Latin America Market Volume (Tons) Forecast by Application, 2020-2035
  • Table 25: Western Europe Market Value (USD Million) Forecast by Country, 2020-2035
  • Table 26: Western Europe Market Volume (Tons) Forecast by Country, 2020-2035
  • Table 27: Western Europe Market Value (USD Million) Forecast by Frequency Absorption, 2020-2035
  • Table 28: Western Europe Market Volume (Tons) Forecast by Frequency Absorption, 2020-2035
  • Table 29: Western Europe Market Value (USD Million) Forecast by Material Type, 2020-2035
  • Table 30: Western Europe Market Volume (Tons) Forecast by Material Type, 2020-2035
  • Table 31: Western Europe Market Value (USD Million) Forecast by Application, 2020-2035
  • Table 32: Western Europe Market Volume (Tons) Forecast by Application, 2020-2035
  • Table 33: Eastern Europe Market Value (USD Million) Forecast by Country, 2020-2035
  • Table 34: Eastern Europe Market Volume (Tons) Forecast by Country, 2020-2035
  • Table 35: Eastern Europe Market Value (USD Million) Forecast by Frequency Absorption, 2020-2035
  • Table 36: Eastern Europe Market Volume (Tons) Forecast by Frequency Absorption, 2020-2035
  • Table 37: Eastern Europe Market Value (USD Million) Forecast by Material Type, 2020-2035
  • Table 38: Eastern Europe Market Volume (Tons) Forecast by Material Type, 2020-2035
  • Table 39: Eastern Europe Market Value (USD Million) Forecast by Application, 2020-2035
  • Table 40: Eastern Europe Market Volume (Tons) Forecast by Application, 2020-2035
  • Table 41: East Asia Market Value (USD Million) Forecast by Country, 2020-2035
  • Table 42: East Asia Market Volume (Tons) Forecast by Country, 2020-2035
  • Table 43: East Asia Market Value (USD Million) Forecast by Frequency Absorption, 2020-2035
  • Table 44: East Asia Market Volume (Tons) Forecast by Frequency Absorption, 2020-2035
  • Table 45: East Asia Market Value (USD Million) Forecast by Material Type, 2020-2035
  • Table 46: East Asia Market Volume (Tons) Forecast by Material Type, 2020-2035
  • Table 47: East Asia Market Value (USD Million) Forecast by Application, 2020-2035
  • Table 48: East Asia Market Volume (Tons) Forecast by Application, 2020-2035
  • Table 49: South Asia & Pacific Market Value (USD Million) Forecast by Country, 2020-2035
  • Table 50: South Asia & Pacific Market Volume (Tons) Forecast by Country, 2020-2035
  • Table 51: South Asia & Pacific Market Value (USD Million) Forecast by Frequency Absorption, 2020-2035
  • Table 52: South Asia & Pacific Market Volume (Tons) Forecast by Frequency Absorption, 2020-2035
  • Table 53: South Asia & Pacific Market Value (USD Million) Forecast by Material Type, 2020-2035
  • Table 54: South Asia & Pacific Market Volume (Tons) Forecast by Material Type, 2020-2035
  • Table 55: South Asia & Pacific Market Value (USD Million) Forecast by Application, 2020-2035
  • Table 56: South Asia & Pacific Market Volume (Tons) Forecast by Application, 2020-2035
  • Table 57: Middle East & Africa Market Value (USD Million) Forecast by Country, 2020-2035
  • Table 58: Middle East & Africa Market Volume (Tons) Forecast by Country, 2020-2035
  • Table 59: Middle East & Africa Market Value (USD Million) Forecast by Frequency Absorption, 2020-2035
  • Table 60: Middle East & Africa Market Volume (Tons) Forecast by Frequency Absorption, 2020-2035
  • Table 61: Middle East & Africa Market Value (USD Million) Forecast by Material Type, 2020-2035
  • Table 62: Middle East & Africa Market Volume (Tons) Forecast by Material Type, 2020-2035
  • Table 63: Middle East & Africa Market Value (USD Million) Forecast by Application, 2020-2035
  • Table 64: Middle East & Africa Market Volume (Tons) Forecast by Application, 2020-2035

List of Figures

  • Figure 1: Global Market Volume (Tons) Forecast 2020-2035
  • Figure 2: Global Market Pricing Analysis
  • Figure 3: Global Market Value (USD Million) Forecast 2020-2035
  • Figure 4: Global Market Value Share and BPS Analysis by Frequency Absorption, 2025 and 2035
  • Figure 5: Global Market Y-o-Y Growth Comparison by Frequency Absorption, 2025-2035
  • Figure 6: Global Market Attractiveness Analysis by Frequency Absorption
  • Figure 7: Global Market Value Share and BPS Analysis by Material Type, 2025 and 2035
  • Figure 8: Global Market Y-o-Y Growth Comparison by Material Type, 2025-2035
  • Figure 9: Global Market Attractiveness Analysis by Material Type
  • Figure 10: Global Market Value Share and BPS Analysis by Application, 2025 and 2035
  • Figure 11: Global Market Y-o-Y Growth Comparison by Application, 2025-2035
  • Figure 12: Global Market Attractiveness Analysis by Application
  • Figure 13: Global Market Value (USD Million) Share and BPS Analysis by Region, 2025 and 2035
  • Figure 14: Global Market Y-o-Y Growth Comparison by Region, 2025-2035
  • Figure 15: Global Market Attractiveness Analysis by Region
  • Figure 16: North America Market Incremental $ Opportunity, 2025-2035
  • Figure 17: Latin America Market Incremental $ Opportunity, 2025-2035
  • Figure 18: Western Europe Market Incremental $ Opportunity, 2025-2035
  • Figure 19: Eastern Europe Market Incremental $ Opportunity, 2025-2035
  • Figure 20: East Asia Market Incremental $ Opportunity, 2025-2035
  • Figure 21: South Asia & Pacific Market Incremental $ Opportunity, 2025-2035
  • Figure 22: Middle East & Africa Market Incremental $ Opportunity, 2025-2035
  • Figure 23: North America Market Value Share and BPS Analysis by Country, 2025 and 2035
  • Figure 24: North America Market Value Share and BPS Analysis by Frequency Absorption, 2025 and 2035
  • Figure 25: North America Market Y-o-Y Growth Comparison by Frequency Absorption, 2025-2035
  • Figure 26: North America Market Attractiveness Analysis by Frequency Absorption
  • Figure 27: North America Market Value Share and BPS Analysis by Material Type, 2025 and 2035
  • Figure 28: North America Market Y-o-Y Growth Comparison by Material Type, 2025-2035
  • Figure 29: North America Market Attractiveness Analysis by Material Type
  • Figure 30: North America Market Value Share and BPS Analysis by Application, 2025 and 2035
  • Figure 31: North America Market Y-o-Y Growth Comparison by Application, 2025-2035
  • Figure 32: North America Market Attractiveness Analysis by Application
  • Figure 33: Latin America Market Value Share and BPS Analysis by Country, 2025 and 2035
  • Figure 34: Latin America Market Value Share and BPS Analysis by Frequency Absorption, 2025 and 2035
  • Figure 35: Latin America Market Y-o-Y Growth Comparison by Frequency Absorption, 2025-2035
  • Figure 36: Latin America Market Attractiveness Analysis by Frequency Absorption
  • Figure 37: Latin America Market Value Share and BPS Analysis by Material Type, 2025 and 2035
  • Figure 38: Latin America Market Y-o-Y Growth Comparison by Material Type, 2025-2035
  • Figure 39: Latin America Market Attractiveness Analysis by Material Type
  • Figure 40: Latin America Market Value Share and BPS Analysis by Application, 2025 and 2035
  • Figure 41: Latin America Market Y-o-Y Growth Comparison by Application, 2025-2035
  • Figure 42: Latin America Market Attractiveness Analysis by Application
  • Figure 43: Western Europe Market Value Share and BPS Analysis by Country, 2025 and 2035
  • Figure 44: Western Europe Market Value Share and BPS Analysis by Frequency Absorption, 2025 and 2035
  • Figure 45: Western Europe Market Y-o-Y Growth Comparison by Frequency Absorption, 2025-2035
  • Figure 46: Western Europe Market Attractiveness Analysis by Frequency Absorption
  • Figure 47: Western Europe Market Value Share and BPS Analysis by Material Type, 2025 and 2035
  • Figure 48: Western Europe Market Y-o-Y Growth Comparison by Material Type, 2025-2035
  • Figure 49: Western Europe Market Attractiveness Analysis by Material Type
  • Figure 50: Western Europe Market Value Share and BPS Analysis by Application, 2025 and 2035
  • Figure 51: Western Europe Market Y-o-Y Growth Comparison by Application, 2025-2035
  • Figure 52: Western Europe Market Attractiveness Analysis by Application
  • Figure 53: Eastern Europe Market Value Share and BPS Analysis by Country, 2025 and 2035
  • Figure 54: Eastern Europe Market Value Share and BPS Analysis by Frequency Absorption, 2025 and 2035
  • Figure 55: Eastern Europe Market Y-o-Y Growth Comparison by Frequency Absorption, 2025-2035
  • Figure 56: Eastern Europe Market Attractiveness Analysis by Frequency Absorption
  • Figure 57: Eastern Europe Market Value Share and BPS Analysis by Material Type, 2025 and 2035
  • Figure 58: Eastern Europe Market Y-o-Y Growth Comparison by Material Type, 2025-2035
  • Figure 59: Eastern Europe Market Attractiveness Analysis by Material Type
  • Figure 60: Eastern Europe Market Value Share and BPS Analysis by Application, 2025 and 2035
  • Figure 61: Eastern Europe Market Y-o-Y Growth Comparison by Application, 2025-2035
  • Figure 62: Eastern Europe Market Attractiveness Analysis by Application
  • Figure 63: East Asia Market Value Share and BPS Analysis by Country, 2025 and 2035
  • Figure 64: East Asia Market Value Share and BPS Analysis by Frequency Absorption, 2025 and 2035
  • Figure 65: East Asia Market Y-o-Y Growth Comparison by Frequency Absorption, 2025-2035
  • Figure 66: East Asia Market Attractiveness Analysis by Frequency Absorption
  • Figure 67: East Asia Market Value Share and BPS Analysis by Material Type, 2025 and 2035
  • Figure 68: East Asia Market Y-o-Y Growth Comparison by Material Type, 2025-2035
  • Figure 69: East Asia Market Attractiveness Analysis by Material Type
  • Figure 70: East Asia Market Value Share and BPS Analysis by Application, 2025 and 2035
  • Figure 71: East Asia Market Y-o-Y Growth Comparison by Application, 2025-2035
  • Figure 72: East Asia Market Attractiveness Analysis by Application
  • Figure 73: South Asia & Pacific Market Value Share and BPS Analysis by Country, 2025 and 2035
  • Figure 74: South Asia & Pacific Market Value Share and BPS Analysis by Frequency Absorption, 2025 and 2035
  • Figure 75: South Asia & Pacific Market Y-o-Y Growth Comparison by Frequency Absorption, 2025-2035
  • Figure 76: South Asia & Pacific Market Attractiveness Analysis by Frequency Absorption
  • Figure 77: South Asia & Pacific Market Value Share and BPS Analysis by Material Type, 2025 and 2035
  • Figure 78: South Asia & Pacific Market Y-o-Y Growth Comparison by Material Type, 2025-2035
  • Figure 79: South Asia & Pacific Market Attractiveness Analysis by Material Type
  • Figure 80: South Asia & Pacific Market Value Share and BPS Analysis by Application, 2025 and 2035
  • Figure 81: South Asia & Pacific Market Y-o-Y Growth Comparison by Application, 2025-2035
  • Figure 82: South Asia & Pacific Market Attractiveness Analysis by Application
  • Figure 83: Middle East & Africa Market Value Share and BPS Analysis by Country, 2025 and 2035
  • Figure 84: Middle East & Africa Market Value Share and BPS Analysis by Frequency Absorption, 2025 and 2035
  • Figure 85: Middle East & Africa Market Y-o-Y Growth Comparison by Frequency Absorption, 2025-2035
  • Figure 86: Middle East & Africa Market Attractiveness Analysis by Frequency Absorption
  • Figure 87: Middle East & Africa Market Value Share and BPS Analysis by Material Type, 2025 and 2035
  • Figure 88: Middle East & Africa Market Y-o-Y Growth Comparison by Material Type, 2025-2035
  • Figure 89: Middle East & Africa Market Attractiveness Analysis by Material Type
  • Figure 90: Middle East & Africa Market Value Share and BPS Analysis by Application, 2025 and 2035
  • Figure 91: Middle East & Africa Market Y-o-Y Growth Comparison by Application, 2025-2035
  • Figure 92: Middle East & Africa Market Attractiveness Analysis by Application
  • Figure 93: Global Market - Tier Structure Analysis
  • Figure 94: Global Market - Company Share Analysis

Frequently Asked Questions

What is the current valuation of the sonar absorbing rubber composites market?

As of 2025, the global market is projected to be valued at USD 488.6 million.

Which frequency band holds the largest share in the market?

Low frequency absorption dominates, especially in submarine and stealth applications, accounting for over 40% of global demand.

Which material type is gaining traction for high-performance sonar panels?

EPDM and silicone rubber are increasingly preferred for their stability, resistance to marine environments, and superior acoustic insulation properties.

Which country is expected to show the fastest growth?

China is forecast to expand at a CAGR of 4.6% between 2025 and 2035, driven by increasing naval modernization and domestic composite manufacturing capabilities.

What are the key growth drivers for this market?

Growth is fueled by rising military sonar deployments, demand for underwater stealth technology, advancements in acoustic stealth materials, and expanding research-grade underwater robotics.

Who are the leading companies in this market?

Major players include Trelleborg AB, Ultra Electronics, Sonatech Inc., and Thales Group, all of which provide specialized sonar and acoustic materials for naval and scientific applications.

Explore Similar Insights

Future Market Insights

Sonar Absorbing Rubber Composites Market