
- Market Size (2026)
- USD 2111.2 Mn
- Forecast (2036)
- USD 3374.0 Mn
- CAGR (2026 to 2036)
- 4.8%
How big is the Sorbitol Market in 2026?
The Sorbitol Market is projected to reach USD 3,374.0 million by 2036, growing at a 4.8% CAGR from 2026 to 2036. FMI estimates the market at USD 2,111.2 million in 2026, after it was valued at USD 2,030.0 million in 2025. Demand comes from food processing, dental hygiene, cosmetics and pharmaceutical users. The WHO advises keeping free sugars below 10.0% of total energy intake. Value moves with corn costs. The FAO reported maize prices up 5.6% in September 2026, their highest level in more than three years.
Customs data show two price tiers in sorbitol trade. China shipped 223,609 tonnes of D-glucitol in 2024 at an average USD 755 per tonne. France shipped 87,173 tonnes at an average USD 1,526 per tonne. That is about twice the Chinese price. India exported USD 61.0 million of D-glucitol against imports of USD 10.0 million. Vietnam decided on 3 September 2026 not to extend its anti-dumping measures on sorbitol from China, India and Indonesia.
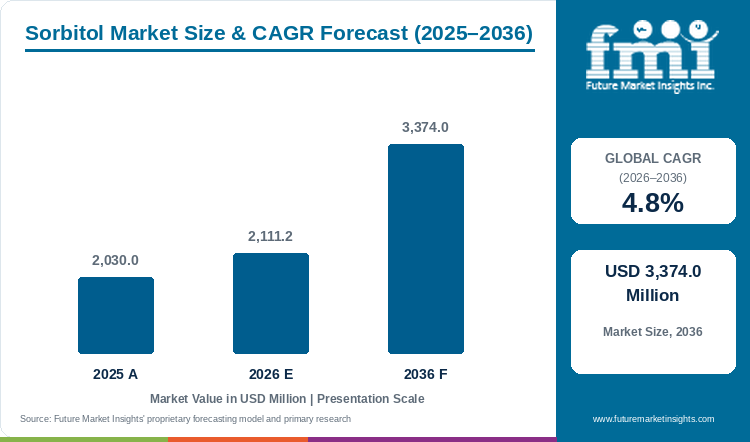
Key Market Trends & Insights
- Feedstock cost is rising, with the FAO cereal price index at 122.8 points in September 2026, up 17.2% in a year. Global maize prices rose 5.6% in the month to their highest level in more than three years.
- Mature markets import part of supply: Japan took 37,186 tonnes in 2024 and the United States 19,747 tonnes.
- Sugar reduction is spreading across product groups, and Ingredion says its sugar reduction business sells stevia, polyols, dextrose, allulose and fructooligosaccharides. Polyols such as sorbitol, covered in the polyols market, compete with high-intensity sweeteners and with other bulk sugar replacers.
Regional Highlights
- Asia Pacific trade is largely intra-regional: Asian origins supplied 94% of Japanese D-glucitol import volume in 2024.
- European trade stays largely inside the Union: Germany sources 78% of its D-glucitol from EU suppliers.
Sorbitol Market Size and Forecast
Table 1: Sorbitol Market Size and Forecast
| Market size and forecast | Value |
|---|---|
| Market size in 2025 | USD 2,030.0 million |
| Estimated market size in 2026 | USD 2,111.2 million |
| Projected market size by 2036 | USD 3,374.0 million |
| CAGR from 2026 to 2036 | 4.8% |
Source: Future Market Insights analysis of the sorbitol market, 2026.
Analyst Perspective
“Confectioners, oral care makers and drug manufacturers buy sorbitol against purity specifications and a corn-linked price formula, and they hold a second source for pharmaceutical grades. Suppliers integrated with corn processing can quote steadier prices and secure long contracts, while corn price spikes and Chinese oversupply are the main commercial risks, because one raises cost and the other lowers selling prices. Growth rests on sugar-free product launches and on pharmaceutical and oral care demand that is less tied to food cycles.”
- Nandini Roy Choudhury, Principal Analyst at Future Market Insights
How is the Sorbitol Market segmented?
- By application: Food and Beverage, Personal Care and Oral Care, Pharmaceuticals, Industrial and Vitamin C Intermediates.
- By source: Corn, Wheat, Cassava and tapioca, Other starches.
- By form: Liquid, Powder and crystalline.
- By functionality: Humectant and thickening agent, Sweetening and bulking agent, Taste masking and other functions.
- By region: North America, Latin America, Europe, East Asia, South Asia, Oceania, Middle East and Africa.
Why does Food and Beverage lead by Application in the Sorbitol Market in 2026?
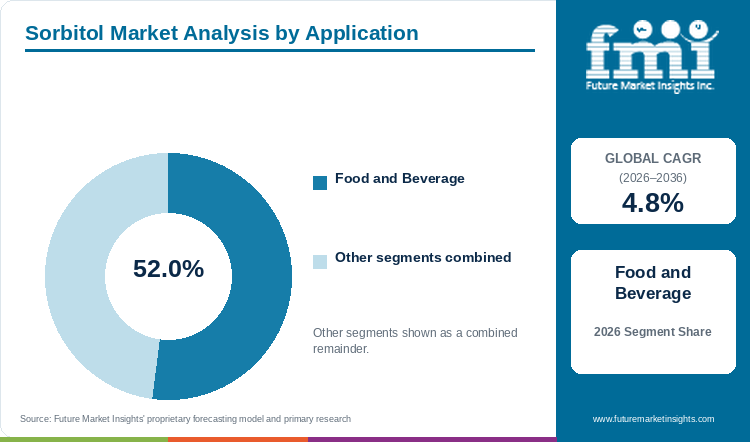
Food and Beverage holds 52.0% of the Sorbitol Market by application in 2026.
Federal rules list humectant, thickener and texturiser among the food functions of sorbitol, alongside nutritive sweetener. Good manufacturing practice maximums are 99% in hard candy, 75% in chewing gum and 12% in most other foods. Personal care and oral care, pharmaceuticals and industrial uses together hold the remaining 48.0%. Tereos says sorbitol is used in food processing, hygiene products including dental products, cosmetics and automotive industries. It also offers liquid and powder polyols as excipients for oral dosage forms.
Table 2: Application, 2026 Share
| Leading Share | 2026 market share |
|---|---|
| Food and Beverage | 52.0% |
| All Other Segments Combined Share | 48.0% |
Source: Future Market Insights analysis of the sorbitol market, 2026.
Why does Corn lead by Source in the Sorbitol Market in 2026?
Corn holds 72.0% of the Sorbitol Market by source in 2026.
Corn is the feedstock of the wet-milling chains that supply glucose to sorbitol plants. China's corn deep processing used about 85 million tonnes in 2024, and starch sugar output exceeded 20 million tonnes. Ingredion and ADM both convert corn into sweeteners and starches. Wheat, cassava and other starches together hold the remaining 28.0%. The FAO reports the highest maize prices in more than three years, which raises the cost of the corn route.
Table 3: Source, 2026 Share
| Leading Share | 2026 market share |
|---|---|
| Corn | 72.0% |
| All Other Segments Combined Share | 28.0% |
Source: Future Market Insights analysis of the sorbitol market, 2026.
Why does Liquid lead by Form in the Sorbitol Market in 2026?
Liquid sorbitol holds 72.0% of the Sorbitol Market by form in 2026.
Liquid leads because a 70% solution is both a pharmacopoeia grade and a listed producer product. The European Pharmacopoeia defines the non-crystallising 70% solution at 68.0 to 72.0% anhydrous substance. Gulshan Polyols lists a 70% solution among its starch sugar products. Powder and crystalline grades hold the remaining 28.0% of the Sorbitol Market by form. Tereos sells liquid and powder polyols as excipients for oral dosage forms and medicated confectionery.
Table 4: Form, 2026 Share
| Leading Share | 2026 market share |
|---|---|
| Liquid | 72.0% |
| All Other Segments Combined Share | 28.0% |
Source: Future Market Insights analysis of the sorbitol market, 2026.
Why does Humectant and thickening agent lead by Functionality in the Sorbitol Market in 2026?
Humectant and thickening functions hold 43.0% of the Sorbitol Market by functionality in 2026.
Sorbitol is used in food processing, hygiene products including dental products, cosmetics and automotive applications. Federal rules list humectant, thickener and texturiser among its food functions, alongside nutritive sweetener. These functions span more end markets than sweetening alone, which explains why humectant and thickening functions lead the split. Sweetening and bulking, taste masking and other functions hold the remaining 57.0%. Many sugar reduction ranges pair bulk polyols with high-intensity sweeteners such as stevia.
Table 5: Functionality, 2026 Share
| Leading Share | 2026 market share |
|---|---|
| Humectant and thickening agent | 43.0% |
| All Other Segments Combined Share | 57.0% |
Source: Future Market Insights analysis of the sorbitol market, 2026.
What are the key drivers, restraints and opportunities?
Driver
Sugar reduction in food and drink. Brand owners are cutting sugar in confectionery and drinks. The WHO advises keeping free sugars below 10.0% of total energy intake, and a further cut to below 5.0% brings extra benefit. Reformulation that swaps sugar for a bulk sweetener can add sorbitol demand.
Pharmaceutical and oral care use. Non-food uses give sorbitol demand outside food contracts and food price cycles. Glycerol, sorbitol and sorbitol/sorbitan solutions are the plasticisers used most often in the shells of softgel capsules. The EMA describes sorbitol as an excipient in oral tablets, capsules and suspensions and in topical creams.
Restraint
Corn cost and Chinese export pricing. Feedstock cost rises while Chinese export prices stay low. The FAO cereal price index stands 17.2% above a year earlier. Chinese D-glucitol exports averaged USD 755 per tonne in 2024. Producers outside China therefore face lower competitor prices and higher input cost together.
Digestive tolerance limits. US rules require a laxative-effect label statement where daily intake may reach 50 grams. EU rules require a laxative warning on foods with more than 10% added polyols. These thresholds cap the sorbitol dose that a reformulated product can carry.
Opportunity
Pharmaceutical-grade supply. Pharmaceutical buyers specify sorbitol grades against pharmacopoeia monographs that include impurity tests. USP-NF added a limit test for diethylene glycol and ethylene glycol in 2010. Suppliers that meet such tests can sell into pharmaceutical contracts as well as food contracts.
Value-added sugar reduction systems. Suppliers that sell polyols alongside stevia, allulose and fibre can offer a full reformulation system and not a single commodity.
Sorbitol Market by Country (2026 to 2036)
Table 6: Sorbitol Market Country Growth Forecast
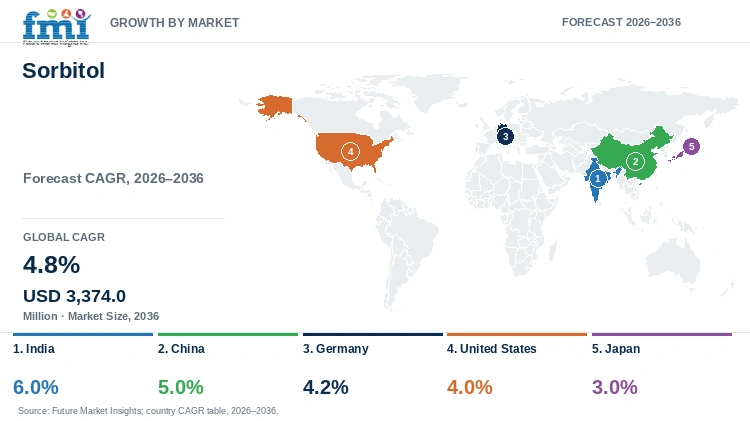
| Country | CAGR, 2026 to 2036 |
|---|---|
| India | 6.0% |
| China | 5.0% |
| Germany | 4.2% |
| United States | 4.0% |
| Japan | 3.0% |
Source: Future Market Insights analysis of the sorbitol market, 2026.
India
Export outlets and a growing starch industry add volume in India. The 6.0% CAGR projected for India from 2026 to 2036 is the highest among the profiled countries.
Feedstock supply and export outlets explain the lead. USDA reports record corn output of 48.5 million tonnes in 2025/26 from 13 million hectares, a yield of 3.7 tonnes per hectare. Two consecutive record harvests cut corn prices sharply, which reduces the glucose feedstock cost for starch processors. The starch industry uses 5.0 million tonnes of corn, or 10.3% of output. USDA expects a rise of 4.0% to 5.2 million tonnes in 2026/27.
Customs records show Indian D-glucitol exports of USD 61.0 million in 2024 against imports of USD 10.0 million. Five destinations accounted for half of that export value, led by the United Arab Emirates, Bangladesh and Nigeria. These outlets absorb output beyond domestic demand, and net exports were USD 51.0 million. Vietnam decided on 3 September 2026 not to extend its anti-dumping measures on Indian sorbitol. That removes a barrier for Indian exporters. Ethanol blending competes for the crop, with 12 million tonnes forecast for 2026/27 against 9 million tonnes in 2025/26. That is a rise of 33.3% and 2.3 times the starch industry's 5.2 million tonnes. Exporters therefore need to secure corn against fuel demand.
China
China shipped 223,609 tonnes of D-glucitol in 2024 and imported only 1,398 tonnes. Large export volumes and spare processing capacity give a 5.0% CAGR from 2026 to 2036.
Spare processing capacity, not feedstock, sets China's supply. The China Starch Industry Association reports that corn deep processing used about 85 million tonnes in 2024. Starch output reached 48 million tonnes and starch sugar exceeded 20 million tonnes. Processing capacity exceeds 130 million tonnes, so utilisation was below 66%. That slack lets processors add glucose, the sorbitol feedstock, without new milling plants. Northeastern farm prices for 2025/26 range from RMB 1,318 to 1,558 per tonne. That equals USD 184 to 218 at the USDA exchange rate of RMB 7.15.
Imports cost USD 3,572 per tonne against USD 755 for exports, so imports look limited to specialty grades. The US farm price of USD 4.16 per bushel in 2025/26 equals about USD 164 per tonne. That is below the Chinese range of USD 184 to 218, yet China exports 13 times the US volume. Cheap corn alone does not create export scale, since China also holds spare processing capacity. Buyers elsewhere can benchmark offers against the Chinese export price of USD 755 per tonne.
Germany
Germany is a mature food market that imports part of its supply. Customs records for 2024 show imports of 27,790 tonnes. At an average USD 1,144 per tonne, that is about USD 31.8 million. That mature profile fits a projected 4.2% CAGR from 2026 to 2036.
Germany sources 78% of its D-glucitol inside the European Union. France supplied 42% of 2024 import volume and Italy 29%. Chinese material was 19% of volume at USD 1,008 per tonne against USD 1,219 for French material. The difference is USD 211 per tonne. Imports from outside the Union were therefore 22% of volume. USDA projects French corn production for 2026/27 at 38% below the prior year, which can raise German procurement costs.
Regulation supports steady demand without lifting the growth rate. EU rules authorise sorbitol at quantum satis, meaning no numeric maximum, in applications such as sugar-free chewing gum. Sugar replacers may carry the claim that they help maintain tooth mineralisation. Foods with more than 10% added polyols must warn of laxative effects. That threshold caps the sorbitol dose per product for brands that avoid a warning label. German buyers pay more than Japanese buyers, at USD 1,144 per tonne against USD 920. The premium reflects supply, since France and Italy supplied most German imports.
United States
The United States is a mature market with near-balanced trade. Domestic corn supply is ample, and federal rules set the limits on sorbitol use in food. A 4.0% CAGR is projected for 2026 to 2036.
Near balance in trade explains the mature profile. The United States imported 19,747 tonnes of D-glucitol in 2024 and exported 16,704 tonnes. That leaves net imports of about 3,040 tonnes. Chinese origin supplied 53% of imports at USD 821 per tonne. French origin supplied 8% at USD 3,193 per tonne. Domestic corn is abundant, with 2025/26 production of 16.96 billion bushels. Food, seed and industrial use totals 6.90 billion bushels, and ethanol and by-products account for 5.55 billion of that. USDA projects the 2026/27 farm price at USD 4.70 per bushel, 13% above 2025/26.
Regulation also shapes how much sorbitol US food makers can use. Federal rules cite good manufacturing practice maximums of 75% in chewing gum and 98% in soft candy. Most other foods have a 12% maximum, and labels warn of a laxative effect at 50 grams a day. Asian origins supplied 90% of US import volume in 2024. US exports of 16,704 tonnes at USD 1,182 per tonne face a projected 13% rise in the corn price.
Japan
Japan is a mature, slow-growing market, as a shrinking population limits volume growth. The 2025 census counted 123.05 million people on 1 October 2025. Sorbitol demand in Japan is projected to grow at a 3.0% CAGR from 2026 to 2036.
Japan led D-glucitol imports by volume in 2024, at 37,186 tonnes against 36,554 for Poland. Its import bill of USD 34.2 million ranked second behind Poland and equals an average of USD 920 per tonne. Asian origins supplied 94% of import volume in 2024. Indonesia and China alone supplied 82% of volume but 69% of value. Indonesian cargoes averaged USD 724 per tonne and Chinese cargoes USD 862. German material averaged USD 2,752 per tonne, and Japan bought 2,007 tonnes of it. That is 3.8 times the Indonesian price, so German material serves a small high-priced niche in Japan.
Demographics limit the volume base these imports serve: the 2025 count is 3.097 million or 2.5% below the 2020 census. Population fell in 91% of municipalities, so the decline is broad and not local. Low-cost Asian supply holds the average import price near USD 920 per tonne, which limits value growth. Japan exported only 174 tonnes in 2024, so producers cannot offset falling domestic demand through exports. Imports of 37,186 tonnes are more than 200 times that export volume.
Who are the notable companies in the Sorbitol Market?
Notable companies in the Sorbitol Market include Roquette, Ingredion, Archer-Daniels-Midland, Gulshan Polyols and Tereos.
Access to glucose separates sorbitol producers, because sorbitol is a dextrose derivative. Corn wet millers make glucose in their own plants, as Roquette's Keokuk site does from corn. Ingredion Incorporated reported that sweetener products were 34.0% of its 2025 net sales. Archer-Daniels-Midland Company reported that corn accounted for 13.0% of 2025 revenues, and polyols sit in its Nutrition product list. Maize reached its highest price in over three years in September 2026, raising the cost of the corn route.
Roquette Frères makes sorbitol at plants in North America and Asia. Its Gurnee plant in Illinois produces sorbitol, maltitol and xylitol from glucose delivered by the Keokuk site in Iowa. Keokuk and the Lianyungang site in China also list sorbitol among their polyols. Roquette also supplies pharmaceutical excipients. Pharmaceutical buyers specify grades against monographs, and USP-NF added a limit test for diethylene glycol and ethylene glycol in 2010.
Gulshan Polyols Ltd is an Indian grain processor that sells a 70% sorbitol solution. Its company timeline lists sorbitol capacity raised from 15,000 to 60,000 tonnes. Its grain processing revenue fell 7.0% to INR 729 crore in fiscal 2025. Tereos is a European starch and sugar group that produces sorbitol, a dextrose derivative. It sells liquid and powder polyols as excipients for oral dosage forms. Regional producers sell against Chinese exports, which averaged USD 755 per tonne in 2024.
Key Developments in the Sorbitol Market
- On 3 September 2026 Vietnam decided not to extend anti-dumping measures on sorbitol from China, India and Indonesia. The Ministry of Industry and Trade began the end-of-term review in November 2025 and found the review request incomplete or invalid.
- On 2 October 2026 the FAO reported maize prices up 5.6% in September, the highest in more than three years. The FAO cereal price index reached 122.8 points, up 17.2% from a year earlier.
Key Players in the Sorbitol Market
- Roquette Frères
- Ingredion Incorporated
- Archer-Daniels-Midland Company
- Gulshan Polyols Ltd
- Tereos
Sorbitol Market Report Scope
Table 7: Sorbitol Market Report Scope
| Coverage field | Report scope |
|---|---|
| Market definition | Sorbitol (E420) in liquid and crystalline form sold to food, beverage, personal care, oral care, pharmaceutical and industrial buyers, valued at manufacturer selling prices. Other polyols such as xylitol, mannitol, maltitol and erythritol are excluded. |
| Application | Food and Beverage; Personal Care and Oral Care; Pharmaceuticals; Industrial and Vitamin C Intermediates |
| Source | Corn; Wheat; Cassava and tapioca; Other starches |
| Form | Liquid; Powder and crystalline |
| Functionality | Humectant and thickening agent; Sweetening and bulking agent; Taste masking and other functions |
| Regions and profiled countries | North America, Latin America, Europe, East Asia, South Asia, Oceania, Middle East and Africa. Profiled countries: India, China, Germany, United States, Japan |
| Companies covered | Roquette Frères; Ingredion Incorporated; Archer-Daniels-Midland Company; Gulshan Polyols Ltd; Tereos |
| Quantitative Units | USD million |
Sorbitol Market by Segments
Sorbitol Market segmented by Application:
- Food and Beverage
- Personal Care and Oral Care
- Pharmaceuticals
- Industrial and Vitamin C Intermediates
Sorbitol Market segmented by Source:
- Corn
- Wheat
- Cassava and tapioca
- Other starches
Sorbitol Market segmented by Form:
- Liquid
- Powder and crystalline
Sorbitol Market segmented by Functionality:
- Humectant and thickening agent
- Sweetening and bulking agent
- Taste masking and other functions
Sorbitol Market by Region
- North America
- Latin America
- Europe
- East Asia
- South Asia
- Oceania
- Middle East
- Africa
- India
- China
- Germany
- United States
- Japan
Research Sources and Bibliography
- [1] Food and Agriculture Organization of the United Nations. (2026, October 2). FAO Food Price Index, September 2026. https://www.fao.org/worldfoodsituation/foodpricesindex/en/
- [2] Ingredion Incorporated. (2026, February 17). Form 10-K for the year ended 31 December 2025. U.S. Securities and Exchange Commission. https://www.sec.gov/Archives/edgar/data/1046257/000162828026008603/ingr-20251231.htm
- [3] Archer-Daniels-Midland Company. (2026, February 17). Form 10-K for the year ended 31 December 2025. U.S. Securities and Exchange Commission. https://www.sec.gov/Archives/edgar/data/7084/000000708426000011/adm-20251231.htm
- [4] Gulshan Polyols Limited. Company website, products. https://www.gulshanindia.com/
- [5] World Health Organization. (2015, March 4). WHO calls on countries to reduce sugars intake among adults and children. https://www.who.int/news/item/04-03-2015-who-calls-on-countries-to-reduce-sugars-intake-among-adults-and-children
- [6] Gulshan Polyols Limited. (2025, November 6). Investor presentation on results for the quarter and half year ended 30 September 2025. https://www.gulshanindia.com/pdf/2025-26/IPSEPQ2FY2025-26.pdf
- [7] World Bank. (2026). D-glucitol (sorbitol) exports by country, 2024. World Integrated Trade Solution, UN Comtrade data. https://wits.worldbank.org/trade/comtrade/en/country/ALL/year/2024/tradeflow/Exports/partner/WLD/product/290544
- [8] World Bank. (2026). D-glucitol (sorbitol) imports by country, 2024. World Integrated Trade Solution, UN Comtrade data. https://wits.worldbank.org/trade/comtrade/en/country/ALL/year/2024/tradeflow/Imports/partner/WLD/product/290544
- [9] World Bank. (2026). Germany D-glucitol (sorbitol) imports by partner country, 2024. World Integrated Trade Solution, UN Comtrade data. https://wits.worldbank.org/trade/comtrade/en/country/DEU/year/2024/tradeflow/Imports/partner/ALL/product/290544
- [10] World Bank. (2026). Japan D-glucitol (sorbitol) imports by partner country, 2024. World Integrated Trade Solution, UN Comtrade data. https://wits.worldbank.org/trade/comtrade/en/country/JPN/year/2024/tradeflow/Imports/partner/ALL/product/290544
- [11] World Bank. (2026). United States D-glucitol (sorbitol) imports by partner country, 2024. World Integrated Trade Solution, UN Comtrade data. https://wits.worldbank.org/trade/comtrade/en/country/USA/year/2024/tradeflow/Imports/partner/ALL/product/290544
- [12] World Bank. (2026). India D-glucitol (sorbitol) exports by partner country, 2024. World Integrated Trade Solution, UN Comtrade data. https://wits.worldbank.org/trade/comtrade/en/country/IND/year/2024/tradeflow/Exports/partner/ALL/product/290544
- [13] U.S. Department of Agriculture, Foreign Agricultural Service. (2025, September 30). China: Grain and Feed Update (CH2025-0194). https://apps.fas.usda.gov/newgainapi/api/Report/DownloadReportByFileName?fileName=Grain+and+Feed+Update_Beijing_China+-+People%27s+Republic+of_CH2025-0194.pdf
- [14] U.S. Department of Agriculture, Foreign Agricultural Service. (2026, April 2). India: Grain and Feed Annual (IN2026-0019). https://apps.fas.usda.gov/newgainapi/api/Report/DownloadReportByFileName?fileName=Grain%20and%20Feed%20Annual_New%20Delhi_India_IN2026-0019.pdf
- [15] U.S. Department of Agriculture, Office of the Chief Economist. (2026, October 9). World Agricultural Supply and Demand Estimates, WASDE-676. https://www.usda.gov/oce/commodity/wasde/wasde1026.pdf
- [16] Statistics Bureau of Japan. (2026, June 25). News Bulletin No. 380: Preliminary counts of the 2025 Population Census of Japan. https://www.stat.go.jp/english/info/news/20260625.html
- [17] Office of the Federal Register. (2026). 21 CFR 184.1835, Sorbitol. Legal Information Institute, Cornell Law School. https://www.law.cornell.edu/cfr/text/21/184.1835
- [18] European Association of Polyol Producers. (2017, March 22). Food: polyol legislation in the EU. https://polyols-eu.org/legislation/food/
- [19] Vietnam Trade Remedies Authority, Ministry of Industry and Trade. (2026, September 3). Decision No. 2144/QD-BCT on the end-of-term review of anti-dumping measures on sorbitol from India, Indonesia and China (ER01.AD14) [in Vietnamese]. https://trav.gov.vn/default.aspx?page=news&do=detail&category_id=91b07cf1-3658-4f39-b688-73b9e8ff8a05&id=44b7fb17-21ce-4a8a-9d0a-4ff092376964
- [20] Roquette. Our history. Company website. https://www.roquette.com/about/history
- [21] Tereos. (2026, January 12). Disclosure document. https://www.tereos.com/app/uploads/2026/01/disclosure-document-12-jan-2026.pdf
- [22] Tereos. Pharmaceuticals and cosmetics. Company website. https://tereos.com/en/activities-and-products/markets/pharmaceuticals-and-cosmetics/
- [23] Damian, F. et al. (2021). Challenges of dissolution methods development for soft gelatin capsules. Pharmaceutics, 13(2), 214. https://www.mdpi.com/1999-4923/13/2/214
- [24] European Medicines Agency. (2016, May 4). Draft information in the package leaflet for fructose and sorbitol (EMA/CHMP/460886/2014). https://www.ema.europa.eu/en/scientific-guidelines/fructose-sorbitol
- [25] United States Pharmacopeia. (2009, October 30). Sorbitol Sorbitan Solution, revision bulletin (official 1 February 2010). USP-NF. https://www.uspnf.com/official-text/accelerated-revision-process/accelerated-revision-history/sorbitol-sorbitan-solution
- [26] British Pharmacopoeia Commission. (2013). Liquid Sorbitol (Non-crystallising), Ph Eur monograph 0437. British Pharmacopoeia 2013. https://www.drugfuture.com/Pharmacopoeia/BP2013/data/6795.html
Table of Content
- Key Takeaways
- Market Size and CAGR
- Top Growth Driver
- Fastest Growing Segment
- Leading Region
- Key Companies
- Emerging Opportunities
- Executive Summary
- Global Market Outlook
- Demand-side Trends
- Supply-side Trends
- Technology Roadmap Analysis
- Analysis and Recommendations
- Analyst Perspective (What is happening? Why now? What should investors know?)
- Key Questions Answered
- How large is the market?
- What is the CAGR?
- What are key trends?
- Which region dominates?
- Who are the leaders?
Read More...
- Market Overview
- Market Coverage / Taxonomy
- Market Definition / Scope / Limitations
- Research Methodology
- Chapter Orientation
- Analytical Lens and Working Hypotheses
- Market Structure, Signals, and Trend Drivers
- Benchmarking and Cross-market Comparability
- Market Sizing, Forecasting, and Opportunity Mapping
- Research Design and Evidence Framework
- Desk Research Programme (Secondary Evidence)
- Expert Input and Fieldwork (Primary Evidence)
- Tooling, Models, and Reference Databases
- Data Engineering and Model Build
- Quality Assurance and Audit Trail
- Market Background
- Market Dynamics (Drivers, Restraints, Opportunity, Trends)
- Scenario Forecast (Optimistic, Likely, Conservative)
- Impact Analysis
- AI Impact
- Sustainability Impact
- Regulatory Impact
- Technology Impact
- Consumer / Buyer Analysis
- Purchase Drivers
- Adoption Barriers
- Buyer Journey
- Opportunity Map Analysis
- Product Life Cycle Analysis
- Supply Chain Analysis
- Investment Feasibility Matrix
- Value Chain Analysis
- PESTLE and Porter's Analysis
- Regulatory Landscape
- Regional Parent Market Outlook
- Production and Consumption Statistics
- Import and Export Statistics
- Global Market Analysis and Forecast, 2021 to 2036
- Historical Market Size Value (USD Million) Analysis, 2021 to 2025
- Current and Future Market Size Value (USD Million) Projections, 2026 to 2036
- Y-o-Y Growth Trend Analysis
- Absolute $ Opportunity Analysis
- Global Market Pricing Analysis, 2021 to 2036
- Global Market Analysis and Forecast, By Application, 2021 to 2036
- Introduction / Key Findings
- Historical Market Size Value (USD Million) Analysis By Application, 2021 to 2025
- Current and Future Market Size Value (USD Million) Analysis and Forecast By Application, 2026 to 2036
- Food and Beverage
- Personal Care and Oral Care
- Pharmaceuticals
- Industrial and Vitamin C Intermediates
- Y-o-Y Growth Trend Analysis By Application, 2021 to 2025
- Absolute $ Opportunity Analysis By Application, 2026 to 2036
- Global Market Analysis and Forecast, By Source, 2021 to 2036
- Introduction / Key Findings
- Historical Market Size Value (USD Million) Analysis By Source, 2021 to 2025
- Current and Future Market Size Value (USD Million) Analysis and Forecast By Source, 2026 to 2036
- Corn
- Wheat
- Cassava and tapioca
- Other starches
- Y-o-Y Growth Trend Analysis By Source, 2021 to 2025
- Absolute $ Opportunity Analysis By Source, 2026 to 2036
- Global Market Analysis and Forecast, By Form, 2021 to 2036
- Introduction / Key Findings
- Historical Market Size Value (USD Million) Analysis By Form, 2021 to 2025
- Current and Future Market Size Value (USD Million) Analysis and Forecast By Form, 2026 to 2036
- Liquid
- Powder and crystalline
- Y-o-Y Growth Trend Analysis By Form, 2021 to 2025
- Absolute $ Opportunity Analysis By Form, 2026 to 2036
- Global Market Analysis and Forecast, By Functionality, 2021 to 2036
- Introduction / Key Findings
- Historical Market Size Value (USD Million) Analysis By Functionality, 2021 to 2025
- Current and Future Market Size Value (USD Million) Analysis and Forecast By Functionality, 2026 to 2036
- Humectant and thickening agent
- Sweetening and bulking agent
- Taste masking and other functions
- Y-o-Y Growth Trend Analysis By Functionality, 2021 to 2025
- Absolute $ Opportunity Analysis By Functionality, 2026 to 2036
- Global Market Analysis and Forecast, By Region, 2021 to 2036
- Introduction
- Historical Market Size Value (USD Million) Analysis By Region, 2021 to 2025
- Current Market Size Value (USD Million) Analysis and Forecast By Region, 2026 to 2036
- North America
- Latin America
- Europe
- East Asia
- South Asia
- Oceania
- Middle East
- Africa
- Market Attractiveness Analysis By Region
- North America Market Analysis and Forecast, By Country, 2021 to 2036
- Historical Market Size Value (USD Million) Trend Analysis By Market Taxonomy, 2021 to 2025
- Market Size Value (USD Million) Forecast By Market Taxonomy, 2026 to 2036
- By Country
- By Application
- By Source
- By Form
- By Functionality
- Market Attractiveness Analysis
- By Country
- By Application
- By Source
- By Form
- By Functionality
- Key Takeaways
- Latin America Market Analysis and Forecast, By Country
- Historical Market Size Value (USD Million) Trend Analysis By Market Taxonomy, 2021 to 2025
- Market Size Value (USD Million) Forecast By Market Taxonomy, 2026 to 2036
- By Country
- By Application
- By Source
- By Form
- By Functionality
- Market Attractiveness Analysis
- By Country
- By Application
- By Source
- By Form
- By Functionality
- Key Takeaways
- Europe Market Analysis and Forecast, By Country
- Historical Market Size Value (USD Million) Trend Analysis By Market Taxonomy, 2021 to 2025
- Market Size Value (USD Million) Forecast By Market Taxonomy, 2026 to 2036
- By Country
- By Application
- By Source
- By Form
- By Functionality
- Market Attractiveness Analysis
- By Country
- By Application
- By Source
- By Form
- By Functionality
- Key Takeaways
- East Asia Market Analysis and Forecast, By Country
- Historical Market Size Value (USD Million) Trend Analysis By Market Taxonomy, 2021 to 2025
- Market Size Value (USD Million) Forecast By Market Taxonomy, 2026 to 2036
- By Country
- By Application
- By Source
- By Form
- By Functionality
- Market Attractiveness Analysis
- By Country
- By Application
- By Source
- By Form
- By Functionality
- Key Takeaways
- South Asia Market Analysis and Forecast, By Country
- Historical Market Size Value (USD Million) Trend Analysis By Market Taxonomy, 2021 to 2025
- Market Size Value (USD Million) Forecast By Market Taxonomy, 2026 to 2036
- By Country
- By Application
- By Source
- By Form
- By Functionality
- Market Attractiveness Analysis
- By Country
- By Application
- By Source
- By Form
- By Functionality
- Key Takeaways
- Oceania Market Analysis and Forecast, By Country
- Historical Market Size Value (USD Million) Trend Analysis By Market Taxonomy, 2021 to 2025
- Market Size Value (USD Million) Forecast By Market Taxonomy, 2026 to 2036
- By Country
- By Application
- By Source
- By Form
- By Functionality
- Market Attractiveness Analysis
- By Country
- By Application
- By Source
- By Form
- By Functionality
- Key Takeaways
- Middle East Market Analysis and Forecast, By Country
- Historical Market Size Value (USD Million) Trend Analysis By Market Taxonomy, 2021 to 2025
- Market Size Value (USD Million) Forecast By Market Taxonomy, 2026 to 2036
- By Country
- By Application
- By Source
- By Form
- By Functionality
- Market Attractiveness Analysis
- By Country
- By Application
- By Source
- By Form
- By Functionality
- Key Takeaways
- Africa Market Analysis and Forecast, By Country
- Historical Market Size Value (USD Million) Trend Analysis By Market Taxonomy, 2021 to 2025
- Market Size Value (USD Million) Forecast By Market Taxonomy, 2026 to 2036
- By Country
- India
- China
- Germany
- United States
- Japan
- By Application
- By Source
- By Form
- By Functionality
- By Country
- Market Attractiveness Analysis
- By Country
- By Application
- By Source
- By Form
- By Functionality
- Key Takeaways
- Key Countries Market Analysis
- United States
- Pricing Analysis
- Market Share Analysis, 2025
- By Application
- By Source
- By Form
- By Functionality
- Germany
- Pricing Analysis
- Market Share Analysis, 2025
- By Application
- By Source
- By Form
- By Functionality
- India
- Pricing Analysis
- Market Share Analysis, 2025
- By Application
- By Source
- By Form
- By Functionality
- China
- Pricing Analysis
- Market Share Analysis, 2025
- By Application
- By Source
- By Form
- By Functionality
- Japan
- Pricing Analysis
- Market Share Analysis, 2025
- By Application
- By Source
- By Form
- By Functionality
- United States
- Market Structure Analysis
- Competition Dashboard
- Competition Benchmarking
- Market Share Analysis of Top Players
- By Regional
- By Application
- By Source
- By Form
- By Functionality
- Emerging Startups
- Innovation Benchmarking
- Competition Analysis
- Competition Deep Dive
- Roquette Frères
- Overview
- Product Portfolio
- Profitability by Market Segments
- Sales Footprint
- Strategy Overview
- Marketing Strategy
- Product Strategy
- Channel Strategy
- Ingredion Incorporated
- Archer-Daniels-Midland Company
- Gulshan Polyols Ltd
- Tereos
- Roquette Frères
- Case Studies
- Success Stories
- Recent Developments
- Competition Deep Dive
- Assumptions & Acronyms Used
List of Tables
- Table 1: Global Market Value (USD Million) Forecast by Region, 2021 to 2036
- Table 2: Global Market Value (USD Million) Forecast by Application, 2021 to 2036
- Table 3: Global Market Value (USD Million) Forecast by Source, 2021 to 2036
- Table 4: Global Market Value (USD Million) Forecast by Form, 2021 to 2036
- Table 5: Global Market Value (USD Million) Forecast by Functionality, 2021 to 2036
- Table 6: North America Market Value (USD Million) Forecast by Country, 2021 to 2036
- Table 7: North America Market Value (USD Million) Forecast by Application, 2021 to 2036
- Table 8: North America Market Value (USD Million) Forecast by Source, 2021 to 2036
- Table 9: North America Market Value (USD Million) Forecast by Form, 2021 to 2036
- Table 10: North America Market Value (USD Million) Forecast by Functionality, 2021 to 2036
- Table 11: Latin America Market Value (USD Million) Forecast by Country, 2021 to 2036
- Table 12: Latin America Market Value (USD Million) Forecast by Application, 2021 to 2036
- Table 13: Latin America Market Value (USD Million) Forecast by Source, 2021 to 2036
- Table 14: Latin America Market Value (USD Million) Forecast by Form, 2021 to 2036
- Table 15: Latin America Market Value (USD Million) Forecast by Functionality, 2021 to 2036
- Table 16: Europe Market Value (USD Million) Forecast by Country, 2021 to 2036
- Table 17: Europe Market Value (USD Million) Forecast by Application, 2021 to 2036
- Table 18: Europe Market Value (USD Million) Forecast by Source, 2021 to 2036
- Table 19: Europe Market Value (USD Million) Forecast by Form, 2021 to 2036
- Table 20: Europe Market Value (USD Million) Forecast by Functionality, 2021 to 2036
- Table 21: East Asia Market Value (USD Million) Forecast by Country, 2021 to 2036
- Table 22: East Asia Market Value (USD Million) Forecast by Application, 2021 to 2036
- Table 23: East Asia Market Value (USD Million) Forecast by Source, 2021 to 2036
- Table 24: East Asia Market Value (USD Million) Forecast by Form, 2021 to 2036
- Table 25: East Asia Market Value (USD Million) Forecast by Functionality, 2021 to 2036
- Table 26: South Asia Market Value (USD Million) Forecast by Country, 2021 to 2036
- Table 27: South Asia Market Value (USD Million) Forecast by Application, 2021 to 2036
- Table 28: South Asia Market Value (USD Million) Forecast by Source, 2021 to 2036
- Table 29: South Asia Market Value (USD Million) Forecast by Form, 2021 to 2036
- Table 30: South Asia Market Value (USD Million) Forecast by Functionality, 2021 to 2036
- Table 31: Oceania Market Value (USD Million) Forecast by Country, 2021 to 2036
- Table 32: Oceania Market Value (USD Million) Forecast by Application, 2021 to 2036
- Table 33: Oceania Market Value (USD Million) Forecast by Source, 2021 to 2036
- Table 34: Oceania Market Value (USD Million) Forecast by Form, 2021 to 2036
- Table 35: Oceania Market Value (USD Million) Forecast by Functionality, 2021 to 2036
- Table 36: Middle East Market Value (USD Million) Forecast by Country, 2021 to 2036
- Table 37: Middle East Market Value (USD Million) Forecast by Application, 2021 to 2036
- Table 38: Middle East Market Value (USD Million) Forecast by Source, 2021 to 2036
- Table 39: Middle East Market Value (USD Million) Forecast by Form, 2021 to 2036
- Table 40: Middle East Market Value (USD Million) Forecast by Functionality, 2021 to 2036
- Table 41: Africa Market Value (USD Million) Forecast by Country, 2021 to 2036
- Table 42: Africa Market Value (USD Million) Forecast by Application, 2021 to 2036
- Table 43: Africa Market Value (USD Million) Forecast by Source, 2021 to 2036
- Table 44: Africa Market Value (USD Million) Forecast by Form, 2021 to 2036
- Table 45: Africa Market Value (USD Million) Forecast by Functionality, 2021 to 2036
List of Figures
- Figure 1: Global Market Pricing Analysis
- Figure 2: Global Market Value (USD Million) Forecast 2021-2036
- Figure 3: Global Market Value Share and BPS Analysis by Application, 2026 and 2036
- Figure 4: Global Market Y-o-Y Growth Comparison by Application, 2026-2036
- Figure 5: Global Market Attractiveness Analysis by Application
- Figure 6: Global Market Value Share and BPS Analysis by Source, 2026 and 2036
- Figure 7: Global Market Y-o-Y Growth Comparison by Source, 2026-2036
- Figure 8: Global Market Attractiveness Analysis by Source
- Figure 9: Global Market Value Share and BPS Analysis by Form, 2026 and 2036
- Figure 10: Global Market Y-o-Y Growth Comparison by Form, 2026-2036
- Figure 11: Global Market Attractiveness Analysis by Form
- Figure 12: Global Market Value Share and BPS Analysis by Functionality, 2026 and 2036
- Figure 13: Global Market Y-o-Y Growth Comparison by Functionality, 2026-2036
- Figure 14: Global Market Attractiveness Analysis by Functionality
- Figure 15: Global Market Value (USD Million) Share and BPS Analysis by Region, 2026 and 2036
- Figure 16: Global Market Y-o-Y Growth Comparison by Region, 2026-2036
- Figure 17: Global Market Attractiveness Analysis by Region
- Figure 18: North America Market Incremental Dollar Opportunity, 2026-2036
- Figure 19: Latin America Market Incremental Dollar Opportunity, 2026-2036
- Figure 20: Europe Market Incremental Dollar Opportunity, 2026-2036
- Figure 21: East Asia Market Incremental Dollar Opportunity, 2026-2036
- Figure 22: South Asia Market Incremental Dollar Opportunity, 2026-2036
- Figure 23: Oceania Market Incremental Dollar Opportunity, 2026-2036
- Figure 24: Middle East Market Incremental Dollar Opportunity, 2026-2036
- Figure 25: Africa Market Incremental Dollar Opportunity, 2026-2036
- Figure 26: North America Market Value Share and BPS Analysis by Country, 2026 and 2036
- Figure 27: North America Market Value Share and BPS Analysis by Application, 2026 and 2036
- Figure 28: North America Market Y-o-Y Growth Comparison by Application, 2026-2036
- Figure 29: North America Market Attractiveness Analysis by Application
- Figure 30: North America Market Value Share and BPS Analysis by Source, 2026 and 2036
- Figure 31: North America Market Y-o-Y Growth Comparison by Source, 2026-2036
- Figure 32: North America Market Attractiveness Analysis by Source
- Figure 33: North America Market Value Share and BPS Analysis by Form, 2026 and 2036
- Figure 34: North America Market Y-o-Y Growth Comparison by Form, 2026-2036
- Figure 35: North America Market Attractiveness Analysis by Form
- Figure 36: North America Market Value Share and BPS Analysis by Functionality, 2026 and 2036
- Figure 37: North America Market Y-o-Y Growth Comparison by Functionality, 2026-2036
- Figure 38: North America Market Attractiveness Analysis by Functionality
- Figure 39: Latin America Market Value Share and BPS Analysis by Country, 2026 and 2036
- Figure 40: Latin America Market Value Share and BPS Analysis by Application, 2026 and 2036
- Figure 41: Latin America Market Y-o-Y Growth Comparison by Application, 2026-2036
- Figure 42: Latin America Market Attractiveness Analysis by Application
- Figure 43: Latin America Market Value Share and BPS Analysis by Source, 2026 and 2036
- Figure 44: Latin America Market Y-o-Y Growth Comparison by Source, 2026-2036
- Figure 45: Latin America Market Attractiveness Analysis by Source
- Figure 46: Latin America Market Value Share and BPS Analysis by Form, 2026 and 2036
- Figure 47: Latin America Market Y-o-Y Growth Comparison by Form, 2026-2036
- Figure 48: Latin America Market Attractiveness Analysis by Form
- Figure 49: Latin America Market Value Share and BPS Analysis by Functionality, 2026 and 2036
- Figure 50: Latin America Market Y-o-Y Growth Comparison by Functionality, 2026-2036
- Figure 51: Latin America Market Attractiveness Analysis by Functionality
- Figure 52: Europe Market Value Share and BPS Analysis by Country, 2026 and 2036
- Figure 53: Europe Market Value Share and BPS Analysis by Application, 2026 and 2036
- Figure 54: Europe Market Y-o-Y Growth Comparison by Application, 2026-2036
- Figure 55: Europe Market Attractiveness Analysis by Application
- Figure 56: Europe Market Value Share and BPS Analysis by Source, 2026 and 2036
- Figure 57: Europe Market Y-o-Y Growth Comparison by Source, 2026-2036
- Figure 58: Europe Market Attractiveness Analysis by Source
- Figure 59: Europe Market Value Share and BPS Analysis by Form, 2026 and 2036
- Figure 60: Europe Market Y-o-Y Growth Comparison by Form, 2026-2036
- Figure 61: Europe Market Attractiveness Analysis by Form
- Figure 62: Europe Market Value Share and BPS Analysis by Functionality, 2026 and 2036
- Figure 63: Europe Market Y-o-Y Growth Comparison by Functionality, 2026-2036
- Figure 64: Europe Market Attractiveness Analysis by Functionality
- Figure 65: East Asia Market Value Share and BPS Analysis by Country, 2026 and 2036
- Figure 66: East Asia Market Value Share and BPS Analysis by Application, 2026 and 2036
- Figure 67: East Asia Market Y-o-Y Growth Comparison by Application, 2026-2036
- Figure 68: East Asia Market Attractiveness Analysis by Application
- Figure 69: East Asia Market Value Share and BPS Analysis by Source, 2026 and 2036
- Figure 70: East Asia Market Y-o-Y Growth Comparison by Source, 2026-2036
- Figure 71: East Asia Market Attractiveness Analysis by Source
- Figure 72: East Asia Market Value Share and BPS Analysis by Form, 2026 and 2036
- Figure 73: East Asia Market Y-o-Y Growth Comparison by Form, 2026-2036
- Figure 74: East Asia Market Attractiveness Analysis by Form
- Figure 75: East Asia Market Value Share and BPS Analysis by Functionality, 2026 and 2036
- Figure 76: East Asia Market Y-o-Y Growth Comparison by Functionality, 2026-2036
- Figure 77: East Asia Market Attractiveness Analysis by Functionality
- Figure 78: South Asia Market Value Share and BPS Analysis by Country, 2026 and 2036
- Figure 79: South Asia Market Value Share and BPS Analysis by Application, 2026 and 2036
- Figure 80: South Asia Market Y-o-Y Growth Comparison by Application, 2026-2036
- Figure 81: South Asia Market Attractiveness Analysis by Application
- Figure 82: South Asia Market Value Share and BPS Analysis by Source, 2026 and 2036
- Figure 83: South Asia Market Y-o-Y Growth Comparison by Source, 2026-2036
- Figure 84: South Asia Market Attractiveness Analysis by Source
- Figure 85: South Asia Market Value Share and BPS Analysis by Form, 2026 and 2036
- Figure 86: South Asia Market Y-o-Y Growth Comparison by Form, 2026-2036
- Figure 87: South Asia Market Attractiveness Analysis by Form
- Figure 88: South Asia Market Value Share and BPS Analysis by Functionality, 2026 and 2036
- Figure 89: South Asia Market Y-o-Y Growth Comparison by Functionality, 2026-2036
- Figure 90: South Asia Market Attractiveness Analysis by Functionality
- Figure 91: Oceania Market Value Share and BPS Analysis by Country, 2026 and 2036
- Figure 92: Oceania Market Value Share and BPS Analysis by Application, 2026 and 2036
- Figure 93: Oceania Market Y-o-Y Growth Comparison by Application, 2026-2036
- Figure 94: Oceania Market Attractiveness Analysis by Application
- Figure 95: Oceania Market Value Share and BPS Analysis by Source, 2026 and 2036
- Figure 96: Oceania Market Y-o-Y Growth Comparison by Source, 2026-2036
- Figure 97: Oceania Market Attractiveness Analysis by Source
- Figure 98: Oceania Market Value Share and BPS Analysis by Form, 2026 and 2036
- Figure 99: Oceania Market Y-o-Y Growth Comparison by Form, 2026-2036
- Figure 100: Oceania Market Attractiveness Analysis by Form
- Figure 101: Oceania Market Value Share and BPS Analysis by Functionality, 2026 and 2036
- Figure 102: Oceania Market Y-o-Y Growth Comparison by Functionality, 2026-2036
- Figure 103: Oceania Market Attractiveness Analysis by Functionality
- Figure 104: Middle East Market Value Share and BPS Analysis by Country, 2026 and 2036
- Figure 105: Middle East Market Value Share and BPS Analysis by Application, 2026 and 2036
- Figure 106: Middle East Market Y-o-Y Growth Comparison by Application, 2026-2036
- Figure 107: Middle East Market Attractiveness Analysis by Application
- Figure 108: Middle East Market Value Share and BPS Analysis by Source, 2026 and 2036
- Figure 109: Middle East Market Y-o-Y Growth Comparison by Source, 2026-2036
- Figure 110: Middle East Market Attractiveness Analysis by Source
- Figure 111: Middle East Market Value Share and BPS Analysis by Form, 2026 and 2036
- Figure 112: Middle East Market Y-o-Y Growth Comparison by Form, 2026-2036
- Figure 113: Middle East Market Attractiveness Analysis by Form
- Figure 114: Middle East Market Value Share and BPS Analysis by Functionality, 2026 and 2036
- Figure 115: Middle East Market Y-o-Y Growth Comparison by Functionality, 2026-2036
- Figure 116: Middle East Market Attractiveness Analysis by Functionality
- Figure 117: Africa Market Value Share and BPS Analysis by Country, 2026 and 2036
- Figure 118: Africa Market Value Share and BPS Analysis by Application, 2026 and 2036
- Figure 119: Africa Market Y-o-Y Growth Comparison by Application, 2026-2036
- Figure 120: Africa Market Attractiveness Analysis by Application
- Figure 121: Africa Market Value Share and BPS Analysis by Source, 2026 and 2036
- Figure 122: Africa Market Y-o-Y Growth Comparison by Source, 2026-2036
- Figure 123: Africa Market Attractiveness Analysis by Source
- Figure 124: Africa Market Value Share and BPS Analysis by Form, 2026 and 2036
- Figure 125: Africa Market Y-o-Y Growth Comparison by Form, 2026-2036
- Figure 126: Africa Market Attractiveness Analysis by Form
- Figure 127: Africa Market Value Share and BPS Analysis by Functionality, 2026 and 2036
- Figure 128: Africa Market Y-o-Y Growth Comparison by Functionality, 2026-2036
- Figure 129: Africa Market Attractiveness Analysis by Functionality
- Figure 130: Global Market - Tier Structure Analysis
- Figure 131: Global Market - Company Share Analysis
Frequently Asked Questions
How big is the sorbitol market in 2026?
FMI estimates the market at USD 2,111.2 million in 2026, up from USD 2,030.0 million in 2025. It is forecast to reach USD 3,374.0 million by 2036 at a 4.8% CAGR.
Which application leads the sorbitol market in 2026?
Food and Beverage leads by application with 52.0% in 2026. Personal care and oral care, pharmaceuticals and industrial uses together hold 48.0%.
Which source and form lead?
Corn holds 72.0% by source and liquid forms hold 72.0% by form in FMI's 2026 assessment.
Which country is forecast to grow fastest through 2036?
India has the highest forecast CAGR among the profiled countries at 6.0% during 2026 to 2036, followed by China at 5.0%.
Does sorbitol require a food warning?
Yes, above set thresholds. US rules require a laxative-effect label statement where daily intake may reach 50 grams [17]. EU rules require a laxative warning on foods with more than 10% added polyols [18].
What happens to sorbitol demand when corn prices rise?
Production cost rises because corn is the main feedstock, as the September 2026 maize price high reported by FAO shows [1]. Producers pass on costs where contracts allow, and some switch to wheat or cassava starch.
Preview the report firsthand - request a free sample
Get SampleGet the brochure for pricing and purchase details.
Get PDF
