

- Market Size (2026)
- USD 2.4 Bn
- Forecast (2036)
- USD 5.6 Bn
- CAGR (2026 to 2036)
- 8.7%
How big is the Sports Replay System Market in 2026?
USD 2.4 billion in 2026 and USD 5.6 billion by 2036 at an 8.7% CAGR.
Live sport production is shifting from basic clip return toward evidence-led replay and near-live content packaging. Buyers need systems that capture multiple angles and return the decisive view quickly during official incidents. Official review also needs audit trails that do not slow the event for officials and viewers. FIFA said in May 2024 that Football Video Support may be used in competitions covered by one to four cameras. That lower-cost review tier shows how smaller competitions can widen the buyer base without full VAR budgets. Teams using sports analytics also expect replay footage to support post-match interpretation and fan-facing explanation.
Broadcasters and stadium operators buy replay systems for different operating pressures during live events. Broadcasters need instant playout and archive-ready clips that can move into rights packages quickly. Leagues need review rooms that can defend a match decision under public scrutiny during contested incidents. Stadiums need board-ready replays during natural pauses to keep spectators informed without slowing operations. Service providers need portable workflows that can cover tournaments without permanent venue ownership or fixed control rooms.
Adoption in established broadcast markets is shaped by replacement cycles and rights renewal activity. It is also influenced by lower tolerance for match-day failure during premium events and live broadcasts. High-growth countries drive demand from venue upgrades and public funding for sports infrastructure across new event properties. Replay becomes more valuable once it connects capture and review with media processing and archive management in one controlled workflow. The same workflow must feed video streaming teams and fan-facing content groups during the event week. Senior buyers therefore assess latency and operator skills before approving replay investment for official review and live programming.
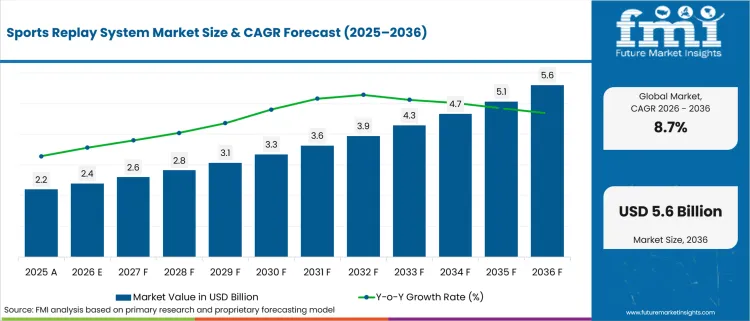
| Metric | Value |
|---|---|
| 2025 Market Size | USD 2.2 billion |
| 2026 Market Size | USD 2.4 billion |
| 2036 Market Size | USD 5.6 billion |
| Forecast CAGR (2026-2036) | 8.7% |
| Leading System Type | Slow-motion Replay Systems |
| Slow-motion Replay Systems Share (2026) | 34.6% |
| Leading Sport Type | Football / Soccer |
| Football / Soccer Share (2026) | 38.5% |
| Leading Deployment | On-premise Servers |
| On-premise Servers Share (2026) | 48.8% |
| Fastest-growing Country | India |
| India CAGR by 2036 | 10.5% |
Summary of the Sports Replay System Market
| Market Signal | Commercial Impact |
|---|---|
| Demand and Growth Drivers | Demand for sports replay systems is increasing as broadcasters, sports leagues, and venue operators require reliable replay technologies that improve officiating accuracy, broadcast quality, and fan engagement.
|
| Product and Segment View | Slow-motion replay systems, football applications, and on-premise deployments continue to represent the leading commercial opportunities across the market.
|
| Geography and Growth Outlook | North America and Asia continue to drive market expansion through increasing sports media investment, stadium modernization, and professional league development.
|
| Competitive Landscape | Competition increasingly focuses on replay performance, live production integration, officiating support, and end-to-end sports broadcasting solutions.
|
| Analyst Perspective | Sports replay systems are evolving from conventional broadcast tools into critical decision-support and content management platforms that improve officiating, viewer engagement, and live production efficiency.
- Sudip Saha, Principal Consultant at Future Market Insights |
How is the sports replay system market segmented?
The Sports Replay System industry is segmented by system type, sport type, deployment, end use, sales model, and region.
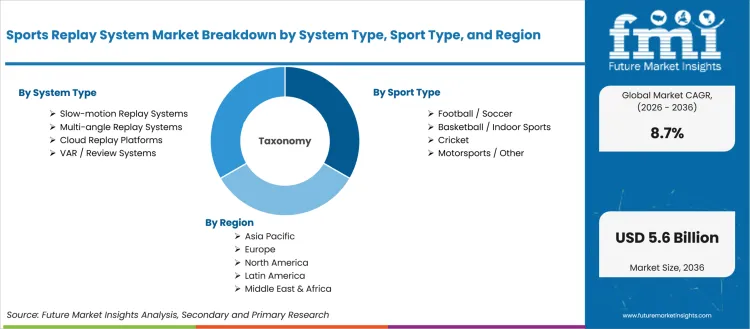
The sports replay system market is segmented by system type, sport type, deployment, end use, sales model, and region. By system type, the scope covers Slow-motion Replay Systems, Multi-angle Replay Systems, VAR / Review Systems, and Cloud Replay Platforms. By sport type, it includes Football / Soccer, Cricket, Basketball / Indoor Sports, and Motorsports / Other. By deployment, it spans On-premise Servers, Hybrid Workflows, and Cloud-native Workflows. By end use, demand comes from Broadcasters, Stadiums & Arenas, Leagues / Federations, and Production Service Providers. By sales model, the market covers System Sale, Subscription / Software, and Managed Service. Regional coverage extends across North America, Latin America, Europe, East Asia, South Asia and Pacific, and the Middle East and Africa.
Why do Slow-motion Replay Systems retain a notable system-type position?
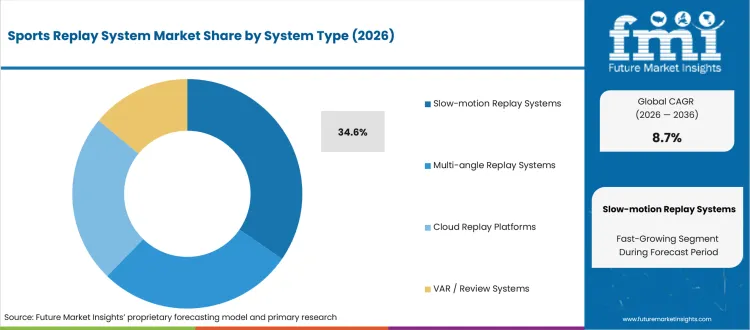
Live production teams need repeatable clip return during moments that last only a few seconds. The operating problem is not storage alone but the ability to tag, scrub, and play back the right angle during live programme pressure. Slow-motion replay remains central due to operator trust in familiar controls during event pressure.
- In 2026, slow-motion replay systems are anticipated to hold 34.6% of system type demand, driven by clip speed and controller familiarity during live matches. EVS announced in September 2025 that Gravity Media selected XT-VIA servers and LSM-VIA replay systems. This reinforces the role of server-led replay in professional live production.
- Production buyers using slow-motion replay gain a dependable control layer for decisive moments, supported by trained operators and predictable playout paths. The executive value is reduced on-air risk, faster clip selection, and stronger reuse of match footage across highlight packages after the event feed closes.
What makes Football / Soccer a core sport-type category?
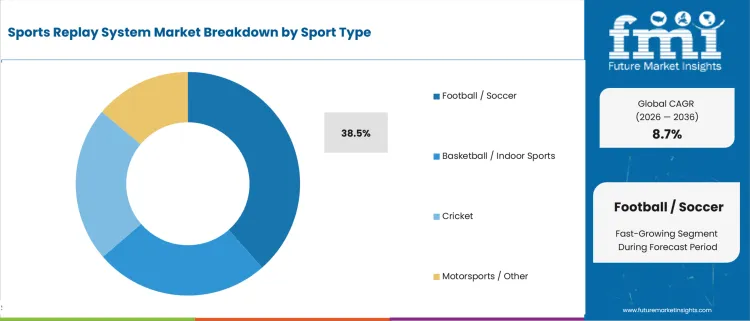
Football replay demand sits between officiating evidence and broadcast storytelling. Leagues need systems that can show a referee the relevant angle without turning every incident into a long stoppage. The same clips then need graphics, commentary, and crowd explanation. This makes sports officiating requirements central to the sport-type mix.
- Football / Soccer are expected to hold 38.5% share in 2026, supported by VAR use and offside review workflows. Premier League guidance for 2024-25 confirmed semi-automated offsides for the league. That makes replay procurement more dependent on synchronized capture and clear communication to viewers.
- League buyers gain value from football replay systems by separating evidence capture from fan explanation, reinforced by the need to make decisions credible in public. Elite venues also evaluate 3D motion capture for motion analysis and player positioning, which raises expectations for replay precision in close-call situations.
How do buyers evaluate On-premise Servers within deployment?
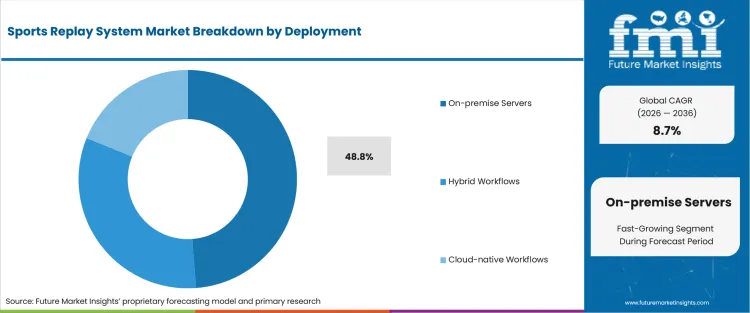
Match-critical review leaves little room for network uncertainty or delayed access to original feeds. Venue crews need capture and playout paths that remain predictable even under crowd pressure, broadcast timing pressure, and official review pressure. On-premise servers remain relevant due to critical decisions needing direct control inside the production environment.
- On-premise Servers are projected to account for 48.8% in 2026, attributable to latency and redundancy requirements in official review. FIFA’s VAR technology guidance permits full VAR systems starting at four cameras. That requirement keeps core replay capture tied to controlled local systems in review-sensitive venues.
- Hybrid workflows add value once official evidence is secured on site, supported by remote clipping and distribution for secondary content teams. LTE and 5G broadcast networks can support wider content movement, but buyers keep decisive review feeds inside controlled production rooms until latency and audit needs are satisfied.
What market factors influence demand from Broadcasters?
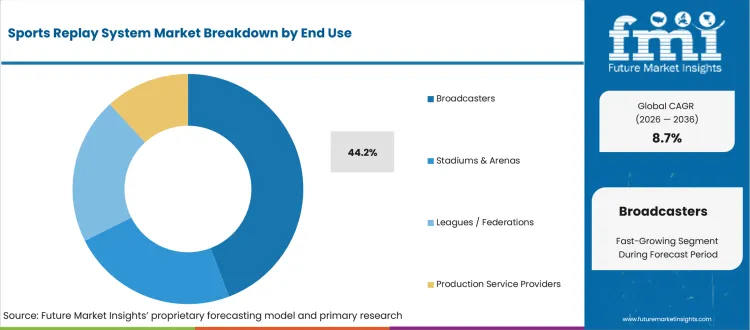
Broadcasters carry the main risk during live coverage due to replay failures becoming visible to viewers immediately. The buyer need extends beyond slow motion. Producers need angle search, sponsor-ready highlight packages, graphics overlays, and archive handoff. Replay is therefore evaluated inside the full live production and streaming media workflow.
- Broadcasters are projected to represent 44.2% of end-use demand in 2026, led by direct control over camera feeds and live programme timing. IOC reporting said Paris 2024 produced more than 308,000 hours on digital platforms. Replay systems gain value once content must move quickly across linear and digital output.
- Broadcast executives benefit from replay systems that can shorten the path between decisive action and reusable clip inventory, supported by better tagging and archive handoff. This matters for rights owners due to shoulder programming, live highlights, and social packages depending on replay material that is ready before attention shifts.
How is System Sale positioned within the sales model?
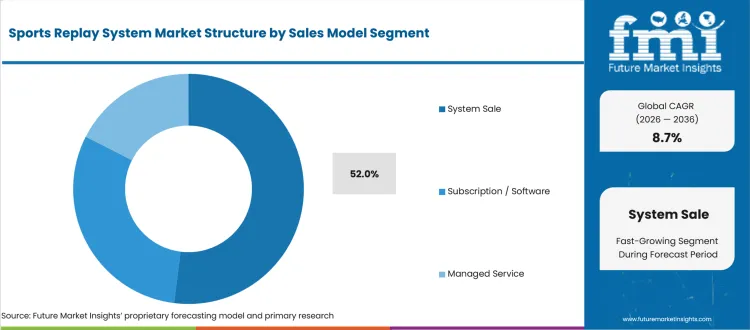
Owned replay infrastructure remains important for venues and outside-broadcast units that run recurring premium events. The purchase decision is shaped by control, service history, spare capacity, and trained operators. Capital buying stays visible due to match-critical systems needing more than temporary access or event-by-event setup.
- System Sale is expected to hold 52.0% share in 2026, shaped by premium venues and trucks that prefer owned replay infrastructure. Grass Valley said in August 2025 that IBC 2025 would showcase live production developments from cinematic cameras to next-generation replay workflows. This keeps ownership attractive for buyers standardizing control rooms.
- Subscription / Software remains useful for seasonal tournaments and smaller leagues, owing to lower permanent hardware needs and easier remote content support. Managed service models also fit buyers that need operators, portable kits, and temporary event coverage without building a full replay department inside each venue.
What are the drivers, restraints, and opportunities in the sports replay system market?
Near-term purchases are being shaped by review-room reliability, operator capacity, and cloud clipping expansion routes outlined below.
- Driver: Rule-grade review is driving replay spending, supported by leagues that need synchronized evidence for officials and clear explanations for viewers.
- Restraint: Operator scarcity restrains adoption, owing to the training needed to find decisive angles under live-match pressure.
- Opportunity: Cloud clipping gains traction from lower-tier leagues and service providers that need highlight output without full truck ownership.
Leagues and broadcasters are buying replay systems to reduce decision risk and protect event timing. IFAB’s 2026 VAR protocol identifies five reviewable match-changing decision categories, which keeps buyer focus on disciplined evidence capture instead of general video recording. Supplier opportunity therefore depends on feed synchronization and operator speed during disputed incidents and broadcast handoffs. It also depends on workflow auditability that lets officials and production crews understand which angle supported the decision before the live programme moves on. For buyers, replay investment moves from optional broadcast polish to an operating control for fairness and sponsor-ready presentation.
Operator pressure is a practical restraint for smaller competitions that cannot staff every match like a premium broadcast. EVS described a sports-climbing example in August 2024 where athletes climb a 15-meter wall in around five seconds, which shows how replay work can depend on split-second judgement. Buyers delay purchases if training and service support are unclear during tender evaluation or match commissioning. This gives suppliers a route to sell simpler panels and managed operators together with remote assistance. The restraint can therefore become a service opportunity for vendors that reduce match-day uncertainty.
Cloud clipping creates an expansion route for leagues that separate official evidence from secondary content production. EVS reported in May 2026 that XtraMotion results are delivered in under three seconds at the push of a button, directly inside the replay operator workflow. That turnaround helps suppliers sell add-on workflows for highlights and social packaging during live coverage. Startups can compete by solving non-critical clip creation for digital content teams at smaller events. Certified review systems remain focused on match decisions and evidence records that preserve referee confidence.
Which country CAGRs are profiled in the sports replay system market?
| Country | CAGR |
|---|---|
| United States | 8.5% |
| United Kingdom | 8.3% |
| Germany | 8.1% |
| France | 7.9% |
| Japan | 7.8% |
| China | 9.6% |
| South Korea | 9.8% |
| India | 10.5% |
How do country-level CAGRs compare in the sports replay system market?
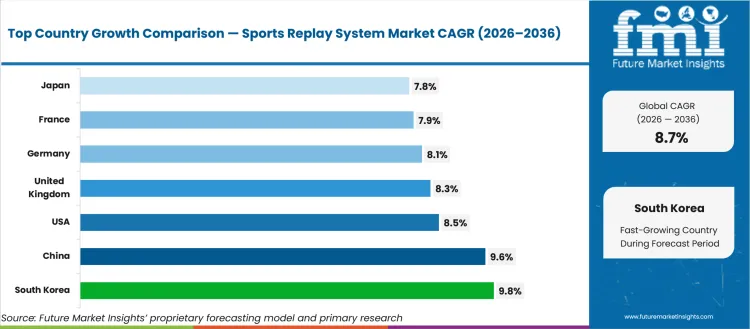
Country-level replay demand should be read by the buyer problem behind each forecast and not only by percentage movement. The United States and Western Europe mainly reflect renewal cycles in established broadcast systems and league review rooms. Japan adds discipline around venue reliability and football governance due to structured sport administration. China and South Korea reflect sports services scale plus large live-event ecosystems that need repeatable replay infrastructure. India reflects public sports funding and cricket review familiarity across a widening event and venue base. For suppliers, this difference shapes whether sales messages emphasize reliability or lower-cost event coverage options. Investors should compare whether demand is tied to rule compliance, rights production or stadium screen use.
- By 2036, the United States is projected to record 8.5% CAGR, driven by college and professional replay expansion. NCAA approved expanded men’s basketball video replay review in June 2024 for foot-inbounds checks on made shots before time expired. This supports demand for review systems that can serve many rule scenarios across venues.
- The United Kingdom is expected to grow at 8.3% CAGR during the forecast period, supported by football review rules and fan-facing decision processes. The FA said in January 2026 that VAR, semi-automated offside, and goal-line technology would return in the 2025-26 Emirates FA Cup. This keeps UK demand tied to formal match technology.
- Over the assessment period, Germany is forecast to advance at 8.1% CAGR, attributable to league discipline and cautious review-system upgrades. DFB said in May 2026 that connected-ball technology would provide ball-contact, speed, flight-path, and rotation data at the DFB-Pokal final. This creates demand for replay systems that can combine video and verified event data.
- Through 2036, France is anticipated to post 7.9% CAGR, reinforced by football review and multi-sport broadcast production. FFF said in March 2026 that VAR would be used for four Coupe de France quarter-final matches. French demand therefore tracks a controlled review environment rather than rapid technology replacement alone.
- Japan is likely to expand at 7.8% CAGR by 2036, shaped by structured football development and dependable venue workflows. JFA’s mid-term planning page says the 2023-2026 plan was formulated to guide projects over four years from 2023. This supports a steadier procurement pattern tied to disciplined implementation and operator readiness.
- China is estimated to rise at 9.6% CAGR between 2026 and 2036, supported by sports-industry scale and multipurpose venue activity. National Bureau of Statistics reported that national sports industry output reached CNY 3.8421 trillion in 2024. Replay suppliers benefit from a broader sports services base and large event-production needs.
- South Korea is projected to record 9.8% CAGR by 2036, influenced by live sports broadcasting and a sizeable sports economy. MCST reported in April 2024 that the sports industry market reached KRW 78.1069 trillion in 2022. This supports replay demand across facilities, services, and sports marketing settings that require dependable production workflows.
- India is expected to grow at 10.5% CAGR during the forecast period, owing to cricket review familiarity and wider sports-system funding. PIB reported in February 2026 that Khelo India received INR 924.35 crore for 2026-27. This gives replay suppliers a growth route across federations, broadcast events and upgraded sports venues.
Who are the notable companies in the sports replay system market?
EVS, Evertz, Grass Valley, Ross Video, Hawk-Eye Innovations, Sportec Solutions, Genius Sports, Vizrt, Chyron, Gravity Media, and NEP Group are the notable companies shaping this market.
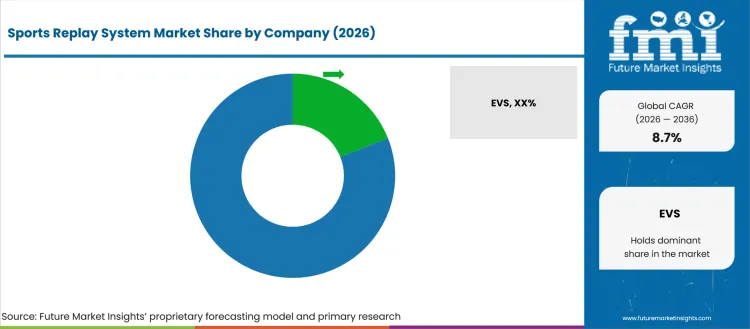
Supplier positioning in sports replay depends on the layer of the live event that the buyer wants to control. EVS, Evertz, Grass Valley, and Ross Video are more relevant for replay servers and live production rooms. Hawk-Eye Innovations, Sportec Solutions, and Genius Sports gain relevance from officiating and evidence workflows. Vizrt and Chyron become important once replay footage must turn into analysis graphics. Gravity Media and NEP Group are relevant for buyers that prefer production service access rather than permanent ownership.
- Replay-server suppliers are relevant for broadcasters that need deterministic ingest, tactile control and fast clip playout. EVS and Evertz focus on server-led replay workflows. Grass Valley and Ross Video add broader production-system fit for venues and trucks that want replay inside the live production stack.
- Official-review specialists gain preference in leagues and federations, driven by the need to align evidence capture with sport rules. Hawk-Eye Innovations provides football officiating technology across VAR, goal-line technology, and semi-automated offside. Sportec Solutions and Genius Sports support data and review environments that connect match operations to broadcast workflows.
- Graphics and analysis suppliers are important after the decisive clip is captured, supported by the need to explain incidents to viewers. Vizrt and Chyron fit buyers that need telestration, scene analysis, and branded replay packages. Their role expands once replay becomes part of commentary and viewer education.
- Production service providers are suited to tournaments and temporary venues, owing to the need for trained crews and mobile infrastructure. Gravity Media and NEP Group help buyers cover events without owning every replay asset. This model fits federations that need professional output during limited competition windows.
Competitive Benchmarking: Sports Replay System Market
| Company | Replay Server Depth | Official Review Fit | Analysis / Graphics Fit | Service Reach |
|---|---|---|---|---|
| EVS | High | Medium | Medium | Global |
| Evertz | High | Medium | Medium | Global |
| Grass Valley | Strong | Medium | Medium | Global |
| Ross Video | Strong | Medium | Strong | Global |
| Hawk-Eye Innovations | Medium | High | Medium | Global |
| Sportec Solutions | Medium | High | Strong | Europe |
| Genius Sports | Medium | Strong | Strong | Global |
| Vizrt | Medium | Medium | High | Global |
| Chyron | Medium | Medium | High | Global |
| Gravity Media | Strong | Medium | Medium | Global |
| NEP Group | Strong | Medium | Medium | Global |
Source: Future Market Insights competitive analysis, 2026. Ratings reflect relative portfolio relevance, workflow or project fit, service capability, and geographic reach.
Key Developments in the Sports Replay System Market
- In September 2025, EVS announced that Gravity Media selected LiveCeption replay for global live productions. The deployment included XT-VIA servers and LSM-VIA replay systems. This is relevant to sports replay buyers due to continued investment in server-led replay workflows for high-pressure international production environments.
- In September 2024, Evertz presented new DreamCatcher BRAVO Studio additions at IBC 2024. The release emphasized ingest, playback, live switching, replays, graphics, and production control. This points to replay platforms becoming wider control-room systems rather than isolated slow-motion tools.
- In August 2025, Grass Valley said IBC 2025 would highlight live production developments from cinematic cameras to next-generation replay workflows. The update is important for replay buyers because camera capture, IP production, and replay control are evaluated together inside modern venue and truck refresh projects.
- In October 2025, Chyron released PAINT 10.2 with SMPTE ST 2110 IP workflow support. The development matters due to sports telestration and replay analysis needing to fit IP production paths. The market implication is clearer integration between replay review, visual explanation, and broadcast branding.
Key Players in the Sports Replay System Market
Replay Server and Live Production Vendors
- EVS
- Evertz
- Grass Valley
- Ross Video
Officiating and Match Data Specialists
- Hawk-Eye Innovations
- Sportec Solutions
- Genius Sports
Analysis and Graphics Vendors
- Vizrt
- Chyron
Production Service Providers
- Gravity Media
- NEP Group
Sports Replay System Market - Report Scope
| Coverage field | Report scope |
|---|---|
| Market breakdown | Sports Replay System Market Breakdown By System Type, Sport Type, Deployment, End Use, Sales Model, and Region |
| Market Definition | Hardware, software, and service platforms that capture live sports feeds and return selected moments for broadcast replay, official review, venue screens, or highlight packaging |
| Regions Covered | North America, Latin America, Europe, East Asia, South Asia and Pacific, Middle East and Africa |
| Countries Covered | United States, United Kingdom, Germany, France, Japan, China, South Korea, India and 30+ countries |
| Key Companies Profiled | EVS, Evertz, Grass Valley, Ross Video, Hawk-Eye Innovations, Sportec Solutions, Genius Sports, Vizrt, Chyron, Gravity Media, NEP Group |
| Forecast Period | 2026 to 2036 |
| Approach | Hybrid bottom-up and top-down methodology using replay system demand, review-room adoption, broadcast workflow needs, service spending, and country-level sports production signals |
Sports Replay System Market - Research Methodology
| Method | Approach |
|---|---|
| Primary Research | FMI analysts reviewed inputs from broadcasters, venue operators, league technology teams, replay operators, systems integrators, and sports technology suppliers. Interviews focused on replacement cycles, match-day risk, latency needs, operator workflow, and pricing differences between server-led, cloud-led, and service-led buying models. |
| Desk Research | Desk research covered official football review protocols, federation technology pages, sports media rights announcements, company product releases, broadcast equipment documentation, and government sports-industry indicators. Source categories were selected to match replay, official review, live production, venue operation, and sports service demand. |
| Market Sizing and Forecasting | The model combined replay server demand, controller and software value, VAR and review-room adoption, cloud clipping subscriptions, managed replay service spend, and country-level sports production indicators. Forecast assumptions were adjusted for broadcast rights activity, venue upgrades, federation budgets, and match-critical review requirements. |
| Data Validation | Forecasts were checked against rules-based review adoption, live production portfolios, sports service output, and company deployment evidence. Duplicate external statistics were removed by assigning each public figure to one article section and reserving repeated internal values only for required market, segment, country, and FAQ references. |
Sports Replay System Market by Segments
Sports Replay System Market segmented by System Type:
- Slow-motion Replay Systems
- Multi-angle Replay Systems
- VAR / Review Systems
- Cloud Replay Platforms
Sports Replay System Market segmented by Sport Type:
- Football / Soccer
- Cricket
- Basketball / Indoor Sports
- Motorsports / Other
Sports Replay System Market segmented by Deployment:
- On-premise Servers
- Hybrid Workflows
- Cloud-native Workflows
Sports Replay System Market segmented by End Use:
- Broadcasters
- Stadiums & Arenas
- Leagues / Federations
- Production Service Providers
Sports Replay System Market segmented by Sales Model:
- System Sale
- Subscription / Software
- Managed Service
Sports Replay System Market by Region:
- North America
- United States
- Canada
- Europe
- Germany
- United Kingdom
- France
- Italy
- Spain
- Asia Pacific
- China
- Japan
- South Korea
- Taiwan
- Singapore
- Latin America
- Brazil
- Mexico
- Argentina
- Middle East & Africa
- GCC Countries
- South Africa
- Israel
Research Sources and Bibliography
- FIFA. (2026, February 17). FIFA Quality Programme for VAR Technology. FIFA.
- FIFA. (2026). Video Assistant Referee Technology. FIFA.
- The International Football Association Board. (2026). Video Assistant Referee (VAR) protocol. IFAB.
- National Collegiate Athletic Association. (2024, January 4). ESPN and NCAA reach new, eight-year media rights agreement. NCAA.
- National Collegiate Athletic Association. (2024, June 6). Expanded video replay review approved for men’s basketball. NCAA.
- National Collegiate Athletic Association. (2025, April 11). Record crowds, rising ratings and resurgent champions highlight 2025 NCAA basketball championships. NCAA.
- International Olympic Committee. (2024, August 3). IOC President praises broadcast operations as Paris 2024 reaches record audiences. IOC.
- Premier League. (2024, August 14). What’s new in 2024/25: Semi-automated offsides. Premier League.
- The Football Association. (2026, January 9). When will VAR be used in the Emirates FA Cup in 2025-26? The FA.
- National Bureau of Statistics of China. (2026, January 1). Announcement on Total Scale and Value-added Data of National Sports Industry in 2024. NBS China.
- Ministry of Culture, Sports and Tourism. (2024, April 9). Sports Industry: Korea’s New Growth Engine. MCST.
- Press Information Bureau. (2026, February 1). Union Budget 2026-27 Announces Launch of Khelo India Sports Science Support Programme. PIB.
- Press Information Bureau. (2026, February 18). India’s Strengthened Sports Ecosystem. PIB.
- Deutscher Fußball-Bund. (2026, May 11). Tradition trifft Innovation: Erstmals Chip im Ball beim DFB-Pokalfinale. DFB.
- Fédération Française de Football. (2026, March 2). Ce qu’il faut savoir avant les quarts. FFF.
- Japan Football Association. (2024). About the JFA Mid-Term Plan for 2023-2026. JFA.
- EVS. (2025, September 13). Gravity Media chooses EVS LiveCeption replay to power global, next-generation live productions. EVS.
- Evertz. (2024, September 5). Evertz Highlights Live Media Solutions at IBC 2024. Evertz.
- Grass Valley. (2025, August 25). Leading the Media Revolution in Live Production. Grass Valley.
- Chyron. (2025, October 21). Chyron PAINT 10.2 Brings IP Workflows and Broadcast-Ready Branding to Sports Telestration. Chyron.
- Hawk-Eye Innovations. (2026). Officiating. Hawk-Eye Innovations.
- Vizrt. (2024, September 3). Vizrt makes sports analysis accessible to all with free version of Viz Libero. Vizrt.
- EVS. (2024, August 9). My sports storytelling adventure as an EVS replay operator. EVS.
- EVS. (2026, May 6). How AI is reshaping live production: what NAB 2026 revealed. EVS.
This bibliography is provided for reader reference and uses primary government, standards-body, official trade body, and company sources.
This Report Answers
- What is the expected global value of the Sports Replay System Market in 2026 and 2036?
- What CAGR is forecast for sports replay systems during the 2026 to 2036 period?
- Which system type is used to assess slow-motion replay system demand in 2026?
- Why do broadcasters and leagues buy replay tools for live production and official review workflows?
- How do on-premise servers shape match-critical replay and review-room reliability?
- Which countries are compared in the Sports Replay System Market forecast?
- Which companies compete across replay servers, officiating systems, graphics, and production services?
- What capabilities are included within the Sports Replay System Market definition?
- How does FMI size and forecast sports replay system demand across segments and countries?
- What implementation and supplier-selection factors should executives assess?
Frequently Asked Questions
What is driving growth in the Sports Replay System Market?
Growth is driven by rule-based review needs and multi-angle production. It is also supported by digital highlight packaging and venue control-room upgrades.
Why should executives track the Sports Replay System Market?
Executives should track this market because replay technology now directly affects match credibility, broadcast quality, fan trust, and the commercial value of sports rights and live events.
What business problem does the Sports Replay System Market address?
It helps leagues, broadcasters, and venues capture and replay decisive moments quickly and accurately, reducing officiating disputes, on air delays, and post match controversy.
What should procurement leaders evaluate before selecting suppliers?
Procurement leaders should evaluate replay latency, multi camera synchronization, operator workflow, certification readiness for official review and long term service support.
What can limit return on investment for buyers?
Return on investment can be limited by operator skill shortages, complex live workflows, or systems that cannot scale from official review to broadcast and highlight production.
How can suppliers build executive confidence?
Suppliers build confidence by proving low latency performance during live matches, delivering certified review workflows, supporting trained operators, and showing how replay assets convert into reusable broadcast and digital content.
Preview the report firsthand - request a free sample
Get SampleGet the brochure for pricing and purchase details.
Get PDFTable of Content
- Key Takeaways
- Market Size and CAGR
- Top Growth Driver
- Fastest Growing Segment
- Leading Region
- Key Companies
- Emerging Opportunities
- Executive Summary
- Global Market Outlook
- Demand-side Trends
- Supply-side Trends
- Technology Roadmap Analysis
- Analysis and Recommendations
- Analyst Perspective (What is happening? Why now? What should investors know?)
- Key Questions Answered
- How large is the market?
- What is the CAGR?
- What are key trends?
- Which region dominates?
- Who are the leaders?
- Market Overview
- Market Coverage / Taxonomy
- Market Definition / Scope / Limitations
- Research Methodology
- Chapter Orientation
- Analytical Lens and Working Hypotheses
- Market Structure, Signals, and Trend Drivers
- Benchmarking and Cross-market Comparability
- Market Sizing, Forecasting, and Opportunity Mapping
- Research Design and Evidence Framework
- Desk Research Programme (Secondary Evidence)
- Expert Input and Fieldwork (Primary Evidence)
- Tooling, Models, and Reference Databases
- Data Engineering and Model Build
- Quality Assurance and Audit Trail
- Market Background
- Market Dynamics (Drivers, Restraints, Opportunity, Trends)
- Scenario Forecast (Optimistic, Likely, Conservative)
- Impact Analysis
- AI Impact
- Sustainability Impact
- Regulatory Impact
- Technology Impact
- Consumer / Buyer Analysis
- Purchase Drivers
- Adoption Barriers
- Buyer Journey
- Opportunity Map Analysis
- Product Life Cycle Analysis
- Supply Chain Analysis
- Investment Feasibility Matrix
- Value Chain Analysis
- PESTLE and Porter's Analysis
- Regulatory Landscape
- Regional Parent Market Outlook
- Production and Consumption Statistics
- Import and Export Statistics
- Global Market Analysis and Forecast, 2021 to 2036
- Historical Market Size Value (USD Billion) & Volume (Unit) Analysis, 2021 to 2025
- Current and Future Market Size Value (USD Billion) & Volume (Unit) Projections, 2026 to 2036
- Y-o-Y Growth Trend Analysis
- Absolute $ Opportunity Analysis
- Global Market Pricing Analysis, 2021 to 2036
- Global Market Analysis and Forecast, By System Type, 2021 to 2036
- Introduction / Key Findings
- Historical Market Size Value (USD Billion) & Volume (Unit) Analysis By System Type, 2021 to 2025
- Current and Future Market Size Value (USD Billion) & Volume (Unit) Analysis and Forecast By System Type, 2026 to 2036
- Slow-motion Replay Systems
- Multi-angle Replay Systems
- Cloud Replay Platforms
- VAR / Review Systems
- Slow-motion Replay Systems
- Y-o-Y Growth Trend Analysis By System Type, 2021 to 2025
- Absolute $ Opportunity Analysis By System Type, 2026 to 2036
- Global Market Analysis and Forecast, By Sport Type, 2021 to 2036
- Introduction / Key Findings
- Historical Market Size Value (USD Billion) & Volume (Unit) Analysis By Sport Type, 2021 to 2025
- Current and Future Market Size Value (USD Billion) & Volume (Unit) Analysis and Forecast By Sport Type, 2026 to 2036
- Football / Soccer
- Basketball / Indoor Sports
- Cricket
- Motorsports / Other
- Football / Soccer
- Y-o-Y Growth Trend Analysis By Sport Type, 2021 to 2025
- Absolute $ Opportunity Analysis By Sport Type, 2026 to 2036
- Global Market Analysis and Forecast, By Deployment, 2021 to 2036
- Introduction / Key Findings
- Historical Market Size Value (USD Billion) & Volume (Unit) Analysis By Deployment, 2021 to 2025
- Current and Future Market Size Value (USD Billion) & Volume (Unit) Analysis and Forecast By Deployment, 2026 to 2036
- On-premise Servers
- Hybrid Workflows
- Cloud-native Workflows
- On-premise Servers
- Y-o-Y Growth Trend Analysis By Deployment, 2021 to 2025
- Absolute $ Opportunity Analysis By Deployment, 2026 to 2036
- Global Market Analysis and Forecast, By End Use, 2021 to 2036
- Introduction / Key Findings
- Historical Market Size Value (USD Billion) & Volume (Unit) Analysis By End Use, 2021 to 2025
- Current and Future Market Size Value (USD Billion) & Volume (Unit) Analysis and Forecast By End Use, 2026 to 2036
- Broadcasters
- Stadiums & Arenas
- Leagues / Federations
- Production Service Providers
- Broadcasters
- Y-o-Y Growth Trend Analysis By End Use, 2021 to 2025
- Absolute $ Opportunity Analysis By End Use, 2026 to 2036
- Global Market Analysis and Forecast, By Sales Model, 2021 to 2036
- Introduction / Key Findings
- Historical Market Size Value (USD Billion) & Volume (Unit) Analysis By Sales Model, 2021 to 2025
- Current and Future Market Size Value (USD Billion) & Volume (Unit) Analysis and Forecast By Sales Model, 2026 to 2036
- System Sale
- Subscription / Software
- Managed Service
- System Sale
- Y-o-Y Growth Trend Analysis By Sales Model, 2021 to 2025
- Absolute $ Opportunity Analysis By Sales Model, 2026 to 2036
- Global Market Analysis and Forecast, By Region, 2021 to 2036
- Introduction
- Historical Market Size Value (USD Billion) & Volume (Unit) Analysis By Region, 2021 to 2025
- Current Market Size Value (USD Billion) & Volume (Unit) Analysis and Forecast By Region, 2026 to 2036
- North America
- Latin America
- Western Europe
- Eastern Europe
- East Asia
- South Asia and Pacific
- Middle East & Africa
- Market Attractiveness Analysis By Region
- North America Market Analysis and Forecast, By Country, 2021 to 2036
- Historical Market Size Value (USD Billion) & Volume (Unit) Trend Analysis By Market Taxonomy, 2021 to 2025
- Market Size Value (USD Billion) & Volume (Unit) Forecast By Market Taxonomy, 2026 to 2036
- By Country
- USA
- Canada
- Mexico
- By System Type
- By Sport Type
- By Deployment
- By End Use
- By Sales Model
- By Country
- Market Attractiveness Analysis
- By Country
- By System Type
- By Sport Type
- By Deployment
- By End Use
- By Sales Model
- Key Takeaways
- Latin America Market Analysis and Forecast, By Country
- Historical Market Size Value (USD Billion) & Volume (Unit) Trend Analysis By Market Taxonomy, 2021 to 2025
- Market Size Value (USD Billion) & Volume (Unit) Forecast By Market Taxonomy, 2026 to 2036
- By Country
- Brazil
- Chile
- Rest of Latin America
- By System Type
- By Sport Type
- By Deployment
- By End Use
- By Sales Model
- By Country
- Market Attractiveness Analysis
- By Country
- By System Type
- By Sport Type
- By Deployment
- By End Use
- By Sales Model
- Key Takeaways
- Western Europe Market Analysis and Forecast, By Country
- Historical Market Size Value (USD Billion) & Volume (Unit) Trend Analysis By Market Taxonomy, 2021 to 2025
- Market Size Value (USD Billion) & Volume (Unit) Forecast By Market Taxonomy, 2026 to 2036
- By Country
- Germany
- UK
- Italy
- Spain
- France
- Nordic
- BENELUX
- Rest of Western Europe
- By System Type
- By Sport Type
- By Deployment
- By End Use
- By Sales Model
- By Country
- Market Attractiveness Analysis
- By Country
- By System Type
- By Sport Type
- By Deployment
- By End Use
- By Sales Model
- Key Takeaways
- Eastern Europe Market Analysis and Forecast, By Country
- Historical Market Size Value (USD Billion) & Volume (Unit) Trend Analysis By Market Taxonomy, 2021 to 2025
- Market Size Value (USD Billion) & Volume (Unit) Forecast By Market Taxonomy, 2026 to 2036
- By Country
- Russia
- Poland
- Hungary
- Balkan & Baltic
- Rest of Eastern Europe
- By System Type
- By Sport Type
- By Deployment
- By End Use
- By Sales Model
- By Country
- Market Attractiveness Analysis
- By Country
- By System Type
- By Sport Type
- By Deployment
- By End Use
- By Sales Model
- Key Takeaways
- East Asia Market Analysis and Forecast, By Country
- Historical Market Size Value (USD Billion) & Volume (Unit) Trend Analysis By Market Taxonomy, 2021 to 2025
- Market Size Value (USD Billion) & Volume (Unit) Forecast By Market Taxonomy, 2026 to 2036
- By Country
- China
- Japan
- South Korea
- By System Type
- By Sport Type
- By Deployment
- By End Use
- By Sales Model
- By Country
- Market Attractiveness Analysis
- By Country
- By System Type
- By Sport Type
- By Deployment
- By End Use
- By Sales Model
- Key Takeaways
- South Asia and Pacific Market Analysis and Forecast, By Country
- Historical Market Size Value (USD Billion) & Volume (Unit) Trend Analysis By Market Taxonomy, 2021 to 2025
- Market Size Value (USD Billion) & Volume (Unit) Forecast By Market Taxonomy, 2026 to 2036
- By Country
- India
- ASEAN
- Australia & New Zealand
- Rest of South Asia and Pacific
- By System Type
- By Sport Type
- By Deployment
- By End Use
- By Sales Model
- By Country
- Market Attractiveness Analysis
- By Country
- By System Type
- By Sport Type
- By Deployment
- By End Use
- By Sales Model
- Key Takeaways
- Middle East & Africa Market Analysis and Forecast, By Country
- Historical Market Size Value (USD Billion) & Volume (Unit) Trend Analysis By Market Taxonomy, 2021 to 2025
- Market Size Value (USD Billion) & Volume (Unit) Forecast By Market Taxonomy, 2026 to 2036
- By Country
- Kingdom of Saudi Arabia
- Other GCC Countries
- Türkiye
- South Africa
- Other African Union
- Rest of Middle East & Africa
- By System Type
- By Sport Type
- By Deployment
- By End Use
- By Sales Model
- By Country
- Market Attractiveness Analysis
- By Country
- By System Type
- By Sport Type
- By Deployment
- By End Use
- By Sales Model
- Key Takeaways
- Key Countries Market Analysis
- USA
- Pricing Analysis
- Market Share Analysis, 2025
- By System Type
- By Sport Type
- By Deployment
- By End Use
- By Sales Model
- Canada
- Pricing Analysis
- Market Share Analysis, 2025
- By System Type
- By Sport Type
- By Deployment
- By End Use
- By Sales Model
- Mexico
- Pricing Analysis
- Market Share Analysis, 2025
- By System Type
- By Sport Type
- By Deployment
- By End Use
- By Sales Model
- Brazil
- Pricing Analysis
- Market Share Analysis, 2025
- By System Type
- By Sport Type
- By Deployment
- By End Use
- By Sales Model
- Chile
- Pricing Analysis
- Market Share Analysis, 2025
- By System Type
- By Sport Type
- By Deployment
- By End Use
- By Sales Model
- Germany
- Pricing Analysis
- Market Share Analysis, 2025
- By System Type
- By Sport Type
- By Deployment
- By End Use
- By Sales Model
- UK
- Pricing Analysis
- Market Share Analysis, 2025
- By System Type
- By Sport Type
- By Deployment
- By End Use
- By Sales Model
- Italy
- Pricing Analysis
- Market Share Analysis, 2025
- By System Type
- By Sport Type
- By Deployment
- By End Use
- By Sales Model
- Spain
- Pricing Analysis
- Market Share Analysis, 2025
- By System Type
- By Sport Type
- By Deployment
- By End Use
- By Sales Model
- France
- Pricing Analysis
- Market Share Analysis, 2025
- By System Type
- By Sport Type
- By Deployment
- By End Use
- By Sales Model
- India
- Pricing Analysis
- Market Share Analysis, 2025
- By System Type
- By Sport Type
- By Deployment
- By End Use
- By Sales Model
- ASEAN
- Pricing Analysis
- Market Share Analysis, 2025
- By System Type
- By Sport Type
- By Deployment
- By End Use
- By Sales Model
- Australia & New Zealand
- Pricing Analysis
- Market Share Analysis, 2025
- By System Type
- By Sport Type
- By Deployment
- By End Use
- By Sales Model
- China
- Pricing Analysis
- Market Share Analysis, 2025
- By System Type
- By Sport Type
- By Deployment
- By End Use
- By Sales Model
- Japan
- Pricing Analysis
- Market Share Analysis, 2025
- By System Type
- By Sport Type
- By Deployment
- By End Use
- By Sales Model
- South Korea
- Pricing Analysis
- Market Share Analysis, 2025
- By System Type
- By Sport Type
- By Deployment
- By End Use
- By Sales Model
- Russia
- Pricing Analysis
- Market Share Analysis, 2025
- By System Type
- By Sport Type
- By Deployment
- By End Use
- By Sales Model
- Poland
- Pricing Analysis
- Market Share Analysis, 2025
- By System Type
- By Sport Type
- By Deployment
- By End Use
- By Sales Model
- Hungary
- Pricing Analysis
- Market Share Analysis, 2025
- By System Type
- By Sport Type
- By Deployment
- By End Use
- By Sales Model
- Kingdom of Saudi Arabia
- Pricing Analysis
- Market Share Analysis, 2025
- By System Type
- By Sport Type
- By Deployment
- By End Use
- By Sales Model
- Türkiye
- Pricing Analysis
- Market Share Analysis, 2025
- By System Type
- By Sport Type
- By Deployment
- By End Use
- By Sales Model
- South Africa
- Pricing Analysis
- Market Share Analysis, 2025
- By System Type
- By Sport Type
- By Deployment
- By End Use
- By Sales Model
- USA
- Market Structure Analysis
- Competition Dashboard
- Competition Benchmarking
- Market Share Analysis of Top Players
- By Regional
- By System Type
- By Sport Type
- By Deployment
- By End Use
- By Sales Model
- Emerging Startups
- Innovation Benchmarking
- Competition Analysis
- Competition Deep Dive
- EVS
- Overview
- Product Portfolio
- Profitability by Market Segments (Product/Region/Sales Channel)
- Sales Footprint
- Strategy Overview
- Marketing Strategy
- Product Strategy
- Channel Strategy
- Evertz
- Grass Valley
- Ross Video
- Vizrt
- Chyron
- EVS
- Case Studies
- Success Stories
- Recent Developments
- Competition Deep Dive
- Assumptions & Acronyms Used


