Stool Management System Market Size and Share Forecast Outlook 2025 to 2035

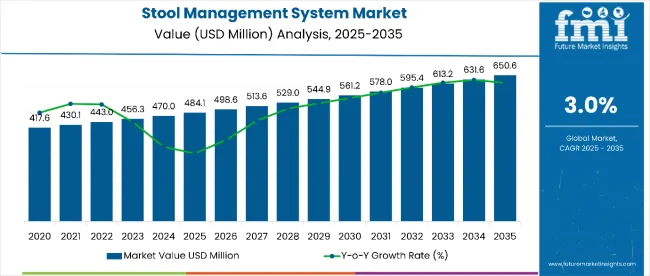
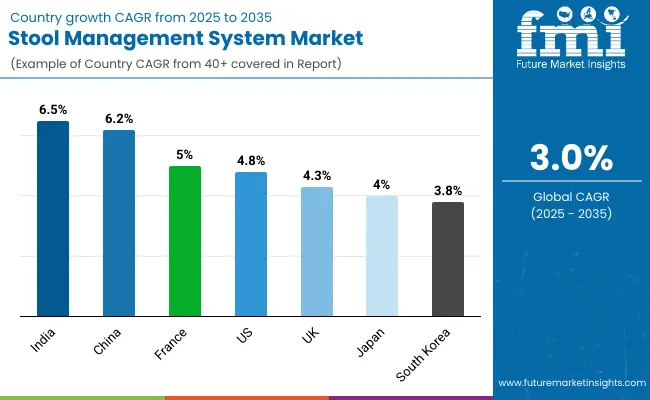
The stool management system market is expected to be valued at USD 484.1 million in 2025. It is projected to reach USD 650.6 million by 2035, growing at a moderate compound annual growth rate (CAGR) of 3.0% during the forecast period. Among regional markets, India is forecasted to be the fastest-growing with a CAGR of 6.5%, driven by an expanding patient population and improvements in healthcare infrastructure.

North America, meanwhile, is projected to maintain its position as the largest revenue-contributing region, supported by advanced clinical practices, high healthcare spending, and robust reimbursement frameworks. Growing awareness campaigns around bowel health, along with increased training of caregivers and medical staff, are also catalyzing adoption across both institutional and home-care settings. Additionally, the expansion of telehealth services and digital monitoring tools is expected to complement device usage and improve patient compliance.

Stool Management Systems Market

Attributes Key Statistics
Estimated Stool Management System Market Value (2025) USD 484.1 million
Forecasted Market Value (2035) USD 650.6 million
Projected Growth Rate (2025 to 2035) 3.0%

Growth in this market is primarily driven by the rising prevalence of fecal incontinence, especially among patients with neurological disorders such as Parkinson’s disease, multiple sclerosis, and spinal cord injuries. The global rise in the aging population, which is more vulnerable to bowel dysfunction, further propels demand.

Increasing awareness of bowel hygiene, the availability of non-invasive treatment options, and enhanced clinical protocols are creating favorable conditions for adoption across hospitals, home care settings, and long-term care facilities. However, high costs associated with advanced stool management devices and the continued dependence on traditional bowel care methods, including pharmaceuticals and dietary adjustments, remain key challenges.

Between 2025 and 2035, the market is expected to grow steadily but competitively, with a clear shift toward user-friendly, patient-centric solutions. Innovations are anticipated in areas such as leak prevention, skin-friendly adhesives, and smart monitoring systems.

Emerging economies will play a pivotal role, bolstered by increasing access to healthcare and pro-medtech policies. As the industry evolves, companies are likely to invest in cost-efficient production, personalized product design, and integrated digital tools to enhance product performance, patient compliance, and long-term adoption across global healthcare ecosystems.

Clinical Breakthroughs in Stool Management Systems

Fecal management systems deliver measurable reductions in skin complications, nursing workload, and overall care costs when used within defined protocols. Evidence from recent studies underscores their role in improving outcomes for high‑risk patients in critical care settings.

  • A 2023 study in Indian Journal of Critical Care Medicine showed a lattice‑based indwelling device lowered IAD incidence, resource use, and costs versus adult diapers, with no adverse events.
  • A 2024 network meta‑analysis of 14 randomized trials confirmed anal bags and balloon catheters reduce moderate‑to‑severe IAD compared to standard care, with negative‑pressure variants ranking highest.
  • Trials have documented nurse satisfaction gains and cost savings of approximately USD 3,100-USD 3,400 per 29 days versus usual care, though pressure‑ulcer prevention remains inconsistent.
  • Updated NHS guidance (2023) supports use for infection control, deodorizing filters, and fluid balance tracking, while enforcing a 29‑day dwell limit and standardized irrigation and sampling protocols.

Risks, Complications, and Safe Protocols for Stool Management Systems

Clinical evidence shows that product design alone does not guarantee safer outcomes; disciplined protocols and monitoring are critical to avoid serious complications in FMS use.

  • Case reports and reviews document rectal ulcers and gastrointestinal bleeding, often tied to over‑inflation.
  • Strict indication control, pressure monitoring, and trained staff are essential safeguards, while transanal irrigation systems like Peristeen (endorsed by NICE and covered under CMS) provide structured alternatives for non‑ICU bowel management.

Heat Map For Stool Management Systems Market

Analyzing Stool Management System Market by Top Investment Segments

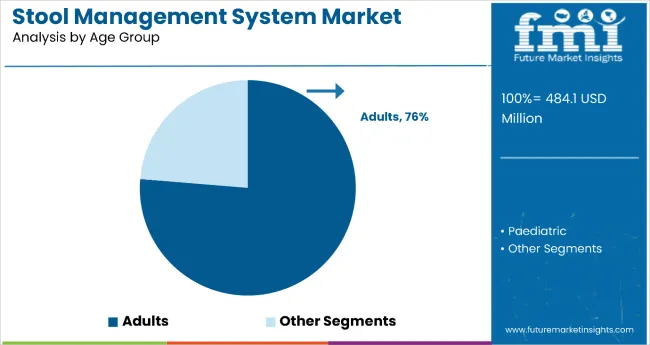
By Age Group, the Adults Segment Accounts for 76.3% of the Market Share

Stool Management Systems Market Analysis By Age Group

Adults hold the dominant position with 76.3% of the market share in the age group category within the stool management system market. This leadership is driven by the aging population and the significantly higher prevalence of fecal incontinence among adults, particularly those aged 45 and above who are more susceptible to chronic conditions such as colorectal cancer, spinal cord injuries, and neurological disorders including Parkinson's disease and multiple sclerosis. The adult segment benefits from greater awareness, accessibility to advanced medical devices, and wider insurance coverage for fecal management solutions.

The segment's dominance is reinforced by adults' higher product adoption rates compared to pediatric patients, as well as the increasing geriatric population globally in countries like Japan, China, and Germany. Chronic health conditions, pelvic floor dysfunction, and gastrointestinal diseases disproportionately affect the adult population, creating sustained demand for effective stool management solutions. As the global population continues to age and the prevalence of conditions requiring bowel management increases, the adult segment is positioned to maintain its market leadership through continued innovation in comfort, efficacy, and patient-centered care solutions.

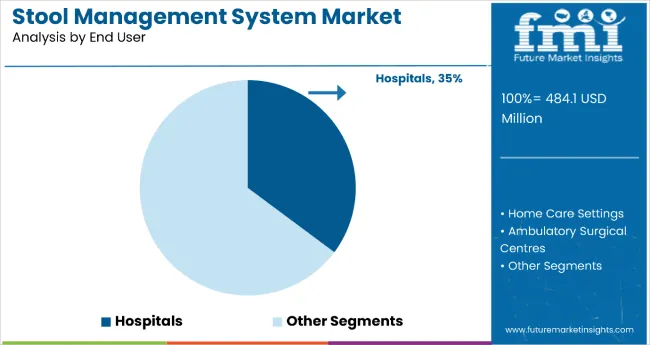
By End User, the Hospitals Segment Accounts for 35.2% of the Market Share

Stool Management Systems Market Analysis By End User

Hospitals dominate the stool management system market with 35.2% of the market share in the end user category. This leadership is attributed to hospitals serving as the primary point of care for patients requiring advanced bowel management, particularly following surgeries, traumatic injuries, or during critical care situations. Hospitals are equipped to handle complex cases involving stoma care, transanal irrigation, and post-operative bowel dysfunction, making them the primary hub for device adoption and utilization.

The segment's dominance is reinforced by hospitals' enhanced infection control measures, availability of reimbursement frameworks, and preference for clinical-grade stool management systems that meet stringent healthcare standards. Centralized procurement processes and bulk purchasing agreements further strengthen hospitals' position as the leading consumer segment in this market. As healthcare facilities continue to prioritize patient safety, hygiene protocols, and clinical outcomes, the hospitals segment is expected to maintain its leading position through continued investment in advanced stool management technologies that support comprehensive patient care and institutional efficiency requirements.

Adoption Analysis of Stool Management Systems

  • The global healthcare sector, particularly hospitals, nursing homes, and other healthcare facilities, is increasingly adopting stool management systems to provide patients with bowel management care.
  • Sales of stool management systems are also growing among patients with chronic conditions such as spinal cord injuries, multiple sclerosis, or neurological disorders that cause fecal incontinence.
  • Stool management systems are also experiencing increasing demand from caregivers and healthcare professionals who provide support and treatment to patients with bowel management needs.
  • Medical supply companies and distributors are also among the prime consumers, as they supply stool management systems to healthcare facilities and consumers.
  • The growing adoption of stool management systems is also observed in government agencies, insurance companies, and healthcare organizations involved in financing and reimbursement.

Restraining Factors Adversely Affecting the Stool Management System Market

The stool management system market is anticipated to surpass a valuation of USD 650.6 million by 2035, exhibiting a 3.0% CAGR. While the market is expected to experience remarkable growth, several restraining factors could adversely affect its development:

  • Despite advancements in medical technology and the efforts of various healthcare facilities, both public and private, to promote effective stool management systems, a lack of awareness among healthcare professionals and patients regarding the benefits of these systems remains, hindering widespread adoption.
  • Advanced and sophisticated stool management systems, such as implantable neuromodulation devices or smart wearable sensors, are comparatively very expensive. This keeps a substantial number of potential consumers away from the market.
  • Stool management systems often face rigorous competition from alternative bowel management strategies, including pharmaceuticals, dietary interventions, and traditional methods. This diverts patients suffering from bowel-associated disorders to other products and processes, adversely affecting market growth.

Country-wise Insights

The section provides an analysis of the stool management system market by country, including India, China, and the United Kingdom. The table presents the CAGR for each country, indicating the expected growth of the market in that country through 2035.

Country Wise Analysis Of Stool Management Systems Market

Countries Forecasted CAGR from 2025 to 2035
India 6.50%
China 6.20%
The United Kingdom 4.30%

Stool Management System Market in India

India leads the market for stool management systems. Over the next ten years, the demand for stool management systems in this country is projected to increase at a 6.50% compound annual growth rate (CAGR).

According to an NCBI article, it is estimated that in 2023, 153,020 people will be diagnosed with colorectal cancer in India. This number is further expected to rise due to multiple reasons, such as increasing obesity rates, tobacco and alcohol consumption, changing lifestyle and dietary habits, etc.

This has significantly increased the demand for stool management systems in India as healthcare providers seek effective solutions to address the needs of patients undergoing treatment.

Stool Management System Market in China

China is also one of the leading countries in this market. The stool management system market in China is expected to maintain its dominance, growing at a compound annual growth rate (CAGR) of 6.20% through 2035.

China, like many other leading countries in this market, is facing the challenge of a rapidly aging population. The geriatric population is more prone to colorectal cancer and other conditions requiring ostomy surgery.

This has prompted healthcare facilities in China to adopt modern stool management systems in hospitals, clinics, and ambulatory surgical centers, driving market growth. Additionally, government initiatives to improve access to healthcare services are another key reason for the development of stool management systems in the country.

Stool Management System Market in the United Kingdom

The United Kingdom also holds a significant position in the stool management system market. The stool management system industry in the United Kingdom is expected to maintain its dominance, progressing at a CAGR of 4.30% between 2025 and 2035.

The United Kingdom benefits from a robust healthcare sector, with the government investing a substantial part of its GDP in the industry.

This investment has led to the development of advanced clinics, healthcare facilities, and ambulatory surgical centers in the country, making the adoption of stool management systems, such as advanced colostomy and ileostomy bags, rectal irrigation systems, and ostomy care accessories, feasible.

Competitive Landscape

Stool Management Systems Market Analysis By Company

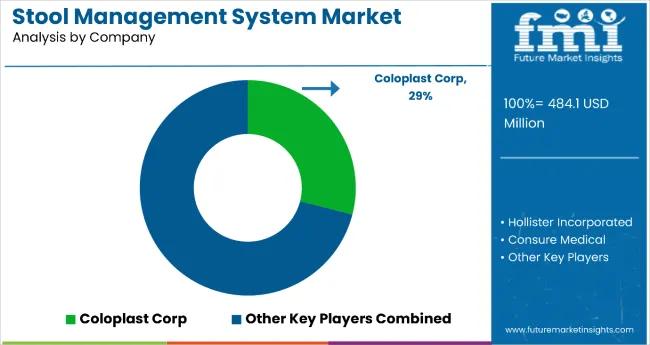
The stool management system market is highly competitive, with numerous companies supplying stool management systems, including advanced colostomy and ileostomy bags, rectal irrigation systems, and ostomy care accessories, to hospitals, clinics, rehabilitation centers, and other healthcare facilities.

Some of the prominent companies in this market are Convatec Group PLC, Hollister Incorporated, Coloplast Group, B. Braun Melsungen AG, C.R. Bard (Becton, Dickinson, and Company), Welland Medical Limited, Salts Healthcare Ltd., and 3M Company, etc.

These companies have a strong foothold in the market due to their widespread reach and robust research and development teams.

Recent Developments:

  • In February 2022, Coloplast introduced SenSura® Mio in Singapore, a pioneering stoma care technology featuring BodyFit innovation, aiming to enhance the lives of ostomates. This marked a significant advancement in ostomy management for individuals recovering from severe illnesses or injuries.
  • In May 2023, Creative Balloons GmbH was rebranded to Advanced Medical Balloons GmbH, and its fecal management system, Hygh-tec, was introduced to the United States market following FDA clearance. The system featured a microscopically thin polyurethane balloon catheter, ensuring sealed access to the colon and preventing fecal leakage in ICU patients.
  • In January 2023, OstomyCure achieved a significant milestone by completing patient recruitment for its TIES implant trial. Twenty patients received the innovative technology, paving the way for forthcoming EU regulatory submissions for a CE Mark.

Key Companies in the Market

  • Coloplast A/S
  • Hollister Incorporated
  • ConvaTec Group PLC
  • B. Braun Melsungen AG
  • C.R. Bard, Inc. (A subsidiary of BD)
  • 3M Healthcare
  • Salts Healthcare Ltd.
  • Marlen Manufacturing & Development Co.
  • Welland Medical Limited
  • Torbot Group, Inc.
  • Dansac
  • Flexicare Medical Limited
  • Genairex, Inc.
  • Smith & Nephew plc
  • EuroMed Inc.
  • Pelican Healthcare Ltd.
  • Hollister Ostomy Care
  • Nu-Hope Laboratories, Inc.
  • Parthenon Company Inc.
  • Peak Medical Ltd.

Key Coverage in the Stool Management System Industry Report

  • Key Trends in Faecal Management Systems
  • Competitive Overview of Stool Management System in China
  • Applications of Stool Management Kit in Healthcare System
  • Top 10 Effective Bowel Management Strategies for Spinal Cord Injury
  • Opportunity Analysis of Evidence-based Bowel Management Nursing Care Plan
  • Potential of Diarrhea Management in Hospital Settings

Report Coverage for Stool Management System Market

Report Attributes Details
Current Total Market Size (2025) USD 484.1 million
Projected Market Size (2035) USD 650.6 million
Overall Market CAGR (2025 to 2035) 3.0%
Base Year for Estimation 2025
Historical Period 2020 to 2024
Projections Period 2025 to 2035
Report Parameter Revenue in USD million
By Product Transanal Irrigation Systems (Mini Devices, Cone Devices, Balloon Catheter Devices, Bed Systems), Stoma Bags (Colostomy Bags, Ileostomy Bags, Urostomy Bags)
By Age Group Paediatric, Adults
By End User Hospitals, Ambulatory Surgical Centres, Home Care Settings, Long-Term Care Centres
Regions Covered North America, Latin America, Western Europe, Eastern Europe, South Asia and Pacific, East Asia, Middle East and Africa
Countries Covered United States, Canada, Germany, United Kingdom, France, China, India, Japan, South Korea, Australia
Key Players Hollister Incorporated, Coloplast Corp, Consure Medical, ProSys International Ltd., CliniMed Limited, Medical Technologies of Georgia, ConvaTec Inc., B. Braun Medical Ltd, Nu-Hope Laboratories, Inc., Qufora A/S
Customization and Pricing Available upon request

Market Segmentation of Stool Management System

By Product:

  • Transanal Irrigation Systems
    • Mini Devices
    • Cone Devices
    • Balloon Catheter Devices
    • Bed Systems
  • Stoma Bags
    • Colostomy Bags
    • Ileostomy Bags
    • Urostomy Bags

By Age Group:

  • Pediatric
  • Adults

By End User:

  • Hospitals
  • Ambulatory Surgical Centres
  • Home Care Settings
  • Long-term Care Centres

By Region:

  • North America
  • Latin America
  • Asia Pacific
  • Middle East and Africa (MEA)
  • Europe

Table of Content

  1. Executive Summary
  2. Market Overview
  3. Market Background
  4. Global Market Analysis 2020 to 2024 and Forecast, 2025 to 2035
  5. Global Market Analysis 2020 to 2024 and Forecast 2025 to 2035, By Product
    • Transanal Irrigation Systems
      • Mini Devices
      • Cone Devices
      • Balloon Catheter Devices
      • Bed Systems
    • Stoma Bags
      • Colostomy Bags
      • Ileostomy Bags
      • Urostomy Bags
  6. Global Market Analysis 2020 to 2024 and Forecast 2025 to 2035, By Age Group
    • Paediatric
    • Adults
  7. Global Market Analysis 2020 to 2024 and Forecast 2025 to 2035, By End User
    • Hospitals
    • Ambulatory Surgical Centres
    • Home Care Settings
    • Long-Term Care Centres
  8. Global Market Analysis 2020 to 2024 and Forecast 2025 to 2035, By Region
    • North America
    • Latin America
    • Western Europe
    • Eastern Europe
    • South Asia and Pacific
    • East Asia
    • Middle East and Africa
  9. North America Market Analysis 2020 to 2024 and Forecast 2025 to 2035, By Country
  10. Latin America Market Analysis 2020 to 2024 and Forecast 2025 to 2035, By Country
  11. Western Europe Market Analysis 2020 to 2024 and Forecast 2025 to 2035, By Country
  12. Eastern Europe Market Analysis 2020 to 2024 and Forecast 2025 to 2035, By Country
  13. South Asia and Pacific Market Analysis 2020 to 2024 and Forecast 2025 to 2035, By Country
  14. East Asia Market Analysis 2020 to 2024 and Forecast 2025 to 2035, By Country
  15. Middle East and Africa Market Analysis 2020 to 2024 and Forecast 2025 to 2035, By Country
  16. Key Countries Market Analysis
  17. Market Structure Analysis
  18. Competition Analysis
    • Hollister Incorporated
    • Coloplast Corp
    • Consure Medical
    • ProSys International Ltd.
    • CliniMed Limited
    • Medical Technologies of Georgia
    • ConvaTec Inc.
    • B. Braun Medical Ltd
    • Nu-Hope Laboratories, Inc.
    • Qufora A/S
  19. Assumptions & Acronyms Used
  20. Research Methodology

List of Tables

Table 1: Global Market Value (US$ Million) Forecast by Region, 2019 to 2034

Table 2: Global Market Volume (Units) Forecast by Region, 2019 to 2034

Table 3: Global Market Value (US$ Million) Forecast by Product, 2019 to 2034

Table 4: Global Market Volume (Units) Forecast by Product, 2019 to 2034

Table 5: Global Market Value (US$ Million) Forecast by Age Group, 2019 to 2034

Table 6: Global Market Volume (Units) Forecast by Age Group, 2019 to 2034

Table 7: Global Market Value (US$ Million) Forecast by End User, 2019 to 2034

Table 8: Global Market Volume (Units) Forecast by End User, 2019 to 2034

Table 9: North America Market Value (US$ Million) Forecast by Country, 2019 to 2034

Table 10: North America Market Volume (Units) Forecast by Country, 2019 to 2034

Table 11: North America Market Value (US$ Million) Forecast by Product, 2019 to 2034

Table 12: North America Market Volume (Units) Forecast by Product, 2019 to 2034

Table 13: North America Market Value (US$ Million) Forecast by Age Group, 2019 to 2034

Table 14: North America Market Volume (Units) Forecast by Age Group, 2019 to 2034

Table 15: North America Market Value (US$ Million) Forecast by End User, 2019 to 2034

Table 16: North America Market Volume (Units) Forecast by End User, 2019 to 2034

Table 17: Latin America Market Value (US$ Million) Forecast by Country, 2019 to 2034

Table 18: Latin America Market Volume (Units) Forecast by Country, 2019 to 2034

Table 19: Latin America Market Value (US$ Million) Forecast by Product, 2019 to 2034

Table 20: Latin America Market Volume (Units) Forecast by Product, 2019 to 2034

Table 21: Latin America Market Value (US$ Million) Forecast by Age Group, 2019 to 2034

Table 22: Latin America Market Volume (Units) Forecast by Age Group, 2019 to 2034

Table 23: Latin America Market Value (US$ Million) Forecast by End User, 2019 to 2034

Table 24: Latin America Market Volume (Units) Forecast by End User, 2019 to 2034

Table 25: Western Europe Market Value (US$ Million) Forecast by Country, 2019 to 2034

Table 26: Western Europe Market Volume (Units) Forecast by Country, 2019 to 2034

Table 27: Western Europe Market Value (US$ Million) Forecast by Product, 2019 to 2034

Table 28: Western Europe Market Volume (Units) Forecast by Product, 2019 to 2034

Table 29: Western Europe Market Value (US$ Million) Forecast by Age Group, 2019 to 2034

Table 30: Western Europe Market Volume (Units) Forecast by Age Group, 2019 to 2034

Table 31: Western Europe Market Value (US$ Million) Forecast by End User, 2019 to 2034

Table 32: Western Europe Market Volume (Units) Forecast by End User, 2019 to 2034

Table 33: Eastern Europe Market Value (US$ Million) Forecast by Country, 2019 to 2034

Table 34: Eastern Europe Market Volume (Units) Forecast by Country, 2019 to 2034

Table 35: Eastern Europe Market Value (US$ Million) Forecast by Product, 2019 to 2034

Table 36: Eastern Europe Market Volume (Units) Forecast by Product, 2019 to 2034

Table 37: Eastern Europe Market Value (US$ Million) Forecast by Age Group, 2019 to 2034

Table 38: Eastern Europe Market Volume (Units) Forecast by Age Group, 2019 to 2034

Table 39: Eastern Europe Market Value (US$ Million) Forecast by End User, 2019 to 2034

Table 40: Eastern Europe Market Volume (Units) Forecast by End User, 2019 to 2034

Table 41: South Asia and Pacific Market Value (US$ Million) Forecast by Country, 2019 to 2034

Table 42: South Asia and Pacific Market Volume (Units) Forecast by Country, 2019 to 2034

Table 43: South Asia and Pacific Market Value (US$ Million) Forecast by Product, 2019 to 2034

Table 44: South Asia and Pacific Market Volume (Units) Forecast by Product, 2019 to 2034

Table 45: South Asia and Pacific Market Value (US$ Million) Forecast by Age Group, 2019 to 2034

Table 46: South Asia and Pacific Market Volume (Units) Forecast by Age Group, 2019 to 2034

Table 47: South Asia and Pacific Market Value (US$ Million) Forecast by End User, 2019 to 2034

Table 48: South Asia and Pacific Market Volume (Units) Forecast by End User, 2019 to 2034

Table 49: East Asia Market Value (US$ Million) Forecast by Country, 2019 to 2034

Table 50: East Asia Market Volume (Units) Forecast by Country, 2019 to 2034

Table 51: East Asia Market Value (US$ Million) Forecast by Product, 2019 to 2034

Table 52: East Asia Market Volume (Units) Forecast by Product, 2019 to 2034

Table 53: East Asia Market Value (US$ Million) Forecast by Age Group, 2019 to 2034

Table 54: East Asia Market Volume (Units) Forecast by Age Group, 2019 to 2034

Table 55: East Asia Market Value (US$ Million) Forecast by End User, 2019 to 2034

Table 56: East Asia Market Volume (Units) Forecast by End User, 2019 to 2034

Table 57: Middle East and Africa Market Value (US$ Million) Forecast by Country, 2019 to 2034

Table 58: Middle East and Africa Market Volume (Units) Forecast by Country, 2019 to 2034

Table 59: Middle East and Africa Market Value (US$ Million) Forecast by Product, 2019 to 2034

Table 60: Middle East and Africa Market Volume (Units) Forecast by Product, 2019 to 2034

Table 61: Middle East and Africa Market Value (US$ Million) Forecast by Age Group, 2019 to 2034

Table 62: Middle East and Africa Market Volume (Units) Forecast by Age Group, 2019 to 2034

Table 63: Middle East and Africa Market Value (US$ Million) Forecast by End User, 2019 to 2034

Table 64: Middle East and Africa Market Volume (Units) Forecast by End User, 2019 to 2034

List of Figures

Figure 1: Global Market Value (US$ Million) by Product, 2024 to 2034

Figure 2: Global Market Value (US$ Million) by Age Group, 2024 to 2034

Figure 3: Global Market Value (US$ Million) by End User, 2024 to 2034

Figure 4: Global Market Value (US$ Million) by Region, 2024 to 2034

Figure 5: Global Market Value (US$ Million) Analysis by Region, 2019 to 2034

Figure 6: Global Market Volume (Units) Analysis by Region, 2019 to 2034

Figure 7: Global Market Value Share (%) and BPS Analysis by Region, 2024 to 2034

Figure 8: Global Market Y-o-Y Growth (%) Projections by Region, 2024 to 2034

Figure 9: Global Market Value (US$ Million) Analysis by Product, 2019 to 2034

Figure 10: Global Market Volume (Units) Analysis by Product, 2019 to 2034

Figure 11: Global Market Value Share (%) and BPS Analysis by Product, 2024 to 2034

Figure 12: Global Market Y-o-Y Growth (%) Projections by Product, 2024 to 2034

Figure 13: Global Market Value (US$ Million) Analysis by Age Group, 2019 to 2034

Figure 14: Global Market Volume (Units) Analysis by Age Group, 2019 to 2034

Figure 15: Global Market Value Share (%) and BPS Analysis by Age Group, 2024 to 2034

Figure 16: Global Market Y-o-Y Growth (%) Projections by Age Group, 2024 to 2034

Figure 17: Global Market Value (US$ Million) Analysis by End User, 2019 to 2034

Figure 18: Global Market Volume (Units) Analysis by End User, 2019 to 2034

Figure 19: Global Market Value Share (%) and BPS Analysis by End User, 2024 to 2034

Figure 20: Global Market Y-o-Y Growth (%) Projections by End User, 2024 to 2034

Figure 21: Global Market Attractiveness by Product, 2024 to 2034

Figure 22: Global Market Attractiveness by Age Group, 2024 to 2034

Figure 23: Global Market Attractiveness by End User, 2024 to 2034

Figure 24: Global Market Attractiveness by Region, 2024 to 2034

Figure 25: North America Market Value (US$ Million) by Product, 2024 to 2034

Figure 26: North America Market Value (US$ Million) by Age Group, 2024 to 2034

Figure 27: North America Market Value (US$ Million) by End User, 2024 to 2034

Figure 28: North America Market Value (US$ Million) by Country, 2024 to 2034

Figure 29: North America Market Value (US$ Million) Analysis by Country, 2019 to 2034

Figure 30: North America Market Volume (Units) Analysis by Country, 2019 to 2034

Figure 31: North America Market Value Share (%) and BPS Analysis by Country, 2024 to 2034

Figure 32: North America Market Y-o-Y Growth (%) Projections by Country, 2024 to 2034

Figure 33: North America Market Value (US$ Million) Analysis by Product, 2019 to 2034

Figure 34: North America Market Volume (Units) Analysis by Product, 2019 to 2034

Figure 35: North America Market Value Share (%) and BPS Analysis by Product, 2024 to 2034

Figure 36: North America Market Y-o-Y Growth (%) Projections by Product, 2024 to 2034

Figure 37: North America Market Value (US$ Million) Analysis by Age Group, 2019 to 2034

Figure 38: North America Market Volume (Units) Analysis by Age Group, 2019 to 2034

Figure 39: North America Market Value Share (%) and BPS Analysis by Age Group, 2024 to 2034

Figure 40: North America Market Y-o-Y Growth (%) Projections by Age Group, 2024 to 2034

Figure 41: North America Market Value (US$ Million) Analysis by End User, 2019 to 2034

Figure 42: North America Market Volume (Units) Analysis by End User, 2019 to 2034

Figure 43: North America Market Value Share (%) and BPS Analysis by End User, 2024 to 2034

Figure 44: North America Market Y-o-Y Growth (%) Projections by End User, 2024 to 2034

Figure 45: North America Market Attractiveness by Product, 2024 to 2034

Figure 46: North America Market Attractiveness by Age Group, 2024 to 2034

Figure 47: North America Market Attractiveness by End User, 2024 to 2034

Figure 48: North America Market Attractiveness by Country, 2024 to 2034

Figure 49: Latin America Market Value (US$ Million) by Product, 2024 to 2034

Figure 50: Latin America Market Value (US$ Million) by Age Group, 2024 to 2034

Figure 51: Latin America Market Value (US$ Million) by End User, 2024 to 2034

Figure 52: Latin America Market Value (US$ Million) by Country, 2024 to 2034

Figure 53: Latin America Market Value (US$ Million) Analysis by Country, 2019 to 2034

Figure 54: Latin America Market Volume (Units) Analysis by Country, 2019 to 2034

Figure 55: Latin America Market Value Share (%) and BPS Analysis by Country, 2024 to 2034

Figure 56: Latin America Market Y-o-Y Growth (%) Projections by Country, 2024 to 2034

Figure 57: Latin America Market Value (US$ Million) Analysis by Product, 2019 to 2034

Figure 58: Latin America Market Volume (Units) Analysis by Product, 2019 to 2034

Figure 59: Latin America Market Value Share (%) and BPS Analysis by Product, 2024 to 2034

Figure 60: Latin America Market Y-o-Y Growth (%) Projections by Product, 2024 to 2034

Figure 61: Latin America Market Value (US$ Million) Analysis by Age Group, 2019 to 2034

Figure 62: Latin America Market Volume (Units) Analysis by Age Group, 2019 to 2034

Figure 63: Latin America Market Value Share (%) and BPS Analysis by Age Group, 2024 to 2034

Figure 64: Latin America Market Y-o-Y Growth (%) Projections by Age Group, 2024 to 2034

Figure 65: Latin America Market Value (US$ Million) Analysis by End User, 2019 to 2034

Figure 66: Latin America Market Volume (Units) Analysis by End User, 2019 to 2034

Figure 67: Latin America Market Value Share (%) and BPS Analysis by End User, 2024 to 2034

Figure 68: Latin America Market Y-o-Y Growth (%) Projections by End User, 2024 to 2034

Figure 69: Latin America Market Attractiveness by Product, 2024 to 2034

Figure 70: Latin America Market Attractiveness by Age Group, 2024 to 2034

Figure 71: Latin America Market Attractiveness by End User, 2024 to 2034

Figure 72: Latin America Market Attractiveness by Country, 2024 to 2034

Figure 73: Western Europe Market Value (US$ Million) by Product, 2024 to 2034

Figure 74: Western Europe Market Value (US$ Million) by Age Group, 2024 to 2034

Figure 75: Western Europe Market Value (US$ Million) by End User, 2024 to 2034

Figure 76: Western Europe Market Value (US$ Million) by Country, 2024 to 2034

Figure 77: Western Europe Market Value (US$ Million) Analysis by Country, 2019 to 2034

Figure 78: Western Europe Market Volume (Units) Analysis by Country, 2019 to 2034

Figure 79: Western Europe Market Value Share (%) and BPS Analysis by Country, 2024 to 2034

Figure 80: Western Europe Market Y-o-Y Growth (%) Projections by Country, 2024 to 2034

Figure 81: Western Europe Market Value (US$ Million) Analysis by Product, 2019 to 2034

Figure 82: Western Europe Market Volume (Units) Analysis by Product, 2019 to 2034

Figure 83: Western Europe Market Value Share (%) and BPS Analysis by Product, 2024 to 2034

Figure 84: Western Europe Market Y-o-Y Growth (%) Projections by Product, 2024 to 2034

Figure 85: Western Europe Market Value (US$ Million) Analysis by Age Group, 2019 to 2034

Figure 86: Western Europe Market Volume (Units) Analysis by Age Group, 2019 to 2034

Figure 87: Western Europe Market Value Share (%) and BPS Analysis by Age Group, 2024 to 2034

Figure 88: Western Europe Market Y-o-Y Growth (%) Projections by Age Group, 2024 to 2034

Figure 89: Western Europe Market Value (US$ Million) Analysis by End User, 2019 to 2034

Figure 90: Western Europe Market Volume (Units) Analysis by End User, 2019 to 2034

Figure 91: Western Europe Market Value Share (%) and BPS Analysis by End User, 2024 to 2034

Figure 92: Western Europe Market Y-o-Y Growth (%) Projections by End User, 2024 to 2034

Figure 93: Western Europe Market Attractiveness by Product, 2024 to 2034

Figure 94: Western Europe Market Attractiveness by Age Group, 2024 to 2034

Figure 95: Western Europe Market Attractiveness by End User, 2024 to 2034

Figure 96: Western Europe Market Attractiveness by Country, 2024 to 2034

Figure 97: Eastern Europe Market Value (US$ Million) by Product, 2024 to 2034

Figure 98: Eastern Europe Market Value (US$ Million) by Age Group, 2024 to 2034

Figure 99: Eastern Europe Market Value (US$ Million) by End User, 2024 to 2034

Figure 100: Eastern Europe Market Value (US$ Million) by Country, 2024 to 2034

Figure 101: Eastern Europe Market Value (US$ Million) Analysis by Country, 2019 to 2034

Figure 102: Eastern Europe Market Volume (Units) Analysis by Country, 2019 to 2034

Figure 103: Eastern Europe Market Value Share (%) and BPS Analysis by Country, 2024 to 2034

Figure 104: Eastern Europe Market Y-o-Y Growth (%) Projections by Country, 2024 to 2034

Figure 105: Eastern Europe Market Value (US$ Million) Analysis by Product, 2019 to 2034

Figure 106: Eastern Europe Market Volume (Units) Analysis by Product, 2019 to 2034

Figure 107: Eastern Europe Market Value Share (%) and BPS Analysis by Product, 2024 to 2034

Figure 108: Eastern Europe Market Y-o-Y Growth (%) Projections by Product, 2024 to 2034

Figure 109: Eastern Europe Market Value (US$ Million) Analysis by Age Group, 2019 to 2034

Figure 110: Eastern Europe Market Volume (Units) Analysis by Age Group, 2019 to 2034

Figure 111: Eastern Europe Market Value Share (%) and BPS Analysis by Age Group, 2024 to 2034

Figure 112: Eastern Europe Market Y-o-Y Growth (%) Projections by Age Group, 2024 to 2034

Figure 113: Eastern Europe Market Value (US$ Million) Analysis by End User, 2019 to 2034

Figure 114: Eastern Europe Market Volume (Units) Analysis by End User, 2019 to 2034

Figure 115: Eastern Europe Market Value Share (%) and BPS Analysis by End User, 2024 to 2034

Figure 116: Eastern Europe Market Y-o-Y Growth (%) Projections by End User, 2024 to 2034

Figure 117: Eastern Europe Market Attractiveness by Product, 2024 to 2034

Figure 118: Eastern Europe Market Attractiveness by Age Group, 2024 to 2034

Figure 119: Eastern Europe Market Attractiveness by End User, 2024 to 2034

Figure 120: Eastern Europe Market Attractiveness by Country, 2024 to 2034

Figure 121: South Asia and Pacific Market Value (US$ Million) by Product, 2024 to 2034

Figure 122: South Asia and Pacific Market Value (US$ Million) by Age Group, 2024 to 2034

Figure 123: South Asia and Pacific Market Value (US$ Million) by End User, 2024 to 2034

Figure 124: South Asia and Pacific Market Value (US$ Million) by Country, 2024 to 2034

Figure 125: South Asia and Pacific Market Value (US$ Million) Analysis by Country, 2019 to 2034

Figure 126: South Asia and Pacific Market Volume (Units) Analysis by Country, 2019 to 2034

Figure 127: South Asia and Pacific Market Value Share (%) and BPS Analysis by Country, 2024 to 2034

Figure 128: South Asia and Pacific Market Y-o-Y Growth (%) Projections by Country, 2024 to 2034

Figure 129: South Asia and Pacific Market Value (US$ Million) Analysis by Product, 2019 to 2034

Figure 130: South Asia and Pacific Market Volume (Units) Analysis by Product, 2019 to 2034

Figure 131: South Asia and Pacific Market Value Share (%) and BPS Analysis by Product, 2024 to 2034

Figure 132: South Asia and Pacific Market Y-o-Y Growth (%) Projections by Product, 2024 to 2034

Figure 133: South Asia and Pacific Market Value (US$ Million) Analysis by Age Group, 2019 to 2034

Figure 134: South Asia and Pacific Market Volume (Units) Analysis by Age Group, 2019 to 2034

Figure 135: South Asia and Pacific Market Value Share (%) and BPS Analysis by Age Group, 2024 to 2034

Figure 136: South Asia and Pacific Market Y-o-Y Growth (%) Projections by Age Group, 2024 to 2034

Figure 137: South Asia and Pacific Market Value (US$ Million) Analysis by End User, 2019 to 2034

Figure 138: South Asia and Pacific Market Volume (Units) Analysis by End User, 2019 to 2034

Figure 139: South Asia and Pacific Market Value Share (%) and BPS Analysis by End User, 2024 to 2034

Figure 140: South Asia and Pacific Market Y-o-Y Growth (%) Projections by End User, 2024 to 2034

Figure 141: South Asia and Pacific Market Attractiveness by Product, 2024 to 2034

Figure 142: South Asia and Pacific Market Attractiveness by Age Group, 2024 to 2034

Figure 143: South Asia and Pacific Market Attractiveness by End User, 2024 to 2034

Figure 144: South Asia and Pacific Market Attractiveness by Country, 2024 to 2034

Figure 145: East Asia Market Value (US$ Million) by Product, 2024 to 2034

Figure 146: East Asia Market Value (US$ Million) by Age Group, 2024 to 2034

Figure 147: East Asia Market Value (US$ Million) by End User, 2024 to 2034

Figure 148: East Asia Market Value (US$ Million) by Country, 2024 to 2034

Figure 149: East Asia Market Value (US$ Million) Analysis by Country, 2019 to 2034

Figure 150: East Asia Market Volume (Units) Analysis by Country, 2019 to 2034

Figure 151: East Asia Market Value Share (%) and BPS Analysis by Country, 2024 to 2034

Figure 152: East Asia Market Y-o-Y Growth (%) Projections by Country, 2024 to 2034

Figure 153: East Asia Market Value (US$ Million) Analysis by Product, 2019 to 2034

Figure 154: East Asia Market Volume (Units) Analysis by Product, 2019 to 2034

Figure 155: East Asia Market Value Share (%) and BPS Analysis by Product, 2024 to 2034

Figure 156: East Asia Market Y-o-Y Growth (%) Projections by Product, 2024 to 2034

Figure 157: East Asia Market Value (US$ Million) Analysis by Age Group, 2019 to 2034

Figure 158: East Asia Market Volume (Units) Analysis by Age Group, 2019 to 2034

Figure 159: East Asia Market Value Share (%) and BPS Analysis by Age Group, 2024 to 2034

Figure 160: East Asia Market Y-o-Y Growth (%) Projections by Age Group, 2024 to 2034

Figure 161: East Asia Market Value (US$ Million) Analysis by End User, 2019 to 2034

Figure 162: East Asia Market Volume (Units) Analysis by End User, 2019 to 2034

Figure 163: East Asia Market Value Share (%) and BPS Analysis by End User, 2024 to 2034

Figure 164: East Asia Market Y-o-Y Growth (%) Projections by End User, 2024 to 2034

Figure 165: East Asia Market Attractiveness by Product, 2024 to 2034

Figure 166: East Asia Market Attractiveness by Age Group, 2024 to 2034

Figure 167: East Asia Market Attractiveness by End User, 2024 to 2034

Figure 168: East Asia Market Attractiveness by Country, 2024 to 2034

Figure 169: Middle East and Africa Market Value (US$ Million) by Product, 2024 to 2034

Figure 170: Middle East and Africa Market Value (US$ Million) by Age Group, 2024 to 2034

Figure 171: Middle East and Africa Market Value (US$ Million) by End User, 2024 to 2034

Figure 172: Middle East and Africa Market Value (US$ Million) by Country, 2024 to 2034

Figure 173: Middle East and Africa Market Value (US$ Million) Analysis by Country, 2019 to 2034

Figure 174: Middle East and Africa Market Volume (Units) Analysis by Country, 2019 to 2034

Figure 175: Middle East and Africa Market Value Share (%) and BPS Analysis by Country, 2024 to 2034

Figure 176: Middle East and Africa Market Y-o-Y Growth (%) Projections by Country, 2024 to 2034

Figure 177: Middle East and Africa Market Value (US$ Million) Analysis by Product, 2019 to 2034

Figure 178: Middle East and Africa Market Volume (Units) Analysis by Product, 2019 to 2034

Figure 179: Middle East and Africa Market Value Share (%) and BPS Analysis by Product, 2024 to 2034

Figure 180: Middle East and Africa Market Y-o-Y Growth (%) Projections by Product, 2024 to 2034

Figure 181: Middle East and Africa Market Value (US$ Million) Analysis by Age Group, 2019 to 2034

Figure 182: Middle East and Africa Market Volume (Units) Analysis by Age Group, 2019 to 2034

Figure 183: Middle East and Africa Market Value Share (%) and BPS Analysis by Age Group, 2024 to 2034

Figure 184: Middle East and Africa Market Y-o-Y Growth (%) Projections by Age Group, 2024 to 2034

Figure 185: Middle East and Africa Market Value (US$ Million) Analysis by End User, 2019 to 2034

Figure 186: Middle East and Africa Market Volume (Units) Analysis by End User, 2019 to 2034

Figure 187: Middle East and Africa Market Value Share (%) and BPS Analysis by End User, 2024 to 2034

Figure 188: Middle East and Africa Market Y-o-Y Growth (%) Projections by End User, 2024 to 2034

Figure 189: Middle East and Africa Market Attractiveness by Product, 2024 to 2034

Figure 190: Middle East and Africa Market Attractiveness by Age Group, 2024 to 2034

Figure 191: Middle East and Africa Market Attractiveness by End User, 2024 to 2034

Figure 192: Middle East and Africa Market Attractiveness by Country, 2024 to 2034

Frequently Asked Questions

How big is the stool management system market in 2025?

The stool management system market is expected to be valued at USD 484.1 million in 2025.

What is the sales forecast for stool management systems through 2035?

The market is projected to reach USD 650.6 million by 2035.

What is the projected growth rate for the stool management system market from 2025 to 2035?

The market is anticipated to grow at a CAGR of 3.0% during the forecast period.

Which is the largest segment in the stool management system market?

The stoma bags segment is the largest in the stool management system market, accounting for a 63.76% market share in 2025, driven by rising adoption for non-invasive bowel management and ease of use in both clinical and home care settings.

Who are the key players in the stool management system market?

Key manufacturers include Coloplast A/S, Hollister Incorporated, ConvaTec Group PLC, B. Braun Melsungen AG, Welland Medical Limited, Salts Healthcare Ltd., and 3M Company.

Explore Similar Insights

Future Market Insights

Stool Management System Market

Chat With

MaRIA

Hi There, I am MaRIA, Your Market Research Intelligence Assistant. How may I help you?