The styrene butadiene rubber (SBR) market is projected to expand from USD 12.1 billion in 2025 to USD 20.7 billion by 2035, registering a compound annual growth rate (CAGR) of 5.5%. This trajectory highlights the market’s transformation, led by shifting demand patterns in automotive, industrial, and consumer goods applications. Automotive production remains the primary growth driver, as the industry places increasing emphasis on tire performance parameters such as fuel efficiency, wet grip, and durability. The transition from conventional emulsion SBR (E-SBR) to solution SBR (S-SBR) is at the center of this growth, given its superior molecular design flexibility, improved abrasion resistance, and compliance with fuel economy standards.
Regulatory frameworks worldwide have accelerated this transition. Stringent mandates in regions such as Europe and North America that target reduced rolling resistance and enhanced vehicle safety have compelled tire manufacturers to adopt advanced SBR formulations. Asia-Pacific, with its booming automotive sector and growing presence of tire manufacturing hubs in China, India, and Southeast Asia, is expected to remain the largest regional contributor. Meanwhile, Western markets are focusing on next-generation tires that integrate S-SBR with functionalized compounds, making them compatible with electric vehicles and low-emission mobility requirements.
Beyond tires, SBR’s versatility is expanding its footprint in industrial applications. Its resilience, flexibility, and cost-effectiveness are supporting rising demand in footwear manufacturing, adhesives, and conveyor belts, where enhanced abrasion resistance and dynamic stability are crucial. In adhesives and sealants, SBR is increasingly used in construction and packaging, boosted by urban infrastructure expansion and e-commerce-driven packaging needs. R&D investments by chemical manufacturers are further pushing the boundaries of performance, with functionalized grades being engineered to achieve greater molecular uniformity and specialized characteristics.
The long-term outlook for the SBR market reflects both consolidation and diversification. Tire manufacturers and OEMs are intensifying collaborations with chemical companies to ensure supply stability, customized formulations, and alignment with sustainability objectives. Electric vehicles represent a significant opportunity segment, as S-SBR supports low rolling resistance while maintaining grip performance, critical for EV efficiency. At the same time, environmental pressures are prompting producers to explore bio-based feedstocks and greener production processes, ensuring alignment with evolving customer preferences and compliance with eco-labeling requirements.
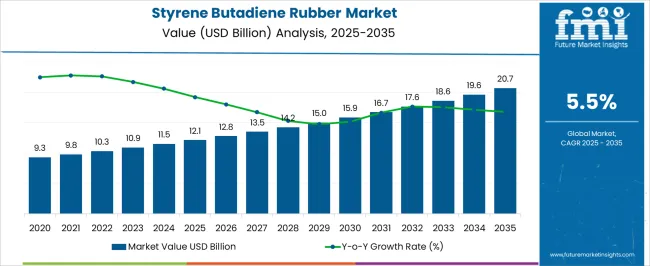
| Metric | Value |
|---|---|
| Styrene Butadiene Rubber Market Estimated Value in (2025 E) | USD 12.1 billion |
| Styrene Butadiene Rubber Market Forecast Value in (2035 F) | USD 20.7 billion |
| Forecast CAGR (2025 to 2035) | 5.5% |
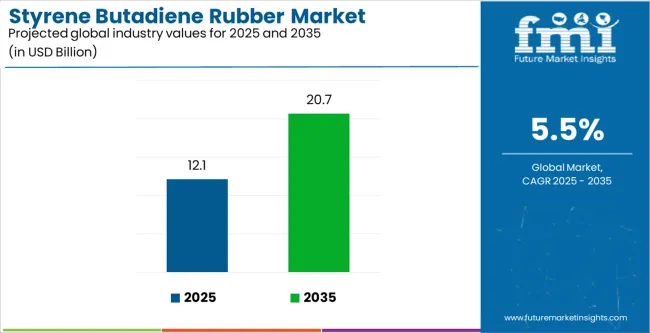
The market is segmented by Type and Application and region. By Type, the market is divided into Solution SBR (S-SBR) and Emulsion SBR (E-SBR). In terms of Application, the market is classified into Tires, Footwear, Gaskets & Hoses, Adhesives & Sealants, Conveyor Belts, and Others. Regionally, the market is classified into North America, Latin America, Western Europe, Eastern Europe, Balkan & Baltic Countries, Russia & Belarus, Central Asia, East Asia, South Asia & Pacific, and the Middle East & Africa.
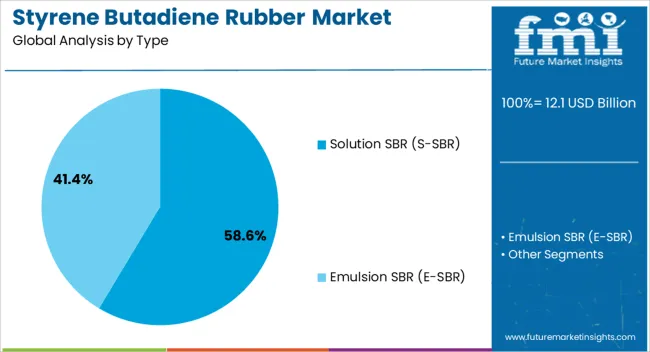
The Solution SBR (S-SBR) segment is projected to contribute 58.6% of the styrene butadiene rubber market revenue in 2025, emerging as the dominant type segment. Growth of this segment has been propelled by increasing regulatory pressure on tire labeling and fuel efficiency, particularly in regions such as Europe and Asia.
S-SBR offers superior rolling resistance, enhanced wear performance, and better wet traction compared to traditional emulsion SBR, making it the preferred material for premium and eco-friendly tires. Technical literature and manufacturer updates have emphasized that S-SBR’s precise microstructure control allows for tailored performance, critical for meeting stringent OEM specifications.
Tire manufacturers have expanded S-SBR procurement to align with evolving global safety and efficiency standards. Furthermore, investments in S-SBR production capacity by leading chemical firms have ensured a stable supply chain to support growing demand. As the automotive industry continues to prioritize energy-efficient tire solutions, the Solution SBR segment is expected to consolidate its leadership within the SBR landscape.
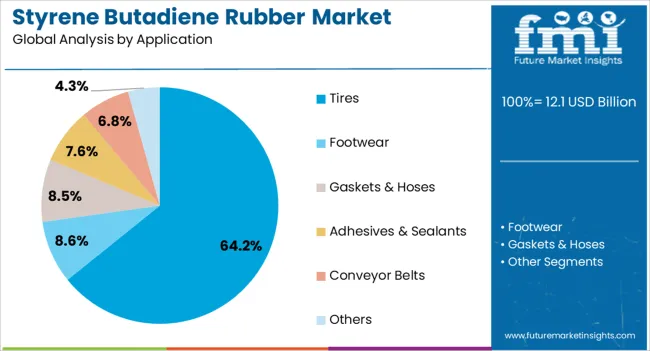
The Tires segment is expected to account for 64.2% of the styrene butadiene rubber market revenue in 2025, maintaining its position as the most significant application category. This dominance has been supported by the critical role of SBR in tire manufacturing, particularly in treads and sidewalls, where durability and grip are essential.
Automakers and tire manufacturers have relied on SBR for its abrasion resistance, heat aging stability, and cost-effectiveness. The growing demand for passenger and commercial vehicles across developing economies has expanded tire production, driving bulk consumption of SBR.
Additionally, fuel efficiency mandates and safety regulations have prompted the development of high-performance tires incorporating advanced SBR grades, including S-SBR and functionalized polymers. Industry reports and OEM partnerships have further indicated a shift toward green tires, where SBR blends are optimized for reduced environmental impact. With global vehicle fleets expanding and retreaded tire usage rising, the Tires segment is expected to remain the principal growth engine for the SBR market.
Styrene-butadiene rubber plays a vital role in the construction industry, with widespread use in roofing materials, sealants, and adhesives. The demand for styrene butadiene rubber is poised to soar, as the construction sector experiences growth.
The growth in construction activities not only stems from urbanization but also from the increasing demand for residential, commercial, and industrial spaces to accommodate growing populations and economic activities. Renovation and retrofitting projects contribute to the demand for styrene butadiene rubber based products, as the projects require reliable and long lasting construction materials to ensure structural integrity and longevity.
Tire Manufacturing to Boost the Adoption of Styrene Butadiene Rubber
The tire industry stands as the foremost consumer of styrene butadiene rubber, constituting a substantial portion of its overall demand. The market will witness significant growth in the foreseeable future, with the global automotive fleet continually expanding and the need for replacement tires steadily increasing.
The demand for vehicles, and subsequently tires, experiences a simultaneous uptick, as economies develop and infrastructural projects burgeon globally. Technological advancements in the automotive sector, aimed at enhancing vehicle performance, safety, and fuel efficiency, are driving tire manufacturers to seek high performance materials.
Surging Preference for Synthetic Rubber Accelerating the Market Growth
The inherent advantages of synthetic rubbers have contributed to their increasing adoption across various industries. Few of them are consistent quality, enhanced performance characteristics, and reduced susceptibility to price fluctuations compared to natural rubber.
Synthetic rubbers, including styrene butadiene rubber, offer superior properties such as abrasion resistance, durability, and versatility, making them well-suited for a wide range of applications. The rubber offers several sustainability advantages over natural rubber, such as reduced environmental impact, improved resource efficiency, and lower carbon footprint.
The scope for styrene butadiene rubber rose at a 3.8% CAGR between 2020 and 2025. The global market is achieving heights to grow at a moderate CAGR of 5.5% over the forecast period 2025 to 2035.
The market witnessed a significant growth during the historical period, attributed to the expansion of end user industries such as automotive, construction, and packaging. The automotive sector remained the largest consumer of styrene butadiene rubber, with the increasing production of vehicles globally driving demand for tires and other rubber components.
Technological innovations in manufacturing led to improved product quality, performance, and cost effectiveness, further stimulating market growth. Increasing infrastructure development projects, particularly in Asia Pacific and Latin America, will boost the demand for styrene butadiene rubber in construction applications including waterproofing membranes and asphalt modifiers. Continual technological advancements, including the development of bio based rubber and innovative additive formulations, will open up new growth opportunities and expand the application scope of rubber in various industries.
The shift towards electric and hybrid vehicles will necessitate the development of specialized SBR formulations optimized for low rolling resistance and enhanced durability, driving demand for advanced tire grades. Sustainability initiatives will drive investment options in the SBR market in recycling technologies and the development of eco friendly rubber products, catering to the growing demand for sustainable materials.
The market will offer opportunities for expansion into new geographic regions with growing industrialization, infrastructure development, and automotive manufacturing activities. Companies can strategically invest in market entry or expansion initiatives to tap into emerging markets with favorable economic conditions and demand growth prospects.
The following table shows the estimated growth rates of the top three markets. India and China are set to exhibit high demand in styrene butadiene rubber, recording CAGRs of 8.1% and 6.1%, respectively, through 2035.
| Countries | CAGR, 2025 to 2035 |
|---|---|
| The United States | 3.1% |
| The United Kingdom | 2.1% |
| Japan | 2.3% |
| China | 6.1% |
| India | 8.1% |
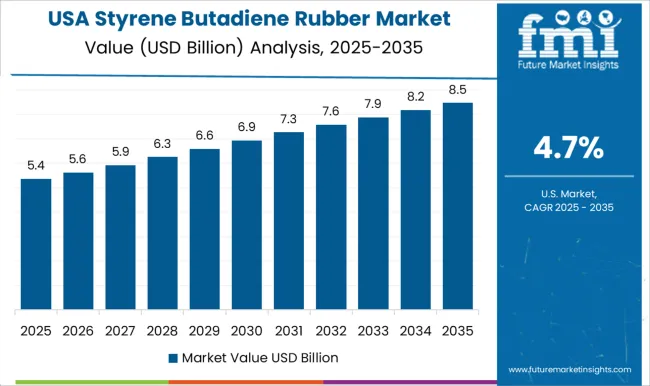
The styrene butadiene rubber market in the United States will expand at a CAGR of 3.1% through 2035. The rubber is utilized in the manufacturing of various consumer goods such as footwear, hoses, conveyor belts, and gaskets. The United States has a robust manufacturing sector producing a wide range of consumer goods for domestic consumption and export.
The demand for styrene butadiene rubber in consumer goods manufacturing will be supported by factors changing consumer preferences and product innovation. The government of the country has been focusing on infrastructure development and modernization initiatives, such as investments in roads, bridges, airports, and public transportation systems. The rubber is used in various construction applications such as asphalt modification, roofing materials, and sealants, which are integral to infrastructure projects.
The growth in infrastructure spending is likely to drive the demand for SBR in the construction sector. The country is one of the largest markets for tires, with a significant portion of domestic demand met by domestic tire manufacturers. The rubber is a key ingredient in tire formulations, contributing to properties such as tread wear, traction, and rolling resistance. The growth of the tire manufacturing sector in the United States, driven by factors including vehicle sales, replacement tire demand, and technological advancements, will boost the demand for styrene butadiene rubber.
The styrene butadiene rubber market in the United Kingdom to expand at a CAGR of 2.1% through 2035.
Government initiatives to invest in infrastructure development, including transportation, energy, and utilities, will propel the demand for rubber in construction applications including road paving, waterproofing, and insulation.
The commitment of the country to infrastructure modernization and sustainable development presents opportunities for rubber manufacturers. The United Kingdom has a strong research and innovation ecosystem, with collaborations between industry, academia, and government driving technological advancements and product innovation.
Investments in research and development aimed at improving rubber formulations, enhancing product performance, and developing innovative applications will drive the market growth. The trade relationships of the United Kingdom with other countries and regions influence the competitiveness of the market. Changes in trade policies, tariffs, and market access agreements may impact the import and export of rubber and its derivatives, shaping market dynamics and growth opportunities.
Styrene butadiene rubber trends in India are taking a turn for the better. An 8.1% CAGR is forecast for the country from 2025 to 2035. India is witnessing increasing awareness and initiatives related to rubber recycling and waste management.
The development of technologies and processes for recycling end of life tires and rubber products presents opportunities for rubber manufacturers to participate in the circular economy. The Indian government has been promoting the adoption of electric vehicles to reduce pollution and dependence on fossil fuels. The rubber is used in EV tires, battery components, and other rubber parts.
The rising demand for SBR in green tires and sustainable construction materials in India will create additional demand for rubber in specialized applications tailored for electric vehicles. India is investing in expanding its petrochemical infrastructure to meet growing demand for raw materials, including feedstocks for rubber production.
Investments in petrochemical refineries, polymerization plants, and downstream facilities will support the growth of the rubber industry in India.
| Segment | Solution SBR (Product Type) |
|---|---|
| Value Share (2025) | 57.2% |
In terms of product type, the solution SBR segment will dominate the market.
Regulatory initiatives aimed at improving tire performance and fuel efficiency, such as tire labeling regulations and standards, are driving the demand for high performance tire formulations. Solution SBR, with its ability to enhance tire properties such as rolling resistance and wet grip, is well positioned to meet the regulatory requirements. Solution SBR offers several advantages over other types of SBR, including better abrasion resistance, tear strength, and flexibility.
The superior performance characteristics make solution SBR particularly suitable for demanding tire applications where durability and performance are critical. Tire manufacturers are actively seeking materials that can help reduce rolling resistance and improve fuel economy, with increasing emphasis on environmental sustainability and fuel efficiency.
| Segment | Tires (Application) |
|---|---|
| Value Share (2025) | 30.1% |
In terms of application, the tires segment will dominate the styrene butadiene rubber market. The replacement tire market is a major contributor to the demand for tires and styrene butadiene rubber.
There is a continuous need for replacement tires, as vehicles age and tire wear occurs. Factors including increasing vehicle ownership, longer vehicle lifespans, and growing awareness of tire maintenance contribute to the growth of the replacement tire market. The styrene butadiene rubber plays a crucial role in enhancing tire performance characteristics such as traction, braking, and durability.
The rubber based tire formulations offer superior abrasion resistance, tear strength, and flexibility, resulting in tires that perform well under various driving conditions and have a longer service life. Consumer demand for tires that offer optimal performance and durability further drives the use of rubber in tire manufacturing. Ongoing advancements in tire technology and materials science are driving innovation in tire design and manufacturing.
Tire manufacturers are continuously developing new tire compounds and tread designs that leverage the properties of rubber to improve tire performance and safety. The technological advancements contribute to the growth of the tires segment and the demand for styrene butadiene rubber.
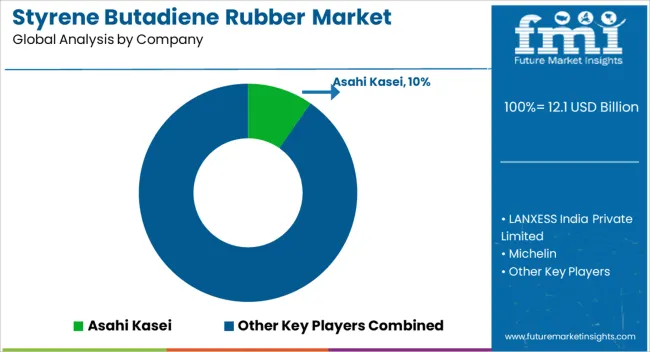
The styrene butadiene rubber market is characterized by its dynamic nature, influenced by a multitude of factors that shape industry dynamics and market competition. Industry consolidation plays a significant role, with mergers, acquisitions, and strategic alliances impacting the competitive landscape.
Technological advancements also drive competition within the market, as companies strive to differentiate themselves by developing innovative formulations, manufacturing processes, and product applications. Larger companies often seek to consolidate their market positions through recent mergers and acquisitions in the SBR industry to enhance their product portfolios and expand their market reach.
Investments in research and development are crucial for staying competitive in the rapidly evolving market, with companies focusing on enhancing product performance, sustainability, and cost effectiveness to meet the evolving needs of customers and regulatory requirements.
Industry Developments
In 2025, Arlanxeo unveiled its latest addition, a state of the art polybutadiene production line with an annual capacity of 65 kilotonnes.
Situated in southern Brazil, this new facility marks a significant milestone for the company, enhancing the flexibility of rubber production at the Triunfo site.
In 2025, ExxonMobil inaugurated its latest styrene butadiene rubber production facility in Singapore.
The plant represents inaugural SBR manufacturing venture of ExxonMobil in Asia, with an annual capacity of 150,000 metric tons.
In the same year, Synthos and Kumho Tire, a renowned South Korean tire manufacturer, entered into a Memorandum of Understanding.
The primary aim of this partnership is to jointly innovate and develop sustainable raw materials tailored specifically for tire manufacturing.
The market is classified into emulsion SBR (E-SBR), and solution SBR (S-SBR)
The report consists of key end uses of styrene butadiene rubber based on tires, footwear, gaskets and hoses, adhesives and sealants, conveyor belts, electric
The analysis of the Styrene Butadiene Rubber market has been carried out in key countries North America, Latin America, Western Europe, Eastern Europe, South Asia and Pacific, East Asia, The Middle East and Africa
The global styrene butadiene rubber market is estimated to be valued at USD 12.1 billion in 2025.
The market size for the styrene butadiene rubber market is projected to reach USD 20.7 billion by 2035.
The styrene butadiene rubber market is expected to grow at a 5.5% CAGR between 2025 and 2035.
The key product types in styrene butadiene rubber market are solution sbr (s-sbr) and emulsion sbr (e-sbr).
In terms of application, tires segment to command 64.2% share in the styrene butadiene rubber market in 2025.


Full Research Suite comprises of:
Market outlook & trends analysis
Interviews & case studies
Strategic recommendations
Vendor profiles & capabilities analysis
5-year forecasts
8 regions and 60+ country-level data splits
Market segment data splits
12 months of continuous data updates
DELIVERED AS:
PDF EXCEL ONLINE
Solution Styrene Butadiene Rubber (S-SBR) Market Size and Share Forecast Outlook 2025 to 2035
Styrene Compartment Boxes Market Size and Share Forecast Outlook 2025 to 2035
Styrene Acrylic Emulsion Polymers Market Size and Share Forecast Outlook 2025 to 2035
Styrene-Butadiene-Styrene (SBS) Block Copolymer Market Size, Growth, and Forecast 2025 to 2035
Polystyrene Films Market Size and Share Forecast Outlook 2025 to 2035
Polystyrene Packaging Market Analysis - Size & Growth Forecast 2025 to 2035
Acrylic Styrene Acrylonitrile (ASA) Resin Market- Growth & Demand 2025 to 2035
Alpha-Methylstyrene Market Size and Share Forecast Outlook 2025 to 2035
Extruded Polystyrene Market Size and Share Forecast Outlook 2025 to 2035
Expanded Polystyrene for Packaging Market Insights – Growth & Forecast 2025 to 2035
Expanded Polystyrene Market
Specialty Polystyrene Resin Market Growth – Trends & Forecast 2024-2034
Expandable Polystyrene Market Size and Share Forecast Outlook 2025 to 2035
Acrylonitrile Butadiene Styrene Market Size and Share Forecast Outlook 2025 to 2035
Bio Butadiene Market Size and Share Forecast Outlook 2025 to 2035
Polybutadiene Market
Polybutadiene Rubber Market
Nitrile Butadiene Rubber (NBR) Latex Market Size and Share Forecast Outlook 2025 to 2035
Rubber Molding Market Forecast Outlook 2025 to 2035
Rubber Track for Defense and Security Market Size and Share Forecast Outlook 2025 to 2035

Thank you!
You will receive an email from our Business Development Manager. Please be sure to check your SPAM/JUNK folder too.
Chat With
MaRIA