The rubber track market for defense and security applications in 2025 is valued at USD 147.6 million and is projected to reach USD 261.8 million by 2035, reflecting a CAGR of 5.9%. The elasticity of growth relative to macroeconomic indicators highlights how market expansion responds to broader economic conditions, government defense budgets, and geopolitical developments. Demand for rubber tracks is closely tied to defense spending, procurement cycles, and modernization programs, making the market moderately sensitive to shifts in national security priorities and economic performance.
Between 2025 and 2030, growth elasticity is expected to be high, as increases in government budgets and military investments directly boost procurement of tracked vehicles and upgrades. As per Future Market Insights, ESOMAR-certified corporate member in insights and analytics, regional conflicts or security initiatives may further amplify demand, creating responsiveness to macroeconomic and geopolitical conditions. From 2030 to 2035, elasticity may moderate as key defense programs stabilize and adoption reaches maturity, though continued modernization, vehicle retrofitting, and maintenance requirements will sustain growth. While economic slowdowns or shifts in public expenditure could temporarily affect procurement, the market remains resilient due to long-term strategic planning in defense sectors. The growth in the rubber track market demonstrates moderate to high elasticity relative to macroeconomic and geopolitical indicators, reflecting a sector closely linked to government policies and defense investment cycles, yet maintaining steady expansion over the forecast period.
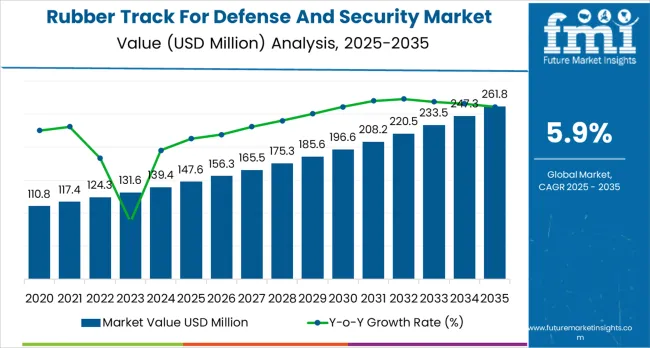
Infantry fighting vehicles, armored personnel carriers, and unmanned ground vehicles are the primary end-users, accounting for roughly 70% of total demand. The remaining 30% is driven by light tactical vehicles and specialized military platforms. Rubber tracks are favored over steel tracks for their reduced weight, lower noise, and improved traction across various terrains.
Recent trends show increased adoption of composite rubber tracks, which incorporate carbon-reinforced fibers and wear-resistant materials to enhance durability and performance. Sensor integration is becoming more common, enabling real-time monitoring of wear and predictive maintenance, which improves operational efficiency. North America contributes about 45% of market demand due to large defense budgets and modernization programs, while Europe and Asia-Pacific together account for roughly 40%, driven by investments in advanced military mobility and upgraded armored fleets. The market continues to expand as militaries seek reliable, versatile, and low-maintenance mobility solutions.
| Metric | Value |
|---|---|
| Market Value (2025) | USD 147.6 million |
| Market Forecast Value (2035) | USD 261.8 million |
| Forecast CAGR (2025-2035) | 5.9% |
Market expansion is being supported by comprehensive military modernization programs across major and emerging military powers seeking to upgrade aging armored vehicle fleets with next-generation platforms featuring enhanced protection, mobility, and firepower. Countries including India, China, South Korea, Turkey, and numerous Middle Eastern nations are implementing multi-billion-dollar procurement programs replacing legacy Soviet-era vehicles with modern indigenously designed or internationally procured tracked vehicles. These new vehicle platforms require corresponding rubber track procurement for original equipment and establishing spare parts inventories ensuring operational readiness. The global tracked military vehicle fleet, estimated at over 200,000 vehicles across armies, marines, and specialized forces, creates substantial ongoing demand for replacement rubber track systems as components reach end of service life typically requiring replacement every 3,000-5,000 kilometers depending on terrain and operational tempo.
The superior performance characteristics of rubber track systems for light and medium armored vehicles are driving market growth, with rubber tracks offering significant advantages over traditional steel tracks including reduced weight (20-40% lighter), lower acoustic signatures for stealth operations, decreased ground pressure enabling soft terrain operations, and elimination of track pad replacement requirements. Modern combat scenarios increasingly involve diverse terrain from urban environments to mountainous regions, jungles, and desert landscapes where rubber track advantages prove decisive for infantry fighting vehicles, reconnaissance vehicles, and armored personnel carriers. Rubber tracks also minimize road surface damage during paved road operations, critical for peacekeeping missions and training exercises where infrastructure preservation concerns limit steel track usage.
Growing geopolitical tensions and regional conflicts are driving sustained defense spending growth particularly across Asia-Pacific, Middle East, and Eastern European regions. China's military modernization and regional assertiveness, territorial disputes in South China Sea, India-Pakistan tensions, ongoing Middle Eastern conflicts, and Russia-Ukraine war collectively stimulate defense procurement including armored vehicle acquisitions and maintenance support. These geopolitical dynamics create favorable conditions for rubber track suppliers serving both new vehicle production and extensive spare parts and maintenance requirements. The peacekeeping operations, disaster relief missions, border security, and internal security applications requiring armored vehicles across diverse terrains support baseline demand independent of active conflict scenarios.
Technological advancements in rubber track design and materials are improving performance while reducing total cost of ownership, creating compelling replacement opportunities for outdated track designs. Advanced rubber track systems incorporating reinforced compounds with aramid fibers or composite materials, optimized tread patterns, and enhanced pin retention systems deliver substantially extended service life (5,000-8,000+ kilometers) compared to earlier rubber track generations while offering improved traction, durability, and resistance to cutting and tearing. These performance improvements justify premium pricing while delivering lifecycle cost savings through reduced replacement frequency and lower maintenance requirements. The development of modular rubber track designs enabling rapid field replacement without specialized equipment improves operational availability particularly during sustained operations where track damage represents significant maintenance burden.
The market is segmented by product type, vehicle payload, vehicle type, application, and region. By product type, the market is divided into rubber pin track, single pin track, and double pin track rubber systems. Based on vehicle payload, the market is categorized into 8 to 12 tons, 12 to 14 tons, 15 to 45 tons, and above 45 tons weight classes. By vehicle type, segments include main battle tanks (limited rubber track application), infantry fighting vehicles, armored personnel carriers, reconnaissance vehicles, self-propelled artillery, and others. The application segment comprises combat operations, peacekeeping missions, border security, and training exercises. Regionally, the market is divided into North America, Europe, Asia-Pacific, Middle East &Africa, and Latin America.
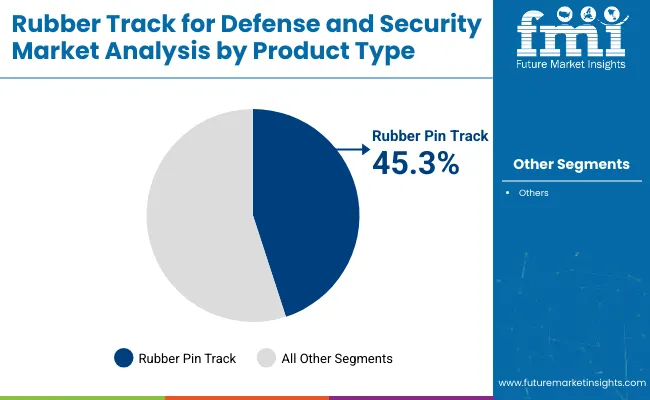
Rubber pin track systems are projected to account for 45.3% of the rubber track for defense and security market in 2025. This substantial share is supported by rubber pin track technology's superior performance characteristics for light and medium armored vehicles where mobility, reduced ground pressure, and operational stealth advantages prove essential. Rubber pin track systems utilize flexible rubber compounds reinforced with steel cables or composite materials, incorporating embedded pins or grousers providing traction while maintaining flexibility enabling smooth operation across varied terrain. The segment benefits from technological maturation delivering reliable performance across demanding military applications while offering compelling advantages including reduced vehicle weight (20-40% lighter than steel), lower acoustic signatures (critical for reconnaissance operations), decreased ground pressure enabling operations across soft terrain, and elimination of track pad replacement requirements associated with steel tracks.
Modern rubber pin track systems demonstrate exceptional durability through advanced compound formulations incorporating abrasion-resistant synthetic rubber, reinforced with aramid fibers (such as Kevlar), and optimized tread patterns distributing loads effectively across contact surfaces. Premium rubber tracks achieve service lives exceeding 5,000-8,000 kilometers under typical operational conditions, comparable to or exceeding steel track longevity while offering substantial weight savings reducing fuel consumption and improving vehicle transportability. The reduced noise generation of rubber tracks compared to metallic alternatives provides tactical advantages during reconnaissance and infiltration operations where acoustic signatures compromise operational security. The rubber tracks minimize road surface damage during paved road operations, important considerations for peacekeeping missions and training exercises where infrastructure preservation concerns limit steel track usage.
The segment particularly serves infantry fighting vehicles, armored personnel carriers, and reconnaissance vehicles typically operating in 15-35 ton weight classes where rubber track advantages prove most compelling. Vehicles including M2/M3 Bradley, CV90, Puma IFV, BMP-3, and numerous other modern platforms specify rubber track systems as original equipment, creating substantial OEM demand and establishing aftermarket replacement requirements. Manufacturers including Soucy International, DST Defence, Diehl Defence, and others have developed application-specific rubber track designs optimized for particular vehicle platforms, incorporating proprietary tread patterns, reinforcement architectures, and pin configurations meeting unique operational requirements.
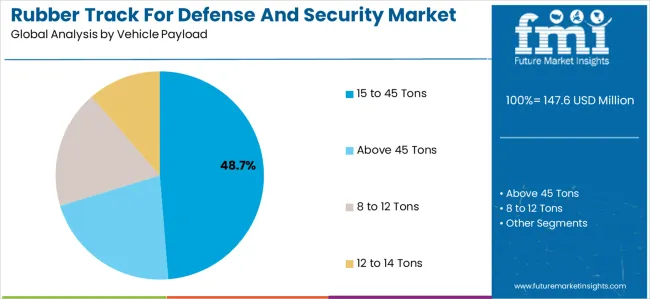
The 15 to 45 tons vehicle payload category is expected to represent 48.7% of rubber track for defense and security demand in 2025. This dominant share reflects the concentration of modern military tracked vehicle procurement in this weight class encompassing infantry fighting vehicles, medium armored vehicles, armored personnel carriers, and specialized support vehicles where rubber tracks offer optimal performance advantages. The segment represents the ideal weight range for rubber track technology, with vehicles in this range benefiting from rubber tracks'weight savings, noise reduction, and reduced ground pressure while remaining within load capacity limitations of advanced rubber track designs.
Modern IFVs including M2/M3 Bradley (approximately 30 tons), Puma (31 tons), CV90 (approximately 25-35 tons depending on variant), and BMP-3 (approximately 18 tons) exemplify this category, combining troop transport capability with organic firepower and protection levels suitable for mechanized operations. These vehicles particularly benefit from rubber tracks'tactical advantages including reduced acoustic signatures enabling stealthier operations, improved ride comfort through rubber's natural vibration damping properties, and enhanced traction across diverse terrain from desert sand to forest undergrowth. The mobility advantages of rubber-tracked vehicles in this weight class prove particularly valuable in rapid deployment scenarios, urban operations, and peacekeeping missions where lighter vehicles offer operational flexibility while maintaining protection against asymmetric threats.
Rubber track requirements for this weight category emphasize durability, maintainability, and operational flexibility across varied terrain. Vehicles in this class frequently transition between paved roads, cross-country terrain, and urban environments requiring rubber tracks balancing road speed capability (where rubber excels), off-road traction, and acceptable service life across mixed-use profiles. Advanced rubber track systems designed for this weight class incorporate multiple reinforcement layers, specialized rubber compounds optimized for abrasion resistance, and sophisticated tread patterns providing grip across mud, sand, snow, and hard surfaces. The segment benefits from high production volumes of IFVs and APCs globally, with major armies maintaining fleets of hundreds to thousands of these vehicles creating substantial original equipment and replacement rubber track demand.
The rubber track for defense and security market is advancing steadily due to increasing global military modernization expenditures, growing procurement of next-generation armored vehicles favoring rubber track technology, and rising emphasis on operational readiness requiring regular track replacement. The market faces challenges including defense budget constraints in some developed nations limiting discretionary procurement, long procurement cycles and complex qualification requirements for military systems, and competitive pressure from steel track systems for heavier vehicles and traditional military doctrines. The market must navigate geopolitical uncertainties affecting international defense trade, evolving military doctrines questioning heavy armor relevance in asymmetric warfare scenarios, and the need for continuous innovation while maintaining backward compatibility with existing vehicle fleets.
Rubber tracks'inherent tactical advantages over traditional steel tracks are accelerating adoption across military forces recognizing operational benefits justifying higher procurement costs. The acoustic signature reduction of rubber tracks proves particularly valuable for reconnaissance, infiltration, and special operations where vehicle noise compromises mission effectiveness. Steel tracks generate distinctive metallic clanking audible at substantial distances, while rubber tracks operate far more quietly enabling closer approach to objectives without detection. Modern counter-reconnaissance assets including acoustic sensors and unmanned aerial vehicles make noise discipline increasingly critical, with rubber-tracked vehicles offering measurable advantages in contested environments where stealth affects mission success.
The Asia-Pacific region's comprehensive military modernization programs represent the primary growth driver for rubber track market, with China, India, South Korea, and Southeast Asian nations implementing multi-billion dollar procurement programs favoring modern vehicles increasingly specifying rubber tracks. China's People's Liberation Army ground force modernization encompasses thousands of new infantry fighting vehicles, armored personnel carriers, and specialized platforms, with newer Chinese designs increasingly adopting rubber track technology recognizing tactical advantages. Chinese domestic rubber track manufacturers including specialized defense contractors are developing advanced systems meeting PLA specifications while supporting export programs selling Chinese armored vehicles internationally.
Material science innovations are substantially advancing rubber track performance through development of enhanced rubber compounds, advanced reinforcement materials, and sophisticated manufacturing processes. Synthetic rubber formulations incorporating specialized additives improve temperature performance maintaining flexibility in extreme cold (down to -40°C) while resisting degradation in extreme heat (up to +50°C), expanding operational envelopes beyond earlier rubber track generations. Abrasion-resistant compounds incorporating carbon black, silica, and proprietary additives extend service life by 30-50% compared to standard formulations, justifying premium pricing through total cost of ownership improvements reducing replacement frequency.
Ongoing geopolitical tensions and regional conflicts sustain elevated defense spending levels globally, directly benefiting military vehicle procurement and rubber track demand. The Russia-Ukraine conflict demonstrates continued relevance of mechanized ground forces including infantry fighting vehicles and armored personnel carriers in high-intensity conventional warfare. This conflict has driven substantial equipment losses requiring replacement vehicle procurements while consuming enormous quantities of spare parts including rubber tracks supporting operational fleets. Operational lessons from Ukraine reinforce importance of mobility and mechanical reliability, with rubber tracks'maintenance advantages and operational benefits proving valuable in sustained operations.
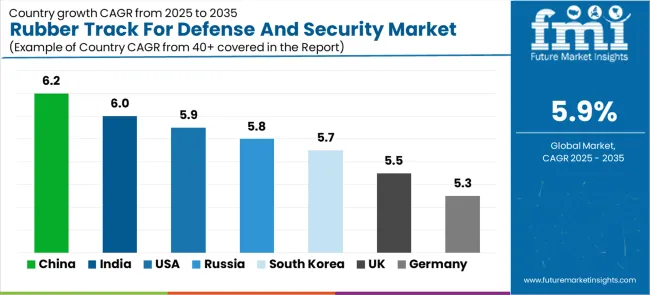
| Country | CAGR (2025–2035) |
|---|---|
| China | 6.2% |
| India | 6.0% |
| United States | 5.9% |
| Russia | 5.8% |
| South Korea | 5.7% |
| United Kingdom | 5.5% |
| Germany | 5.3% |
The rubber track for defense and security market demonstrates robust growth across major military powers, with China leading at 6.2% CAGR through 2035, driven by the People's Liberation Army's massive ground force modernization increasingly favoring rubber track technology for new IFV and APC platforms while maintaining existing rubber-tracked vehicle fleets. India follows at 6.0%, supported by substantial defense modernization programs specifying rubber tracks for FICV and other programs, pursuit of strategic autonomy through indigenous rubber track manufacturing, and recognition of rubber track advantages for operations along mountainous borders. The United States maintains solid growth at 5.9% despite mature market conditions, driven by extensive Bradley IFV fleet sustainment requiring continuous rubber track replacement, technology leadership investments in next-generation rubber track systems, and potential new vehicle programs likely specifying rubber tracks.
The report covers in-depth analysis of 40+ countries, Top-performing markets are highlighted below.
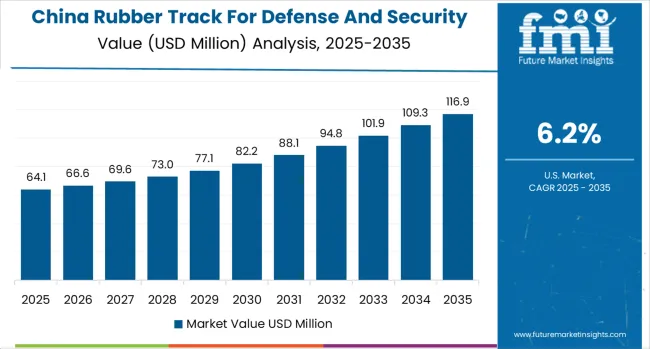
The rubber tracks for defense and security market in China is projected to exhibit the highest growth rate with a CAGR of 6.2% through 2035, driven by the People's Liberation Army's comprehensive ground force modernization increasingly adopting rubber track technology for lighter tracked vehicles. China's shift toward modern mechanized infantry formations emphasizes mobility and deployability, with rubber tracks offering advantages aligned with PLA operational requirements including reduced acoustic signatures supporting reconnaissance and infiltration, weight savings improving strategic deployability, and enhanced mobility across diverse Chinese terrain from mountainous borders to coastal wetlands. New Chinese IFV and APC designs including ZBD-04 variants and emerging platforms increasingly specify rubber tracks as original equipment, creating substantial OEM demand supporting Chinese rubber track manufacturers.
Chinese domestic defense industry including specialized rubber manufacturers and defense contractors are developing advanced rubber track systems incorporating latest materials and technologies. Government emphasis on indigenous defense manufacturing and supply chain independence drives investment in domestic rubber track production capacity reducing reliance on imports while supporting Chinese defense industrial base development. Chinese rubber track manufacturers benefit from massive domestic demand creating economies of scale supporting competitive pricing while ongoing technology development narrows performance gaps with Western suppliers. Growing Chinese defense exports including tracked vehicles to countries throughout Asia, Africa, and Middle East create additional rubber track demand supporting vehicle warranties and spare parts supply for international customers.
Demand for rubber tracks for defense and security in India is expanding at 6.0% CAGR, driven by the Indian Army's Future Infantry Combat Vehicle (FICV) program explicitly specifying rubber tracks as requirement and broader military modernization emphasizing indigenous development. Indian armed forces recognize rubber track advantages particularly for operations along mountainous borders with China and Pakistan where vehicle weight critically affects mobility and deployability. Himalayan high-altitude operations impose extreme challenges where rubber tracks'weight savings (typically 500-1,000 kg compared to steel for IFV applications) meaningfully improve power-to-weight ratios and reduce ground pressure enabling mobility across loose soil and snow-covered terrain.
India's 'Make in India'defense manufacturing initiatives promote domestic rubber track production through indigenous development programs, technology transfer arrangements with foreign suppliers, and procurement preferences favoring domestic content. Indian companies including specialized rubber manufacturers and defense contractors are establishing rubber track production capabilities serving FICV program and potential future vehicle programs. Government support through funding, technology development assistance, and assured domestic procurement creates favorable environment for Indian rubber track industry development aiming to achieve self-sufficiency while potentially serving export markets as Indian defense exports expand under government promotion.
The rubber tracks for defense and security market in the United States is projected to grow at 5.9% CAGR, driven by comprehensive M2/M3 Bradley infantry fighting vehicle fleet sustainment programs requiring continuous rubber track replacement supporting operational readiness. The USA Army operates approximately 6,000 Bradley vehicles across active and reserve components, with each vehicle requiring rubber track replacement every 3,000-5,000 kilometers depending on terrain and operational intensity. This massive fleet creates substantial ongoing demand for replacement rubber tracks supporting training operations, deployments, and maintenance programs ensuring vehicles remain operationally ready.
American defense procurement emphasizes performance and reliability over cost considerations, supporting premium rubber track specifications incorporating latest materials and technologies. USA military quality requirements exceed commercial standards, with stringent testing protocols validating durability, temperature performance, and combat survivability before qualification approval. Rubber track suppliers serving USA military benefit from long-term contracts providing revenue stability while premium pricing reflects demanding specifications and extensive validation requirements. The Bradley Upgrade Program and potential future Bradley replacement initiatives will drive additional rubber track procurement as vehicles receive modernized suspensions and mobility systems potentially specifying next-generation rubber tracks.
Demand for rubber tracks for defense and security in Russia is expanding at 5.8% CAGR, driven by ongoing combat operations in Ukraine consuming substantial equipment and spare parts while exposing limitations of older steel-tracked vehicles and validating rubber track advantages where employed. Russian military modernization efforts increasingly consider rubber track adoption for newer vehicle designs recognizing tactical advantages demonstrated in contemporary operations. While Russian military historically favored steel tracks for most applications, operational experience and observation of Western rubber-tracked vehicle performance is gradually shifting preferences toward rubber track technology for appropriate vehicle weight classes.
Russian defense industry emphasizes domestic production across all military systems ensuring supply security from Western sanctions. Domestic manufacturers are developing rubber track capabilities serving both military requirements and potential export markets as Russian defense industry seeks to maintain competitiveness in international armored vehicle sales. Technology development focuses on proven approaches rather than cutting-edge innovations, incrementally improving rubber track designs incorporating lessons from operational experience while maintaining manufacturing simplicity supporting production in domestic facilities with available equipment and materials.
The rubber tracks for defense and security market in the United Kingdom is projected to grow at 5.5% CAGR, supported by Ajax armored vehicle program (once technical issues resolved) and extended Warrior infantry fighting vehicle service life requiring ongoing rubber track replacement. The Ajax program represents UK's largest armored vehicle procurement in decades, with over 500 vehicles ordered across multiple variants all utilizing rubber tracks. While program has faced technical challenges delaying initial operating capability, eventual full deployment will create substantial rubber track demand for original equipment and spare parts inventories supporting fleet sustainment.
British Army's Warrior IFV fleet continues operations following cancellation of replacement program, necessitating extended service life requiring comprehensive sustainment including regular rubber track replacement. Warrior's rubber tracks require periodic replacement supporting operational readiness as British Army maintains commitments including NATO Very High Readiness Joint Task Force participation and potential deployment operations. UK defense procurement emphasizes quality and reliability, with British military specifications demanding proven performance across demanding conditions including arctic Norwegian exercises and desert Middle Eastern deployments.
Demand for rubber tracks for defense and security in Germany is projected to grow at approximately 5.3% CAGR, driven by renewed defense investment following strategic shift responding to Russian threat and comprehensive Bundeswehr modernization. Germany's Puma infantry fighting vehicle, among world's most advanced IFVs, utilizes sophisticated rubber track systems incorporating latest technology delivering exceptional mobility and acoustic signature reduction. Ongoing Puma production for Bundeswehr and potential export customers creates rubber track demand while establishing German industry leadership in advanced rubber track technologies.
German defense industrial base including specialized component suppliers maintains sophisticated rubber track design and manufacturing capabilities, supporting both domestic military requirements and substantial export business. German engineering expertise delivers premium rubber track systems emphasizing performance, durability, and advanced materials incorporating latest technology developments. The domestic defense revival following decades of underinvestment creates substantial recapitalization requirements including rubber track inventories ensuring operational readiness.
The rubber tracks for defense and security market in South Korea is projected to grow at approximately 5.7% CAGR, driven by sophisticated K21 infantry fighting vehicle production incorporating advanced rubber track systems and successful international exports creating additional demand. K21 represents one of world's most capable IFVs, with rubber tracks providing mobility and acoustic signature advantages complementing vehicle's advanced capabilities. Domestic South Korean production serves Republic of Korea Army requirements while export successes including substantial Polish orders create additional rubber track demand supporting international customers.
South Korean defense industry vertical integration enables domestic rubber track manufacturing supporting K21 program while developing technologies competitive with Western suppliers at attractive pricing. Korean manufacturers combine advanced materials, sophisticated designs, and efficient manufacturing creating rubber tracks delivering Western performance standards at lower costs appealing to international customers. Export-oriented Korean defense industry views rubber tracks as critical component of overall vehicle competitiveness, investing in continuous improvement maintaining technological edge.
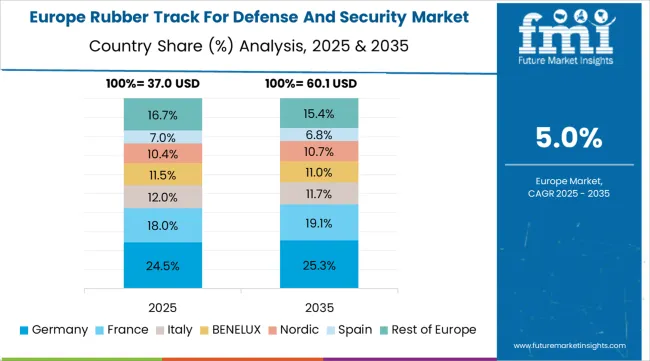
The rubber track for defense and security market in Europe is projected to grow from USD 38.4 million in 2025 to USD 64.8 million by 2035, registering a CAGR of 5.4% over the forecast period. Germany is expected to maintain its leadership with a 26.8% share in 2025, supported by Puma IFV rubber track systems, domestic defense industry capabilities including sophisticated rubber track manufacturers, and renewed defense investment following strategic reassessment. The United Kingdom follows with 18.6% market share, driven by Ajax program rubber track requirements, Warrior IFV extended service creating sustained replacement demand, and British Army modernization initiatives. France holds 15.4% of the European market, benefiting from VBCI family vehicles (some tracked variants using rubber), maintaining domestic defense industrial sovereignty, and export programs to international customers. Poland accounts for 12.2% market share, supported by massive K21 IFV procurement from South Korea including rubber tracks, military expansion programs, and domestic armored vehicle operations. Sweden represents 8.8% of regional demand, operating CV90 IFV family utilizing advanced rubber tracks and maintaining sophisticated domestic defense industry. The Nordic countries collectively demonstrate high per-capita defense spending and sophisticated militaries favoring advanced rubber track technologies. The Rest of Europe region, including Spain, Netherlands, Italy, Belgium, Greece, Romania, and other markets, accounts for 18.2% of the market, supported by diverse tracked vehicle fleets across European NATO members, ongoing modernization initiatives, and regional security concerns driving defense investment increases.
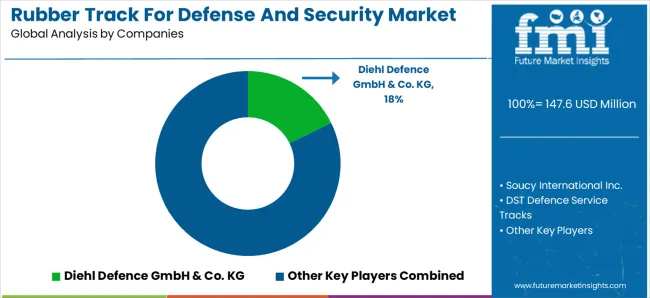
The rubber track for defense and security market is characterized by competition among specialized defense contractors, diversified defense manufacturers, and commercial rubber manufacturers adapting technologies for military applications. Companies are investing in advanced rubber compound development, composite reinforcement materials, smart monitoring technologies, and establishing comprehensive global support networks providing rapid spare parts delivery and technical assistance. Strategic initiatives including long-term supply agreements with vehicle manufacturers, government-to-government partnerships facilitating international sales, and technology licensing arrangements accessing protected markets strengthen competitive positions.
Diehl Defence, German defense technology company, provides advanced rubber track systems emphasizing durability and performance for infantry fighting vehicles and armored personnel carriers with particular strength in European markets and emphasis on German engineering quality. Soucy International, Canadian manufacturer and global rubber track leader, offers AI-enabled diagnostics and reinforced rubber tracks serving diverse military platforms with emphasis on innovation and performance optimization through proprietary compounds and tread designs.
DST Defence Service Tracks, specialized manufacturer, delivers modular and durable rubber track technology focusing on rapid replacement capabilities and field maintenance support enabling quick track changes under operational conditions. Mack Defense, subsidiary of Michelin, leverages parent company's tire and rubber expertise providing rubber track systems for tactical vehicles with global presence and comprehensive supply chain capabilities. Ocean Rubber Factory provides specialized rubber track manufacturing serving niche military applications.
Intertrac, William Cook Defence, Glen-Gery Corporation, VTM-Terberg, Rheinmetall, Soucy Defense, ATI Casting Service, Krauss-Maffei Wegmann, General Dynamics Land Systems, BAE Systems, Hutchinson Industries, Goodyear Defense, Camso (Michelin), and specialized rubber track manufacturers offer engineering expertise, manufacturing capabilities, and aftermarket support across global and regional defense markets.
| Item | Value |
|---|---|
| Quantitative Units | USD 147.6 million |
| Product Type | Rubber Pin Track (45.3%), Single Pin Rubber Track, Double Pin Rubber Track |
| Vehicle Payload | 8 to 12 Tons, 12 to 14 Tons, 15 to 45 Tons (48.7%), Above 45 Tons |
| Vehicle Type | Infantry Fighting Vehicles (6.4% CAGR), Armored Personnel Carriers, Reconnaissance Vehicles, Self-Propelled Artillery, Combat Engineer Vehicles, Others |
| Application | Combat Operations, Peacekeeping Missions, Border Security, Training Exercises, Disaster Relief |
| Regions Covered | North America, Europe, Asia-Pacific, Middle East &Africa, Latin America |
| Country Covered | China, India, United States, Russia, United Kingdom, Germany, South Korea, France, Poland, Japan, Turkey, and other 40+ countries |
| Key Companies Profiled | Diehl Defence, Soucy International, DST Defence Service Tracks, Mack Defense (Michelin), Ocean Rubber Factory, Intertrac, William Cook Defence, Glen-Gery Corporation, VTM-Terberg, Rheinmetall, Camso (Michelin), Soucy Defense, General Dynamics Land Systems, BAE Systems, Hutchinson Industries, Goodyear Defense |
| Additional Attributes | Dollar sales by product type and vehicle payload, regional demand trends across key military modernization markets, competitive landscape with specialized defense contractors and rubber manufacturers, military preferences for rubber versus steel track systems, integration of smart monitoring and predictive maintenance technologies, innovations in composite reinforcement materials and advanced rubber compounds, adoption of aramid-reinforced tracks extending service life, and development of application-specific rubber tracks optimized for diverse operational environments including arctic, desert, jungle, and urban terrain. |
The global rubber track for defense and security market is estimated to be valued at USD 147.6 million in 2025.
The market size for the rubber track for defense and security market is projected to reach USD 261.8 million by 2035.
The rubber track for defense and security market is expected to grow at a 5.9% CAGR between 2025 and 2035.
The key product types in rubber track for defense and security market are rubber pin track, single pin rubber track and double pin rubber track.
In terms of vehicle payload, 15 to 45 tons segment to command 48.7% share in the rubber track for defense and security market in 2025.


Full Research Suite comprises of:
Market outlook & trends analysis
Interviews & case studies
Strategic recommendations
Vendor profiles & capabilities analysis
5-year forecasts
8 regions and 60+ country-level data splits
Market segment data splits
12 months of continuous data updates
DELIVERED AS:
PDF EXCEL ONLINE
Rubber Molding Market Forecast Outlook 2025 to 2035
Rubber Frame Monitors Market Size and Share Forecast Outlook 2025 to 2035
Rubber Coating Market Size and Share Forecast Outlook 2025 to 2035
Rubber Anti-Tack Agents Market Size and Share Forecast Outlook 2025 to 2035
Rubber to Metal Bonded Articles Market Analysis Size and Share Forecast Outlook 2025 to 2035
Rubber-to-Metal Adhesion Market Analysis - Size, Share, and Forecast Outlook 2025-2035
Rubber Coatings Market Growth - Trends & Forecast 2025 to 2035
Rubber Conveyor Belt Market Size, Growth, and Forecast 2025 to 2035
Rubber Testing Equipment Market Growth – Trends & Forecast 2025 to 2035
Rubber Tapes Market Trends - Growth & Forecast 2025 to 2035
Rubber Extruder Market Growth - Trends & Forecast 2025 to 2035
Rubber choppers Market
Gas Scrubber Market Size and Share Forecast Outlook 2025 to 2035
Air Scrubbers Market
Sleeve Rubber Stopper Market Size and Share Forecast Outlook 2025 to 2035
Europe Rubber Derived Unrefined Pyrolysis Oil Market Size and Share Forecast Outlook 2025 to 2035
Sterile Rubber Stopper Market Size and Share Forecast Outlook 2025 to 2035
Natural Rubber Market Size and Share Forecast Outlook 2025 to 2035
Plastic-Rubber Composite Market Trend Analysis Based on Product, Application, and Region 2025 to 2035
Snap on Rubber Stopper Market

Thank you!
You will receive an email from our Business Development Manager. Please be sure to check your SPAM/JUNK folder too.
Chat With
MaRIA