

- Market Size (2026)
- USD 395.0 Mn
- Forecast (2036)
- USD 1006.1 Mn
- CAGR (2026 to 2036)
- 9.8%
How big is the Sugar Support Effervescent Market in 2026?
USD 395.0 million in 2026 and USD 1,006.1 million by 2036 at a 9.8% CAGR.
The sugar support effervescent market was valued at USD 359.7 million in 2025. It is projected to grow from USD 395.0 million in 2026 to USD 1,006.1 million by 2036 at 9.8% CAGR. High diabetes exposure is expected to push sugar support effervescent formats into a more documented supplement category. CDC reported 40.1 million people with diagnosed or undiagnosed diabetes in the United States in 2023. The measured scale is expected to sharpen label review for diabetes management supplements that claim glucose support. Supplement brands are projected to need cleaner ingredient logic and water-soluble formats before retailers approve wider shelf space. Retail teams are likely to ask for dosage evidence before online listings expand.
Supplement brands and contract manufacturers are likely to treat sugar support effervescent products as dosage-form programs. WHO advised limiting free sugars to less than 10% of daily energy intake in 2026. The guidance is expected to increase consumer focus on sugar routines and support effervescent tablet packaging that protects moisture-sensitive tablets. Formulators are projected to prioritize taste control and mineral compatibility during pilot production before launch approval.
Formulation-to-repeat-purchase logic is expected to raise the value of effervescent tablets across retail and online channels. IDF reported 589 million adults living with diabetes in 2024. The growing patient population is expected to guide product managers toward nutraceutical excipient choices that support dissolution and claim discipline. High-growth markets are projected to weight channel reach and affordable daily-use packs.
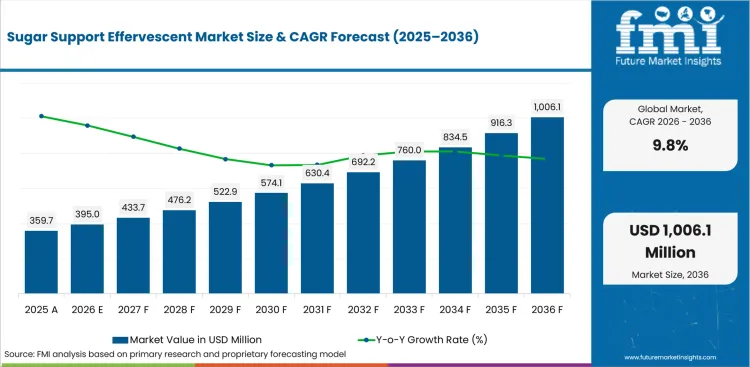
| Metric | Value |
|---|---|
| 2025 Market Size | USD 359.7 million |
| 2026 Market Size | USD 395.0 million |
| 2036 Market Size | USD 1,006.1 million |
| Forecast CAGR (2026-2036) | 9.8% |
| Form Focus | Effervescent |
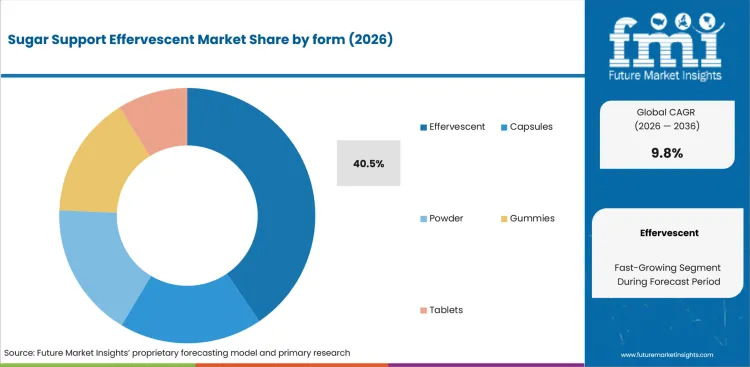
| Effervescent Share (2026) | 40.5% |
| Source Focus | Plant-based |
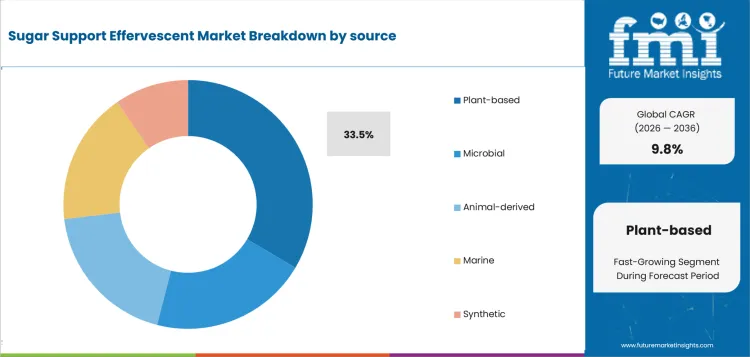
| Plant-based Share (2026) | 33.5% |
| Health Benefit Focus | Gut Health |
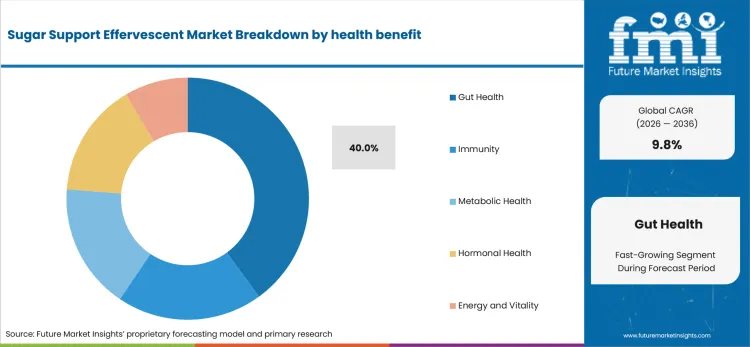
| Gut Health Share (2026) | 40.0% |
| Fastest-growing Country | India |
| India CAGR by 2036 | 8.8% |
Summary of the Sugar Support Effervescent Market
| Market Signal | Commercial Impact |
|---|---|
| Demand and Growth Drivers | Sugar support effervescent demand is expected to be driven by metabolic-health routines and claims discipline. Documentation urgency is projected to rise where retailers screen label language and stability records before listing sugar-support products.
|
| Product and Segment View | Effervescent and plant-based sources are projected to lead their 2026 category positions. Gut health and e-commerce are also expected to hold visible category positions.
|
| Geography and Growth Outlook | India and China are forecast to form the high-growth tier due to digital access and metabolic-health visibility. Other profiled countries are expected to follow steadier paths shaped by claims review and channel maturity.
|
| Competitive Landscape | Competition is expected to remain moderately concentrated among ingredient houses and dosage-form specialists. Consumer nutrition brands are likely to shape downstream account access and service continuity programs.
|
| Analyst Perspective | The central adoption screen is expected to be proof that sugar-support claims fit a stable effervescent format. Account retention is projected to depend on supplier help during formulation and channel review.
|
Source: FMI's proprietary forecasting model and primary research
How is the sugar support effervescent market segmented?
The sugar support effervescent market is segmented by form, source, health benefit, distribution channel, and region.
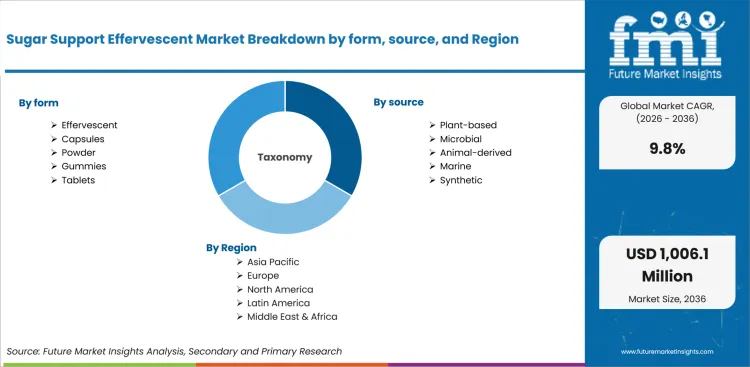
The sugar support effervescent market is segmented by form, source, health benefit, distribution channel, and region. By form, it covers tablets, capsules, powder, gummies, and effervescent formats. By source, it covers plant-based, microbial, animal-derived, marine, and synthetic inputs. By health benefit, it covers gut health, immunity, metabolic health, hormonal health, and energy and vitality. By distribution channel, it covers pharmacies, e-commerce, health and specialty stores, supermarkets, and direct sales. Regional coverage includes North America, Europe, East Asia, South Asia, and Latin America linked to dietary supplement ingredients demand.
How does effervescent shape demand within the form category?
Effervescent tablets are likely to reduce pill swallowing friction and support single-serve routines for consumers managing sugar intake. HERMES PHARMA notes that effervescent tablets dissolve in around 200 ml of water. The serving method is expected to help brands explain daily sugar-support routines without pill-swallowing friction. Contract manufacturers need moisture-control guidance and line checks before approving broader effervescent programs. Retail teams also compare preparation instructions before shelf placement and repeat-order planning across pharmacy shelves.
- By form, effervescent is projected to account for 40.5% of demand in 2026 due to water-based dosing and fast consumer instruction. FDA dietary supplement oversight is expected to keep label and specification files central during launch review. Brands gain a preparation-led format that makes dose instructions clearer for daily routines.
- Effervescent formats are drawing attention from pharmacy and online brand teams owing to taste masking and visible preparation. Brands using botanical supplement formulations are expected to favor suppliers that control fizz strength and residue after dissolution. Moisture-resistant tubes and residue checks are expected to guide sourcing before repeat-purchase programs scale.
What supports plant-based source choices in sugar support formulas?
Plant-based inputs are anticipated to carry commercial weight in sugar-support products due to botanical familiarity and vegan-positioned labels. EFSA noted in 2026 that its food supplement work includes nutrient sources and safety assessment. The reference is expected to keep source traceability visible during label review. Formulators need botanical records and taste data before shifting effervescent formulas into wider production. Channel teams also need ingredient-origin evidence before listing claims move forward across audited retail shelves.
- By source, plant-based is estimated to hold 33.5% share in 2026 owing to traceable botanical positioning and fewer animal-origin concerns. FSSAI allowed a below 10.0% variation from declared nutrient values in its supplement rules. That tolerance is expected to keep formulation control visible during plant-based effervescent development. Sourcing teams then compare botanical identity records before trial purchase and broader batch approval.
- Demand for plant-based inputs is expected to grow among supplement brands attributable to consumer scrutiny of ingredient origin. Product teams using sugar-based excipient systems are expected to test sweetness profiles before wider sourcing decisions. Traceability records and botanical identity checks are expected to influence contract-manufacturing approval before commercial batches move forward.
How do formulators evaluate gut health within the health benefit category?
Gut health positioning is likely to influence sugar-support claims due to the consumer link between digestion and metabolic routines. IDF estimated 252 million adults living with undiagnosed diabetes in 2024. The hidden-risk base is expected to support cautious benefit language. Brand teams need gut-health evidence that fits sugar-support positioning without implying disease treatment. The same logic affects channel pages and pharmacy education materials during consumer-facing product review.
- Gut health is anticipated to represent 40.0% of health benefit demand in 2026 driven by microbiome-linked benefit language and repeat-use routines. NIH ODS lists federal supplement information for consumers and health professionals. The reference is expected to push brands toward restrained wording and clearer ingredient rationale. Formulators then test flavor cues against daily-use instructions before channel approval and claim release.
- Product managers are increasingly specifying gut-health formulations led by defined use occasions and clearer consumer explanations. Brands comparing nutraceutical gummy formats are likely to keep effervescent programs where sugar-control positioning needs drinkable daily routines. Internal reviewers are expected to examine dosage-form stability before approving gut-health claims. Evidence files remain necessary before claims move into channel copy and pack instructions review.
How is e-commerce positioned within distribution channel decisions?
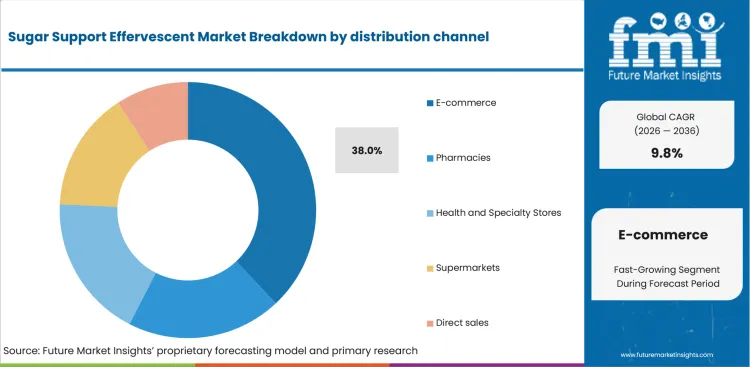
Online listings are poised to raise the evidence burden for sugar-support effervescent brands due to instant comparison of dosage and claims text. The USA Census Bureau reported USD 300.2 billion in retail e-commerce sales during the first quarter of 2026. The channel expansion is expected to increase pressure on product-page accuracy and replenishment packaging. Brands therefore need evidence packs that match online listing workflows before channel launch approval.
- By distribution channel, e-commerce is forecast to capture 38.0% share in 2026 supported by subscription routines and fast product discovery. The channel is likely to reward products that present serving instructions and claims files clearly. Brand owners are expected to screen pack durability before repeat online shipments expand. Retailers then compare tube integrity before recurring orders expand across online fulfillment routines nationally.
- The demand of e-commerce packs are forecast to gain traction in repeat-purchase programs reinforced by clear product pages and moisture-resistant tubes.Retail teams are expected to review claim files before subscription programs scale.
What are the drivers, restraints, and opportunities in the Sugar Support Effervescent Market?
Near-term purchases are being shaped by metabolic-health routines and moisture-sensitive processing. E-commerce replenishment forms the expansion route outlined below.
- Driver: Sugar-support positioning is expected to push purchases toward effervescent formats that combine dosage clarity and consumer-friendly preparation.
- Restraint: Tablet stability risk is anticipated to slow approval where humidity control and taste masking remain unresolved.
- Opportunity: E-commerce and pharmacy replenishment are projected to open access for suppliers offering claim files and trial support.
Supplement brands are expected to expand sugar-support briefs where metabolic-health routines require clear serving instructions and repeat-use convenience. WHO reported 830 million people living with diabetes in 2022. The disease burden is expected to make sugar-support language more visible across supplement review. HERMES PHARMA describes effervescent tablets as fast-dissolving formats. The delivery format is expected to help brands explain use routines without turning supplement copy into treatment language. Marketing teams also need claim wording that keeps sugar-support positioning outside treatment language during retail review.
Manufacturing teams are likely to delay launch approval where effervescent tablets absorb moisture or leave residue after dissolution. FDA stated in April 2024 that food and dietary supplement CGMPs cover quality practices for manufacturing and holding. The rule context is expected to keep stability records central during qualification. Contract manufacturers need defined success measures for taste masking and tube protection before approving sugar-support scale-up. Quality teams then convert those checks into approval gates before contract manufacturers run larger batches.
Digital shelf expansion is expected to convert stability work into a stronger account-access route. China recorded physical-goods online retail at 26.1% of consumer goods sales in 2025. The retail mix is projected to support Asia Pacific nutraceutical demand where product pages carry dosage and claim explanations. Suppliers that combine stability guidance with e-commerce content support are expected to gain wider trial access. Retail teams then link those files to replenishment planning before subscription pages receive wider funding.
Which country CAGRs are profiled in the Sugar Support Effervescent Market?
.webp "Top Country Growth Comparison Sugar Support Effervescent Market Cagr (2026 2036)")
| Country | CAGR |
|---|---|
| United States | 5.9% |
| China | 7.4% |
| India | 8.8% |
| Germany | 5.0% |
| United Kingdom | 5.4% |
| Japan | 4.2% |
| South Korea | 5.7% |
Source: FMI's proprietary forecasting model and primary research
How do country-level CAGRs compare in the Sugar Support Effervescent Market?
India is projected to expand at 8.8% CAGR through 2036 and China is forecast to rise at 7.4% CAGR. The United States and South Korea are anticipated to advance at 5.9% CAGR and 5.7% CAGR respectively. Variation reflects digital supplement access and metabolic-health awareness across sugar-support supplement routines. Claims-review discipline is expected to separate pharmacy-led buying from online-led buying . Supplier selection is projected to vary by moisture control and low-sugar taste support.
- Through 2036, the United States is projected to grow at 5.9% CAGR due to diabetes exposure and structured supplement oversight. CDC reported 115.2 million adults with prediabetes in 2023. The prediabetic risk is expected to raise consumer interest in daily sugar-support routines that stay inside supplement-claim boundaries. The local challenge is strict wording around glucose support rather than disease treatment. Pharmacy teams also need packaging evidence that proves tablet stability during moisture exposure and repeat shelf handling. Suppliers with claim files and effervescent stability data are expected to receive stronger consideration in pharmacy and specialty retail accounts
- China sugar support effervescent demand is anticipated to advance at 7.4% CAGR over the assessment period, driven by online retail scale and urban wellness shopping. Official data from the National Bureau of Statistics placed online retail sales at 16 trillion yuan in 2025. The channel scale is expected to make label clarity and taste-led repeat purchase central for supplement brands. Urban consumers compare claims and delivery formats quickly on digital shelves. Cross-border platforms also require localized product descriptions before imported wellness formats build repeat orders. Suppliers with localized e-commerce content and moisture-protected packs are expected to gain traction in cross-border and domestic channels.
- Adoption of sugar support effervescent products in India is forecast to rise at 8.8% CAGR over the forecast period, supported by nutraceutical access and metabolic-risk visibility. IDF estimated 89.8 million Indian adults living with diabetes in 2024. The clinical burden is expected to support sugar-management positioning without disease-treatment claims. Local opportunity is concentrated in pharmacy-linked online ordering and smaller daily-use packs. Brand owners also need FSSAI-ready wording before product launches move across national retail chains. Suppliers with FSSAI-ready labels and low-sugar taste systems are expected to receive better review from brand owners.
- Germany is estimated to post 5.0% CAGR over the forecast period, owing to online purchasing familiarity and strict evidence expectations. Data from Destatis showed that 83% of German internet users shopped online in 2024. Digital familiarity is expected to support repeat supplement ordering, yet German accounts still require careful ingredient records. Retailers are likely to scrutinize sugar-support wording and plant-based source claims before listings. Pharmacy groups also expect dissolution and stability files that fit local consumer-protection practice. Suppliers with European claim awareness and documented dissolution behavior are expected to fit pharmacy-led accounts more effectively. Pharmacy accounts are expected to favor suppliers that translate claim limits into practical shelf documents.
- The United Kingdom outlook is projected to record 5.4% CAGR during the assessment period, reinforced by diabetes-care visibility and health-store comparison. NHS Digital recorded 3.7 million people living with type 2 diabetes in England during 2024-25. The care baseline is expected to increase consumer attention toward sugar routines without replacing clinical care. Retailers and online platforms are likely to reject vague glucose claims during product-page review. Health-store chains also need product education that separates supplement support from treatment language. Suppliers with plain label language and batch files are expected to suit pharmacy accounts before broader replenishment programs. Retail accounts are expected to favor partners that explain glucose-support limits before online listings expand.
- The demand of sugar support effervescent in Japan is predicted to advance at 4.2% CAGR through 2036, shaped by conservative claims review and measured e-commerce growth. METI reported cosmetics and pharmaceutical B2C e-commerce value of 1.0 trillion yen in fiscal year 2024. The digital channel base is expected to support pharmacy-style supplement browsing without loosening product-function wording. Local adoption is likely to stay slower due to cautious consumer claims review and established functional food rules. Retailers are expected to request Japanese-language files before trial placement. Suppliers with low-sugar taste evidence are expected to receive closer review from local retailers. Local retailers are expected to favor suppliers that pair Japanese-language files with taste evidence.
- South Korea sales are forecast to expand at 5.7% CAGR by 2036, led by mobile shopping and beauty-linked wellness routines. Statistics Korea recorded mobile shopping transaction value of 18.79 trillion won in December 2025. The mobile base is expected to favor clear claims and compact packs. Fast product comparison is likely to shape supplement brand screening. Local adoption is constrained by crowded wellness shelves and fast trend cycles. Suppliers with clean product pages and retailer-ready claim files are expected to draw attention from digital-first nutrition brands. Digital retailers are expected to favor suppliers that update product-page files before trend cycles shift.
Who are the notable companies in the Sugar Support Effervescent Market?
DSM-Firmenich, IFF, Lonza Capsules & Health Ingredients, HERMES PHARMA, BASF, LDC, Nestle Health Science, ADM, Glanbia, and Amway are the notable companies shaping this market.
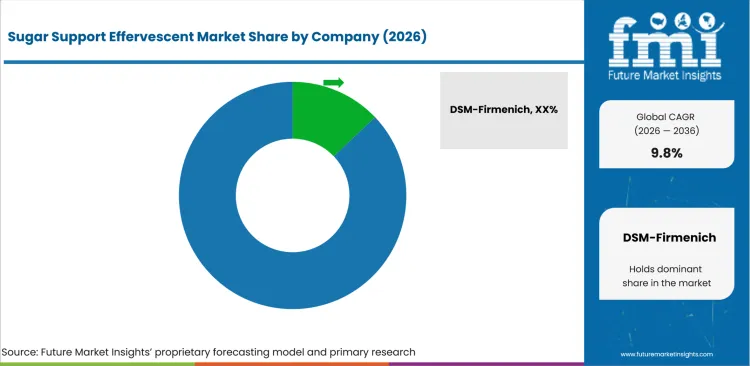
Competition in the sugar support effervescent market is expected to remain moderately concentrated around ingredient breadth and dosage-form know-how. Channel documentation is projected to control supplier approval. Established multinationals are likely to hold account access in formulation files and global supply continuity. Smaller specialists are projected to compete in effervescent manufacturing and moisture-control services. Sourcing decisions are expected to center on claim support and taste control linked to dietary supplement packaging. Pilot-to-scale assistance is likely to separate suppliers during account expansion.
- Ingredient breadth is expected to favor DSM-Firmenich and ADM in accounts that need minerals and botanicals. Nutrition science is likely to shape the same qualification cycle. Supplement brands are projected to use these portfolios to reduce early sourcing steps. Metabolic-health ingredients are then compared before tablet trials begin.
- Oral-format capability is projected to support IFF and Lonza Capsules & Health Ingredients where formulators need excipient support and dosage-form options. These companies are likely to draw attention in accounts comparing effervescent tablets against capsules.
- Effervescent manufacturing depth is anticipated to give HERMES PHARMA a practical role in finished-format programs. Contract manufacturing teams are likely to value experience with moisture-sensitive tablets and tube packaging before committing to sugar-support launches. The commercial edge is lower pilot risk during seasonal line-extension planning.
- Consumer access is expected to support Nestle Health Science and Glanbia in branded nutrition environments. Amway is likely to remain visible in direct consumer routines that shape supplement repeat purchase. Their advantage is direct feedback on flavor tolerance and repeat-use routines before claim-sensitive programs scale.
Competitive Benchmarking: Sugar Support Effervescent Market
| Company | Format relevance | Claims support | Channel access | Service reach |
|---|---|---|---|---|
| DSM-Firmenich | High | Strong | Global | Global |
| IFF | High | Strong | Global | Global |
| Lonza Capsules & Health Ingredients | Strong | Medium | Global | Global |
| HERMES PHARMA | Strong | Medium | Regional | Global |
| BASF | Medium | Strong | Global | Global |
| LDC | Medium | Medium | Global | Global |
| Nestle Health Science | Medium | Strong | Global | Global |
| ADM | Medium | Medium | Global | Global |
| Glanbia | Medium | Medium | Global | Global |
| Amway | Medium | Medium | Global | Global |
Source: Future Market Insights competitive analysis, 2026. Ratings reflect relative portfolio relevance and workflow fit. Service capability and geographic reach shape the remaining comparison.
Key Developments in the Sugar Support Effervescent Market
- In April 2025, IFF Pharma Solutions announced its Vitafoods Europe 2025 program for plant-based dietary supplement ingredients and technical expertise. The program covered SeaGel and VERDIGEL SC along with pectin and cellulose inputs for oral-dosage applications.
- In October 2025, Lonza Capsugel launched its Organicaps capsule solution at SupplySide Global 2025. The product was described as a USDA organic certified plant-based immediate release pullulan capsule made in North America.
- In September 2025, BASF and Louis Dreyfus Company completed the sale of BASF food and health performance ingredients business. The transaction included a German production site and application labs, and around 300 employees transferred with the business.
Key Players in the Sugar Support Effervescent Market
Ingredient and nutrition science suppliers
- DSM-Firmenich
- ADM
- BASF
- LDC
- IFF
Dosage-form and effervescent specialists
- Lonza Capsules & Health Ingredients
- HERMES PHARMA
Consumer nutrition companies
- Nestle Health Science
- Glanbia
- Amway
Sugar Support Effervescent Market - Report Scope
| Coverage field | Report scope |
|---|---|
| Market breakdown | Sugar support effervescent market Breakdown By Form, Source, Health Benefit, Distribution Channel, and Region |
| Market Definition | Sugar support effervescent products are dietary supplement tablets or powders that dissolve in water and are used by consumers seeking daily metabolic-health support. |
| Regions Covered | North America, Europe, East Asia, South Asia, and Latin America |
| Countries Covered | United States, China, India, Germany, United Kingdom, Japan, South Korea, and 20+ countries |
| Key Companies Profiled | DSM-Firmenich, IFF, Lonza Capsules & Health Ingredients, HERMES PHARMA, BASF, LDC, Nestle Health Science, ADM, Glanbia, Amway |
| Forecast Period | 2026 to 2036 |
| Approach | Hybrid bottom-up and top-down methodology using form adoption rates and supplement channel mix. Country-level e-commerce signals and ingredient documentation depth were included. Claim-review requirements shaped the final forecast adjustment. |
Source: Future Market Insights - analysis driven by proprietary forecasting models and primary research
Sugar Support Effervescent Market - Research Methodology
| Method | Approach |
|---|---|
| Primary Research | Interviews covered supplement brand managers and contract manufacturing leads. Ingredient sourcing heads and quality teams were included. Pharmacy category managers and e-commerce content teams were consulted to test launch barriers. Discussions focused on effervescent stability and botanical sourcing. Taste masking and sugar-support claim review were checked against packaging needs. |
| Desk Research | Desk research used government health statistics and FDA supplement references. EFSA supplement guidance and national e-commerce indicators were reviewed. Official company pages and trade body materials supported company screening. Product relevance was checked against water-soluble delivery and low-sugar positioning. Tablet moisture control and channel-ready label files shaped inclusion. |
| Market Sizing and Forecasting | Market sizing used a hybrid bottom-up and top-down model across supplement consumption signals and effervescent format adoption. Source mix and health-benefit positioning informed segment weighting. Distribution-channel share shaped route-to-market estimates. Forecast assumptions were adjusted for country e-commerce maturity and pharmacy access. Claims discipline and formulation-trial support shaped supplier weighting. |
| Data Validation | Forecasts were checked against retail channel activity and diabetes burden indicators. Supplier portfolio reviews and country-level digital commerce data supported validation. Company portfolios were reviewed to avoid counting adjacent nutrition products without sugar-support positioning. Effervescent delivery relevance and direct supplement formulation utility shaped the final inclusion screen. |
Source: Future Market Insights (FMI) analysis, based on proprietary forecasting model and primary research
Sugar Support Effervescent Market by Segments
Sugar Support Effervescent Market segmented by form:
- Tablets
- Capsules
- Powder
- Gummies
- Effervescent
Sugar Support Effervescent Market segmented by source:
- Plant-based
- Microbial
- Animal-derived
- Marine
- Synthetic
Sugar Support Effervescent Market segmented by health benefit:
- Gut Health
- Immunity
- Metabolic Health
- Hormonal Health
- Energy and Vitality
Sugar Support Effervescent Market segmented by distribution channel:
- Pharmacies
- E-commerce
- Health and Specialty Stores
- Supermarkets
- Direct sales
Sugar Support Effervescent Market by Region:
- North America
- United States
- Canada
- Europe
- Germany
- United Kingdom
- France
- Italy
- Spain
- Nordics
- East Asia
- China
- Japan
- South Korea
- South Asia
- India
- ASEAN
- Latin America
- Brazil
- Mexico
Research Sources and Bibliography
- Centers for Disease Control and Prevention. (2026, January). National Diabetes Statistics Report. CDC.
- USA Food and Drug Administration. (2024, October). Dietary Supplements. FDA.
- USA Food and Drug Administration. (2024, April). Current Good Manufacturing Practices (CGMPs) for Food and Dietary Supplements. FDA.
- World Health Organization. (2026, January). Healthy diet. World Health Organization.
- World Health Organization. (2024, November). Diabetes. World Health Organization.
- International Diabetes Federation. (2025, April). IDF Diabetes Atlas 2025. International Diabetes Federation.
- International Diabetes Federation. (2025, April). India Diabetes Statistics & Health Data. IDF Diabetes Atlas.
- USA Census Bureau. (2026, May). Quarterly Retail E-Commerce Sales Report. USA Census Bureau.
- National Bureau of Statistics of China. (2026, January). Total Retail Sales of Consumer Goods in December 2025. National Bureau of Statistics of China.
- Federal Statistical Office. (2025, January). Europe European Union: 8 out of 10 internet users shop online. Destatis.
- NHS Digital. (2026, February). National Diabetes Audit Core Report 1: Care Processes and Treatment Targets 2024-25. NHS Digital.
- Office for Health Improvement and Disparities. (2026, April). Diabetes profile: statistical commentary, April 2026. GOV.UK.
- Ministry of Economy, Trade and Industry. (2025, August). Results of FY2024 E-Commerce Market Survey Compiled. METI.
- Statistics Korea. (2026, February). Online Shopping in December 2025. Statistics Korea.
- European Food Safety Authority. (2026, January). Food supplements. EFSA.
- European Food Safety Authority. (2025, April). Health claims. EFSA.
- Food Safety and Standards Authority of India. (2024, January). Version-II Food Safety and Standards Regulations compendium. FSSAI.
- HERMES PHARMA. (2024, January). Effervescent tablets manufacturer HERMES PHARMA. HERMES PHARMA.
- IFF. (2025, April). IFF Pharma Solutions to Showcase Plant-Based Dietary Supplement Ingredients and Technical Expertise at Vitafoods Europe 2025. IFF.
- Lonza. (2025, October). Lonza Capsugel Launches New Market-First Organic Capsule Solution at SupplySide Global 2025. Lonza.
- BASF. (2025, September). Joint News Release: BASF and Louis Dreyfus Company Complete Sale and Purchase Transaction for BASF’s Food and Health Performance Ingredients Business. BASF.
- Nestle Health Science. (2024, August). Nestle Health Science signs agreement to acquire global rights to VOWST. Nestle Health Science.
- DSM-Firmenich. (2026, February). Health, Nutrition & Care - dsm-firmenich Integrated Annual Report 2025. DSM-Firmenich.
This bibliography is provided for reader reference and uses primary government and standards-body sources. Official trade body and company sources are used for verified developments.
This Report Answers
- What value is the sugar support effervescent market estimated to reach in 2026 and 2036?
- What CAGR is forecast for the sugar support effervescent market from 2026 to 2036?
- Which segments shape demand across the parent categories used in the market model?
- Which operating pressures support sugar support effervescent adoption among brands and contract manufacturers?
- How do country CAGRs differ across the seven profiled national markets?
- Which companies compete across ingredient breadth and dosage-form service in this market?
- How does FMI validate forecasts and avoid duplicate statistics during market sizing?
- What should supplement brands address before broader account expansion or sourcing commitment?
- How does claims review and dietary supplement regulation affect vendor selection in this market?
Frequently Asked Questions
Why should executives track the Sugar Support Effervescent Market?
Executives should track the category due to its link between metabolic-health routines and consumer-friendly dosing. Retail claim discipline is expected to shape account access.
What business problem does the Sugar Support Effervescent Market address?
The category addresses the need for sugar-support supplements that dissolve in water and reduce swallowing friction for daily-use consumers.
What should procurement leaders evaluate before selecting suppliers?
Procurement leaders should evaluate dissolution behavior and moisture control. Botanical traceability and claim files should be reviewed before taste stability checks.
What limits return on investment for brand owners?
Return on investment is likely to weaken where tablet stability or product-page claims fail before repeat purchase builds.
How do suppliers build long-term account confidence?
Suppliers build account confidence by providing batch records and label substantiation. They also need humidity-control guidance and support during pilot production.
Preview the report firsthand - request a free sample
Get SampleGet the brochure for pricing and purchase details.
Get PDFTable of Content
- Key Takeaways
- Market Size and CAGR
- Top Growth Driver
- Fastest Growing Segment
- Leading Region
- Key Companies
- Emerging Opportunities
- Executive Summary
- Global Market Outlook
- Demand-side Trends
- Supply-side Trends
- Technology Roadmap Analysis
- Analysis and Recommendations
- Analyst Perspective (What is happening? Why now? What should investors know?)
- Key Questions Answered
- How large is the market?
- What is the CAGR?
- What are key trends?
- Which region dominates?
- Who are the leaders?
- Market Overview
- Market Coverage / Taxonomy
- Market Definition / Scope / Limitations
- Research Methodology
- Chapter Orientation
- Analytical Lens and Working Hypotheses
- Market Structure, Signals, and Trend Drivers
- Benchmarking and Cross-market Comparability
- Market Sizing, Forecasting, and Opportunity Mapping
- Research Design and Evidence Framework
- Desk Research Programme (Secondary Evidence)
- Expert Input and Fieldwork (Primary Evidence)
- Tooling, Models, and Reference Databases
- Data Engineering and Model Build
- Quality Assurance and Audit Trail
- Market Background
- Market Dynamics (Drivers, Restraints, Opportunity, Trends)
- Scenario Forecast (Optimistic, Likely, Conservative)
- Impact Analysis
- AI Impact
- Sustainability Impact
- Regulatory Impact
- Technology Impact
- Consumer / Buyer Analysis
- Purchase Drivers
- Adoption Barriers
- Buyer Journey
- Opportunity Map Analysis
- Product Life Cycle Analysis
- Supply Chain Analysis
- Investment Feasibility Matrix
- Value Chain Analysis
- PESTLE and Porter's Analysis
- Regulatory Landscape
- Regional Parent Market Outlook
- Production and Consumption Statistics
- Import and Export Statistics
- Global Market Analysis and Forecast, 2021 to 2036
- Historical Market Size Value (USD Million) & Volume (Unit) Analysis, 2021 to 2025
- Current and Future Market Size Value (USD Million) & Volume (Unit) Projections, 2026 to 2036
- Y-o-Y Growth Trend Analysis
- Absolute $ Opportunity Analysis
- Global Market Pricing Analysis, 2021 to 2036
- Global Market Analysis and Forecast, By form, 2021 to 2036
- Introduction / Key Findings
- Historical Market Size Value (USD Million) & Volume (Unit) Analysis By form, 2021 to 2025
- Current and Future Market Size Value (USD Million) & Volume (Unit) Analysis and Forecast By form, 2026 to 2036
- Effervescent
- Capsules
- Powder
- Gummies
- Tablets
- Effervescent
- Y-o-Y Growth Trend Analysis By form, 2021 to 2025
- Absolute $ Opportunity Analysis By form, 2026 to 2036
- Global Market Analysis and Forecast, By source, 2021 to 2036
- Introduction / Key Findings
- Historical Market Size Value (USD Million) & Volume (Unit) Analysis By source, 2021 to 2025
- Current and Future Market Size Value (USD Million) & Volume (Unit) Analysis and Forecast By source, 2026 to 2036
- Plant-based
- Microbial
- Animal-derived
- Marine
- Synthetic
- Plant-based
- Y-o-Y Growth Trend Analysis By source, 2021 to 2025
- Absolute $ Opportunity Analysis By source, 2026 to 2036
- Global Market Analysis and Forecast, By health benefit, 2021 to 2036
- Introduction / Key Findings
- Historical Market Size Value (USD Million) & Volume (Unit) Analysis By health benefit, 2021 to 2025
- Current and Future Market Size Value (USD Million) & Volume (Unit) Analysis and Forecast By health benefit, 2026 to 2036
- Gut Health
- Immunity
- Metabolic Health
- Hormonal Health
- Energy and Vitality
- Gut Health
- Y-o-Y Growth Trend Analysis By health benefit, 2021 to 2025
- Absolute $ Opportunity Analysis By health benefit, 2026 to 2036
- Global Market Analysis and Forecast, By distribution channel, 2021 to 2036
- Introduction / Key Findings
- Historical Market Size Value (USD Million) & Volume (Unit) Analysis By distribution channel, 2021 to 2025
- Current and Future Market Size Value (USD Million) & Volume (Unit) Analysis and Forecast By distribution channel, 2026 to 2036
- E-commerce
- Pharmacies
- Health and Specialty Stores
- Supermarkets
- Direct sales
- E-commerce
- Y-o-Y Growth Trend Analysis By distribution channel, 2021 to 2025
- Absolute $ Opportunity Analysis By distribution channel, 2026 to 2036
- Global Market Analysis and Forecast, By Region, 2021 to 2036
- Introduction
- Historical Market Size Value (USD Million) & Volume (Unit) Analysis By Region, 2021 to 2025
- Current Market Size Value (USD Million) & Volume (Unit) Analysis and Forecast By Region, 2026 to 2036
- North America
- Latin America
- Western Europe
- Eastern Europe
- East Asia
- South Asia and Pacific
- Middle East & Africa
- Market Attractiveness Analysis By Region
- North America Market Analysis and Forecast, By Country, 2021 to 2036
- Historical Market Size Value (USD Million) & Volume (Unit) Trend Analysis By Market Taxonomy, 2021 to 2025
- Market Size Value (USD Million) & Volume (Unit) Forecast By Market Taxonomy, 2026 to 2036
- By Country
- USA
- Canada
- Mexico
- By form
- By source
- By health benefit
- By distribution channel
- By Country
- Market Attractiveness Analysis
- By Country
- By form
- By source
- By health benefit
- By distribution channel
- Key Takeaways
- Latin America Market Analysis and Forecast, By Country
- Historical Market Size Value (USD Million) & Volume (Unit) Trend Analysis By Market Taxonomy, 2021 to 2025
- Market Size Value (USD Million) & Volume (Unit) Forecast By Market Taxonomy, 2026 to 2036
- By Country
- Brazil
- Chile
- Rest of Latin America
- By form
- By source
- By health benefit
- By distribution channel
- By Country
- Market Attractiveness Analysis
- By Country
- By form
- By source
- By health benefit
- By distribution channel
- Key Takeaways
- Western Europe Market Analysis and Forecast, By Country
- Historical Market Size Value (USD Million) & Volume (Unit) Trend Analysis By Market Taxonomy, 2021 to 2025
- Market Size Value (USD Million) & Volume (Unit) Forecast By Market Taxonomy, 2026 to 2036
- By Country
- Germany
- UK
- Italy
- Spain
- France
- Nordic
- BENELUX
- Rest of Western Europe
- By form
- By source
- By health benefit
- By distribution channel
- By Country
- Market Attractiveness Analysis
- By Country
- By form
- By source
- By health benefit
- By distribution channel
- Key Takeaways
- Eastern Europe Market Analysis and Forecast, By Country
- Historical Market Size Value (USD Million) & Volume (Unit) Trend Analysis By Market Taxonomy, 2021 to 2025
- Market Size Value (USD Million) & Volume (Unit) Forecast By Market Taxonomy, 2026 to 2036
- By Country
- Russia
- Poland
- Hungary
- Balkan & Baltic
- Rest of Eastern Europe
- By form
- By source
- By health benefit
- By distribution channel
- By Country
- Market Attractiveness Analysis
- By Country
- By form
- By source
- By health benefit
- By distribution channel
- Key Takeaways
- East Asia Market Analysis and Forecast, By Country
- Historical Market Size Value (USD Million) & Volume (Unit) Trend Analysis By Market Taxonomy, 2021 to 2025
- Market Size Value (USD Million) & Volume (Unit) Forecast By Market Taxonomy, 2026 to 2036
- By Country
- China
- Japan
- South Korea
- By form
- By source
- By health benefit
- By distribution channel
- By Country
- Market Attractiveness Analysis
- By Country
- By form
- By source
- By health benefit
- By distribution channel
- Key Takeaways
- South Asia and Pacific Market Analysis and Forecast, By Country
- Historical Market Size Value (USD Million) & Volume (Unit) Trend Analysis By Market Taxonomy, 2021 to 2025
- Market Size Value (USD Million) & Volume (Unit) Forecast By Market Taxonomy, 2026 to 2036
- By Country
- India
- ASEAN
- Australia & New Zealand
- Rest of South Asia and Pacific
- By form
- By source
- By health benefit
- By distribution channel
- By Country
- Market Attractiveness Analysis
- By Country
- By form
- By source
- By health benefit
- By distribution channel
- Key Takeaways
- Middle East & Africa Market Analysis and Forecast, By Country
- Historical Market Size Value (USD Million) & Volume (Unit) Trend Analysis By Market Taxonomy, 2021 to 2025
- Market Size Value (USD Million) & Volume (Unit) Forecast By Market Taxonomy, 2026 to 2036
- By Country
- Kingdom of Saudi Arabia
- Other GCC Countries
- Türkiye
- South Africa
- Other African Union
- Rest of Middle East & Africa
- By form
- By source
- By health benefit
- By distribution channel
- By Country
- Market Attractiveness Analysis
- By Country
- By form
- By source
- By health benefit
- By distribution channel
- Key Takeaways
- Key Countries Market Analysis
- USA
- Pricing Analysis
- Market Share Analysis, 2025
- By form
- By source
- By health benefit
- By distribution channel
- Canada
- Pricing Analysis
- Market Share Analysis, 2025
- By form
- By source
- By health benefit
- By distribution channel
- Mexico
- Pricing Analysis
- Market Share Analysis, 2025
- By form
- By source
- By health benefit
- By distribution channel
- Brazil
- Pricing Analysis
- Market Share Analysis, 2025
- By form
- By source
- By health benefit
- By distribution channel
- Chile
- Pricing Analysis
- Market Share Analysis, 2025
- By form
- By source
- By health benefit
- By distribution channel
- Germany
- Pricing Analysis
- Market Share Analysis, 2025
- By form
- By source
- By health benefit
- By distribution channel
- UK
- Pricing Analysis
- Market Share Analysis, 2025
- By form
- By source
- By health benefit
- By distribution channel
- Italy
- Pricing Analysis
- Market Share Analysis, 2025
- By form
- By source
- By health benefit
- By distribution channel
- Spain
- Pricing Analysis
- Market Share Analysis, 2025
- By form
- By source
- By health benefit
- By distribution channel
- France
- Pricing Analysis
- Market Share Analysis, 2025
- By form
- By source
- By health benefit
- By distribution channel
- India
- Pricing Analysis
- Market Share Analysis, 2025
- By form
- By source
- By health benefit
- By distribution channel
- ASEAN
- Pricing Analysis
- Market Share Analysis, 2025
- By form
- By source
- By health benefit
- By distribution channel
- Australia & New Zealand
- Pricing Analysis
- Market Share Analysis, 2025
- By form
- By source
- By health benefit
- By distribution channel
- China
- Pricing Analysis
- Market Share Analysis, 2025
- By form
- By source
- By health benefit
- By distribution channel
- Japan
- Pricing Analysis
- Market Share Analysis, 2025
- By form
- By source
- By health benefit
- By distribution channel
- South Korea
- Pricing Analysis
- Market Share Analysis, 2025
- By form
- By source
- By health benefit
- By distribution channel
- Russia
- Pricing Analysis
- Market Share Analysis, 2025
- By form
- By source
- By health benefit
- By distribution channel
- Poland
- Pricing Analysis
- Market Share Analysis, 2025
- By form
- By source
- By health benefit
- By distribution channel
- Hungary
- Pricing Analysis
- Market Share Analysis, 2025
- By form
- By source
- By health benefit
- By distribution channel
- Kingdom of Saudi Arabia
- Pricing Analysis
- Market Share Analysis, 2025
- By form
- By source
- By health benefit
- By distribution channel
- Türkiye
- Pricing Analysis
- Market Share Analysis, 2025
- By form
- By source
- By health benefit
- By distribution channel
- South Africa
- Pricing Analysis
- Market Share Analysis, 2025
- By form
- By source
- By health benefit
- By distribution channel
- USA
- Market Structure Analysis
- Competition Dashboard
- Competition Benchmarking
- Market Share Analysis of Top Players
- By Regional
- By form
- By source
- By health benefit
- By distribution channel
- Emerging Startups
- Innovation Benchmarking
- Competition Analysis
- Competition Deep Dive
- DSM-Firmenich
- Overview
- Product Portfolio
- Profitability by Market Segments (Product/Region/Sales Channel)
- Sales Footprint
- Strategy Overview
- Marketing Strategy
- Product Strategy
- Channel Strategy
- IFF
- Lonza Capsules & Health Ingredients
- HERMES PHARMA
- BASF
- LDC
- Nestle Health Science
- ADM
- Glanbia
- Amway
- DSM-Firmenich
- Case Studies
- Success Stories
- Recent Developments
- Competition Deep Dive
- Assumptions & Acronyms Used


