

- Market Size (2026)
- USD 520.6 Mn
- Forecast (2036)
- USD 1005.1 Mn
- CAGR (2026 to 2036)
- 6.8%
How big is the Surge Comparison Testers Market in 2026?
USD 520.6 million in 2026 and USD 1,005.1 million by 2036 at a 6.8% CAGR.
Motor and generator owners are tightening release checks before equipment returns to production. Replacement risk is rising for grid assets and plant motors. A failed rewind can affect uptime, customer acceptance and maintenance budgets. Surge comparison testers support motor testing equipment purchases by exposing turn-to-turn insulation weakness that low-voltage checks can miss. Buyers use the waveform record to decide whether a motor should be returned, rewound again or kept under inspection. This turns the tester into a release-control tool instead of a simple bench instrument.
Repair shops need portable instruments for incoming inspection and final release. Electrical OEMs need automated stations that store waveforms for production quality. Utilities need higher-voltage capability for generators and transformer coils. Industrial maintenance teams need records that support planned outages and safety approvals. These buying conditions keep electrical testing services relevant once hardware choice depends on calibration, reporting support and technician training. The value for buyers is fewer disputed failures and clearer service evidence after each test. This supports premium purchases once service risk enters the buying case.
Regional adoption differs by installed base and production pace. North America and Western Europe rely on tester replacement, service certification and utility reliability programs. Japan and South Korea emphasize quality discipline in precision equipment production. China and India add demand from electrical equipment output, power capacity growth and supplier upgrades. Surge comparison testers become more valuable once they connect voltage range and waveform analysis. Calibration records and production release evidence then turn the test result into a buyer control point. The strategic issue is whether failure evidence can protect uptime before repair cost becomes outage cost.
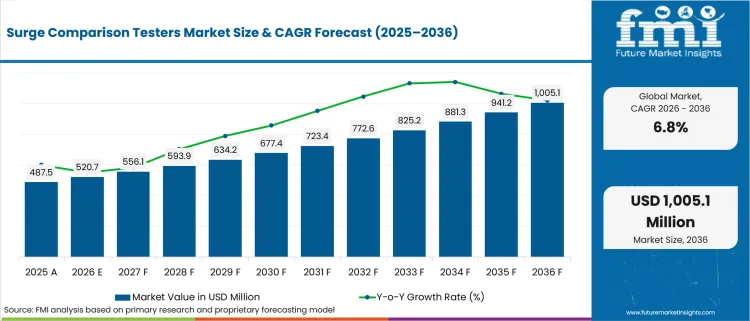
| Metric | Value |
|---|---|
| 2025 Market Size | USD 487.5 million |
| 2026 Market Size | USD 520.6 million |
| 2036 Market Size | USD 1,005.1 million |
| Forecast CAGR (2026–2036) | 6.8% |
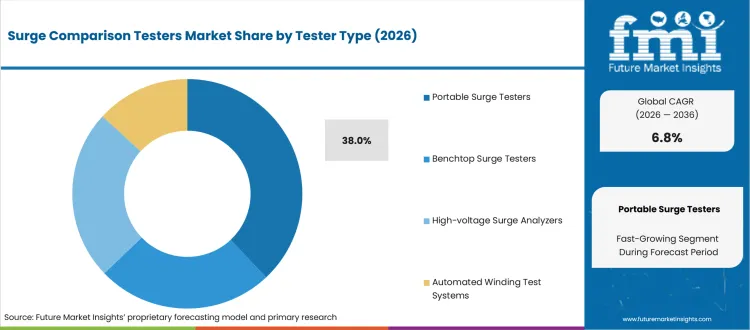
| Tester Type Focus | Portable Surge Testers |
| Portable Surge Testers Share (2026) | 38.0% |
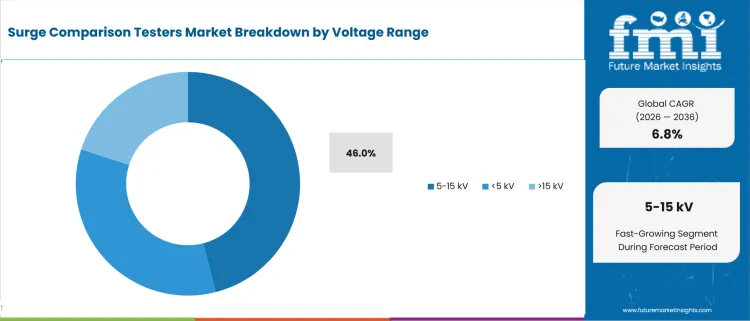
| Voltage Range Focus | 5–15 kV |
| 5–15 kV Share (2026) | 46.0% |
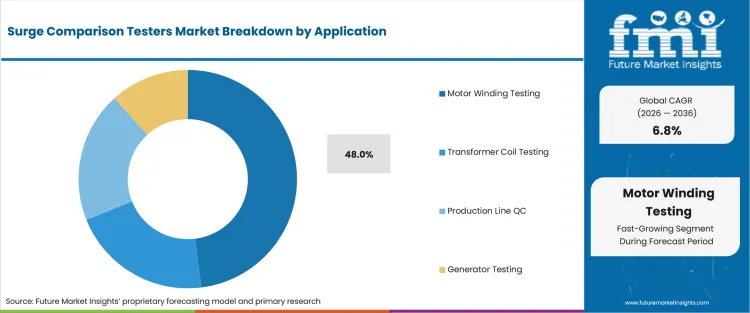
| Application Focus | Motor Winding Testing |
| Motor Winding Testing Share (2026) | 48.0% |
| Fastest-growing Country | China |
| China CAGR by 2036 | 7.8% |
Summary of the Surge Comparison Testers Market
| Market Signal | Commercial Impact |
|---|---|
| Demand and Growth Drivers | Demand for surge comparison testers is increasing as motor repair facilities, OEMs, and industrial maintenance teams strengthen winding diagnostics, quality assurance, and return-to-service validation.
|
| Product and Segment View | Portable surge testers, medium-voltage testing ranges, and motor winding diagnostics remain the leading commercial segments as buyers prioritize reliable insulation assessment and standardized testing workflows.
|
| Geography and Growth Outlook | Asia continues to drive market expansion through industrial manufacturing and power infrastructure growth, while the United States supports demand through equipment reliability and transformer replacement priorities.
|
| Competitive Landscape | Competition increasingly focuses on voltage range capability, waveform analysis software, reporting functionality, and diagnostic accuracy across industrial testing applications.
|
| Analyst Perspective | Surge comparison testers are evolving into reliability validation tools where diagnostic accuracy, waveform analysis, and traceable reporting increasingly determine supplier selection.
- Nikhil Kaitwade, Principal Consultant at Future Market Insights |
How is the surge comparison testers market segmented?
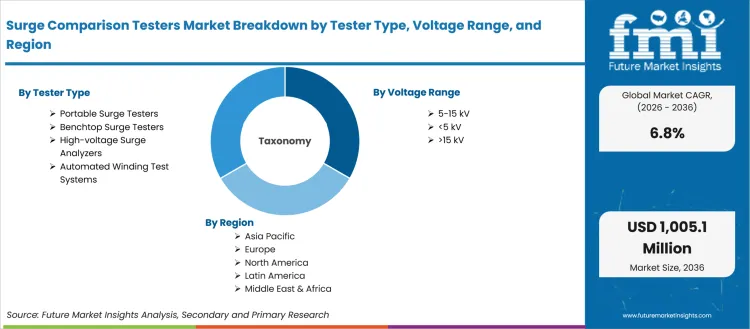
The Surge Comparison Testers industry is segmented by tester type, voltage range, application, end use, sales channel, and region.
The Surge Comparison Testers Market is segmented by tester type, voltage range, application, end use, sales channel, and region. Tester type covers Portable Surge Testers, Benchtop Surge Testers, Automated Winding Test Systems, and High-voltage Surge Analyzers. Voltage range includes <5 kV, 5-15 kV, and >15 kV. Application spans Motor Winding Testing, Transformer Coil Testing, Generator Testing, and Production Line QC. End use covers Motor Repair Shops, Electrical OEMs, Utilities, and Industrial Maintenance. Sales channel includes Direct OEM, Electrical Test Distributors, and Calibration or Service Providers. Regional coverage extends across North America, Latin America, Europe, East Asia, South Asia and Pacific, and the Middle East and Africa.
Why are Portable Surge Testers important within the tester type category?
Repair teams need instruments that move between inspection bays and field jobs without slowing release decisions. Motors arrive in different conditions and often require a sequence of resistance, insulation and surge checks before repair approval. Portable units fit this mixed workload. They also give service providers a practical way to document waveform evidence without sending every machine to a fixed laboratory bench.
- In 2026, Portable Surge Testers are anticipated to hold 38.0% of tester type demand, driven by field movement and small-shop workflows. Megger states that Baker DX analyzers support surge testing, winding resistance and insulation resistance. That multi-test fit helps technicians make faster release decisions on varied motors.
- The operating value is proof at the repair point as shops using portable testers can compare phase waveforms, store records and show customers that repaired windings were stressed under controlled conditions. This reduces acceptance disputes and supports repeat service work in motor repair accounts.
How do buyers evaluate the 5-15 kV voltage range?
Medium-voltage assets create a practical range decision for repair shops and utility service teams. A tester below the common service band limits use on larger motors. A tester above the band can raise cost, size and training needs. The 5-15 kV range fits many rotating-machine workflows and aligns surge testing to broader test and measurement equipment budgets.
- The 5-15 kV category reaches 46.0% of voltage range demand in 2026, attributable to common medium-voltage motor and generator service work. SCHLEICH partial discharge test devices include 6 kV and 12 kV classes for lower test needs. They also list 15 kV and 25 kV classes for broader service work.
- Utility and service buyers benefit from one voltage band that covers many recurring jobs. The band reduces the need to move every asset into higher-voltage systems. It also keeps operator training more manageable for teams that need safe test setup and repeatable documentation.
What supports demand for Motor Winding Testing applications?
The application problem is turn insulation weakness, meaning a winding can pass low-voltage checks and still contain a defect that becomes heat or early failure under operating stress. This is why surge comparison remains relevant for repair shops and OEMs. It also connects the category to automotive test equipment for motor quality checks that support electrified platforms.
- Motor Winding Testing accounts for projected 48.0% of application demand in 2026, shaped by the need to find turn-to-turn insulation weakness before release. Megger reported in April 2026 that surge testing can reveal subtle winding defects that standard resistance measurements cannot detect. That explains the application share.
- The executive case is risk control before downtime. Plant teams using winding-focused tests can decide whether to rewind, return or monitor a motor. That choice becomes critical once failure risk affects production commitments and a replacement motor is costly or slow to obtain.
What market factors influence demand from Motor Repair Shops?
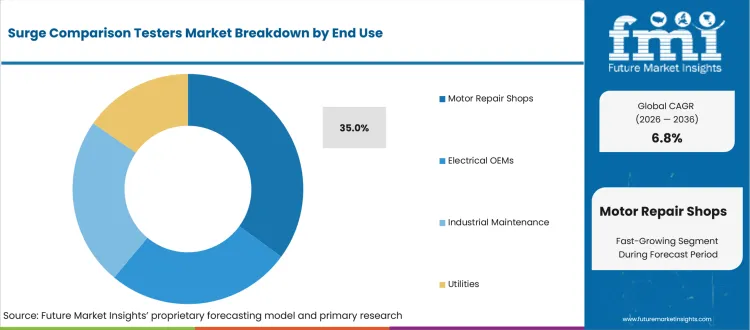
Repair shops sit closest to the return-to-service decision. Customers want confidence that repaired windings can handle electrical stress after rewind or corrective work. The shop must balance speed, proof and safe operation. Surge comparison testers help convert technician judgment into documented evidence that can be attached to repair records and customer acceptance packages.
- Motor Repair Shops is expected to represent 35.0% of end-use demand in 2026, supported by rewind workflows and customer acceptance needs. IEEE 522-2023 applies to coils and windings for rewinds of used machinery. That standards scope reinforces tester use in repair environments.
- For shop owners, the value is fewer disputed releases and clearer service records. A documented surge comparison test helps explain why a motor passed or failed. It also supports pricing for higher-value diagnostic work beyond basic insulation resistance checks.
How is Direct OEM positioned within the sales-channel category?
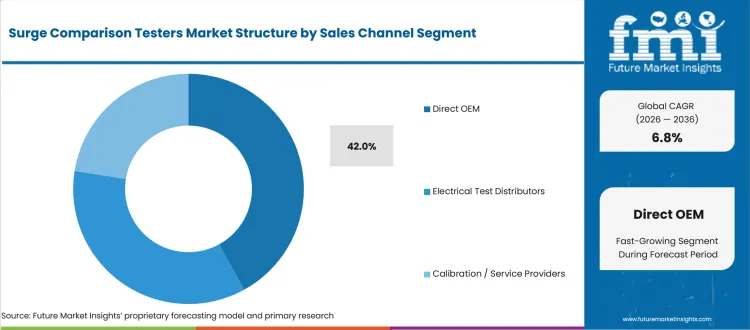
Direct buying becomes important once surge comparison is part of an automated production station. OEMs often need fixtures and test recipes that match a specific coil design. Reporting fields and service support also matter once the station becomes part of production release. A distributor can supply a portable unit. A direct OEM route becomes more practical once the project needs configuration and integration support.
- Direct OEM is estimated to hold 42.0% share in 2026, led by complex automated winding stations and configured test sequences. Sourcetronic states that ST2883 models provide LXI access, waveform storage and pass-fail comparison output. These capabilities support direct technical engagement during setup.
- The channel value is accountability during commissioning. Buyers using direct OEM routes can align voltage limits, fixtures and reporting formats before the line starts production. This reduces handoff risk and helps production engineers defend test results across repeated coil designs.
What are the drivers, restraints, and opportunities in the surge comparison testers market?
Near-term purchases are being shaped by return-to-service proof, operator training risk, and calibration-led service expansion outlined below.
- Driver: Winding fault visibility is driving spending due to buyer need for proof before motors and generators return to service.
- Restraint: Operator caution slows adoption owing to the risk of incorrect test setup on older windings.
- Opportunity: Calibration and reporting services gain traction from buyers that need traceable records for customer approval.
Repair buyers use surge comparison to reduce uncertainty at the moment a repaired asset returns to service. Utilities and heavy industrial sites are also raising the cost of missed faults. IEA reported in 2026 that annual grid investment must increase by about 50% by 2030 to meet electricity demand. That investment signal keeps power monitoring and winding-test evidence tied to reliability spending. Suppliers that combine waveform comparison, voltage discipline and clear reports can defend pricing once buyers ask for proof before recommissioning.
Training remains a purchase barrier for smaller shops and industrial maintenance teams. Buyers may delay adoption if they fear test setup errors or unclear pass-fail rules. Megger states that Baker ADX models support test voltages up to 15 kV and can reach 40 kV using PPX power packs. That range illustrates why operator confidence matters. The restraint becomes a service route for suppliers that offer setup help, calibration support and repeatable reporting templates. A shop will pay for guidance once the wrong test setting can damage customer property.
Supplier opportunity is concentrated in service packages that reduce the burden of specialist interpretation. IEA reported in February 2025 that transmission investment reached USD 140 billion in 2023 and would need to exceed USD 200 billion annually by the mid-2030s. Grid expansion does not convert every buyer into a high-voltage tester customer. It raises the value of credible suppliers that can connect surge testing, partial discharge checks and records for large rotating assets. Startups and specialist distributors can compete by packaging training and calibrated equipment together.
Which country CAGRs are profiled in the surge comparison testers market?
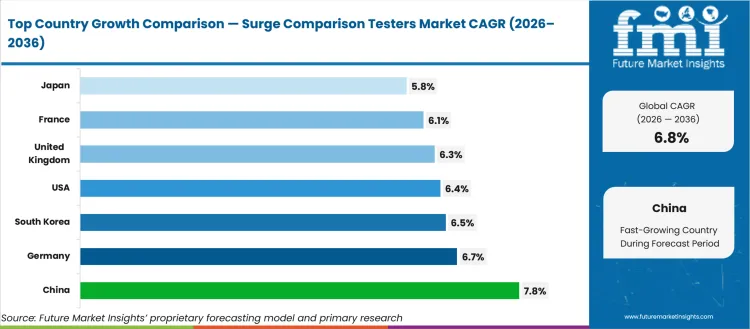
| Country | CAGR |
|---|---|
| United States | 6.4% |
| United Kingdom | 6.3% |
| Germany | 6.7% |
| France | 6.1% |
| Japan | 5.8% |
| China | 7.8% |
| South Korea | 6.5% |
| India | 7.6% |
How do country-level CAGRs compare in the surge comparison testers market?
Country CAGR profiles should be read by asset base, service discipline and the cost of failure evidence. The United States and Western Europe are tied to replacement risk, repair documentation and utility reliability programs. Japan and South Korea reflect quality discipline in precision manufacturing and export supply chains. China and India sit closer to electrical equipment output and power capacity expansion. For buyers, the country comparison is not a simple ranking. It shows where surge comparison testers support uptime protection, customer acceptance records and production release control across different operating environments. This helps suppliers decide whether to prioritize portable service tools or configured production systems.
- By 2036, the United States is projected to record 6.4% CAGR, supported by grid reliability pressure and long replacement cycles. The Department of Energy reported in July 2024 that large power transformer lead times were commonly quoted at 36 months and could reach 60 months. That procurement risk supports offline testing and substation monitoring system planning.
- The United Kingdom is expected to grow at 6.3% CAGR during the forecast period, reinforced by industrial output recovery and service-based maintenance. ONS reported in April 2026 that production output increased 1.2% during the three months to February 2026. A steadier production base supports practical investment in repair-grade electrical diagnostics.
- Over the assessment period, Germany is forecast to advance at 6.7% CAGR, driven by machinery depth and electrical equipment order recovery. Destatis reported in February 2026 that new orders for the manufacture of electrical equipment rose 9.8% in December 2025. This strengthens production and service demand for winding test stations.
- Through 2036, France is anticipated to post 6.1% CAGR, shaped by industrial modernization and utility maintenance requirements. INSEE reported in June 2026 that manufacturing output increased 0.4% in April 2026. The country expansion stays steadier than China or India due to repair replacement demand more than rapid factory expansion.
- Japan is likely to expand at 5.8% CAGR by 2036, influenced by precision manufacturing and cautious replacement cycles. Japan Cabinet Office data showed total machinery orders received by 280 manufacturers increased 23.8% in December 2025. That industrial order signal supports test equipment use but growth remains measured due to established quality systems.
- The surge comparison testers sector in China is estimated to rise at 7.8% CAGR between 2026 and 2036, propelled by electrical machinery output. The National Bureau of Statistics reported that manufacture of electrical machinery and apparatus value added rose 4.3% in 2025. Production scale makes automated winding inspection a more frequent requirement.
- Over the assessment period, South Korea is anticipated to post 6.5% CAGR, supported by export-oriented electronics and electrical equipment production. Korea MOTIR reported in January 2026 that agricultural products, cosmetics and electrical equipment exports reached record highs in 2025. That manufacturing profile supports quality checks for motor and coil suppliers.
- India is likely to expand at 7.6% CAGR by 2036, driven by power infrastructure growth and electrical equipment manufacturing. Press Information Bureau reported in January 2026 that capacity addition reached 55.57 GW during January to November 2025. That grid expansion supports transformer coil testing and liquid filled transformer service needs.
Who are the notable companies in the surge comparison testers market?
Megger, Electrom Instruments, SCHLEICH, Sourcetronic, and Hioki are the notable companies shaping this market.
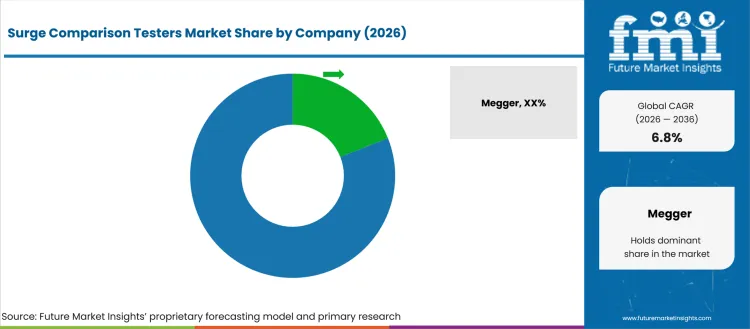
Supplier competition is organized around the buyer decision layer. Megger and Electrom Instruments are more relevant for repair shops and maintenance teams that need portable analyzers and clear reports. SCHLEICH and Sourcetronic become important once production buyers need fixtures, voltage ranges and automated evaluation. Hioki gains relevance in winding quality environments that value combined resistance and impulse testing. Buyer choice therefore depends on whether the problem is field diagnostics, production repeatability or laboratory-grade waveform analysis.
- Megger and Electrom Instruments are relevant in accounts that need portable motor analyzers and diagnostic reporting. Their role is practical due to repair-shop workflows that combine low-voltage checks, surge comparison and customer release records within one service process.
- Production test buyers often consider SCHLEICH and Sourcetronic for winding goods and configured test stations. These suppliers matter once a buyer needs fixtures and channel control. Waveform storage and repeatable pass-fail decisions support repeated coils or stators.
- Hioki is prominent in environments that need impulse winding tests near production quality checks. The ST4030A product scope is suited to motor winding manufacturers that want resistance measurement, insulation-withstand checks and impulse waveform comparison inside one workflow.
- Calibration and service partners influence final supplier choice in utility and OEM accounts. Their relevance increases once buyers need voltage traceability, report consistency and local support after purchase. This creates room for hardware vendors that can support documentation beyond the instrument sale.
Competitive Benchmarking: Surge Comparison Testers Market
| Company | Portable Diagnostic Relevance | Production Test Relevance | Voltage Range Depth | Service Reach |
|---|---|---|---|---|
| Megger | High | Medium | Strong | Global |
| Electrom Instruments | High | Medium | Strong | North America and Global |
| SCHLEICH | Medium | High | Strong | Global |
| Sourcetronic | Medium | High | Medium | Europe and Global |
| Hioki | Medium | High | Medium | Global |
Source: Future Market Insights competitive analysis, 2026. Ratings reflect relative portfolio relevance, workflow or project fit, service capability, and geographic reach.
Key Developments in the Surge Comparison Testers Market
- In January 2026, Megger published motor imbalance guidance explaining that surge testing applies controlled high-voltage pulses to motor windings. The guidance matters to this market due to operator demand for clearer fault explanation. It points to continued supplier focus on training and diagnostic confidence.
- In February 2025, SCHLEICH North America published a motor winding testing guide covering surge voltage and HiPot checks. The guide also explains insulation resistance checks. The action matters to surge comparison buyers due to the need for practical education around voltage stress and winding diagnostics. It supports service-led selling.
Key Players in the Surge Comparison Testers Market
Portable and Field Analyzers
- Megger
- Electrom Instruments
Production and Winding Test Systems
- SCHLEICH
- Sourcetronic
- Hioki
Surge Comparison Testers Market - Report Scope
| Coverage field | Report scope |
|---|---|
| Market breakdown | Surge Comparison Testers Market Breakdown By Tester Type, Voltage Range, Application, End Use, Sales Channel, and Region |
| Market Definition | Instruments and systems that apply controlled high-voltage pulses to windings and compare response waveforms before release or service decisions |
| Regions Covered | North America, Latin America, Europe, East Asia, South Asia and Pacific, Middle East and Africa |
| Countries Covered | United States, United Kingdom, Germany, France, Japan, China, South Korea, India and 30+ countries |
| Key Companies Profiled | Megger, Electrom Instruments, SCHLEICH, Sourcetronic, Hioki |
| Forecast Period | 2026 to 2036 |
| Approach | Hybrid bottom-up and top-down methodology using tester replacement cycles, voltage range needs, application mix, and country-level electrical equipment demand signals |
Surge Comparison Testers Market - Research Methodology
| Method | Approach |
|---|---|
| Primary Research | FMI analysts reviewed inputs from motor repair shops, electrical OEMs, utility maintenance teams and calibration service providers. Discussions focused on tester voltage range, waveform interpretation, reporting needs and service support. |
| Desk Research | Desk research covered government manufacturing data, grid reliability evidence, standards guidance and official supplier product pages. Product relevance was checked against surge testing, winding analysis, partial discharge and automated production test workflows. |
| Market Sizing and Forecasting | The model combined equipment replacement cycles, tester price bands, application use rates and country-level demand differences. Forecast assumptions were adjusted for automated winding production, repair-shop mobility needs and higher-voltage utility testing. |
| Data Validation | Forecasts were checked against supplier portfolios, official industrial data and electrical maintenance evidence. Duplicate external statistics were removed by assigning each public figure to one section before final writing. |
Surge Comparison Testers Market by Segments
Surge Comparison Testers Market segmented by Tester Type:
- Portable Surge Testers
- Benchtop Surge Testers
- Automated Winding Test Systems
- High-voltage Surge Analyzers
Surge Comparison Testers Market segmented by Voltage Range:
- <5 kV
- 5-15 kV
- >15 kV
Surge Comparison Testers Market segmented by Application:
- Motor Winding Testing
- Transformer Coil Testing
- Generator Testing
- Production Line QC
Surge Comparison Testers Market segmented by End Use:
- Motor Repair Shops
- Electrical OEMs
- Utilities
- Industrial Maintenance
Surge Comparison Testers Market segmented by Sales Channel:
- Direct OEM
- Electrical Test Distributors
- Calibration / Service Providers
Surge Comparison Testers Market by Region:
- North America
- United States
- Canada
- Mexico
- Latin America
- Brazil
- Chile
- Rest of Latin America
- Western Europe
- Germany
- UK
- Italy
- Spain
- France
- Nordic
- BENELUX
- Rest of Western Europe
- Eastern Europe
- Russia
- Poland
- Hungary
- Balkan & Baltic
- Rest of Eastern Europe
- East Asia
- China
- Japan
- South Korea
- South Asia and Pacific
- India
- ASEAN
- Australia & New Zealand
- Rest of South Asia and Pacific
- Middle East & Africa
- Kingdom of Saudi Arabia
- Other GCC Countries
- Turkiye
- South Africa
- Other African Union
- Rest of Middle East & Africa
Research Sources and Bibliography
- U.S. Department of Energy. (2024, February 22). DOE and industry team up to keep the lights on for America. U.S. Department of Energy.
- International Federation of Robotics. (2025, September 25). World Robotics 2025 report - industrial robots. International Federation of Robotics.
- U.S. Census Bureau. (2026, June 25). Monthly advance report on durable goods manufacturers shipments, inventories and orders May 2026. U.S. Department of Commerce.
- Megger. (2026, April 9). How can static testing diagnose electrical issues? Megger.
- Electrom Instruments. (2026). iTIG. Electrom Instruments.
- Schleich. (2026). Surge test. SCHLEICH.
- Hioki. (2026). Impulse Winding Tester ST4030A. Hioki.
- Schleich. (2026). IEEE 522-2023. SCHLEICH.
- Sourcetronic. (2026). Surge Tester ST2883S8-5. Sourcetronic.
- National Bureau of Statistics of China. (2026, January 20). Industrial production operation in December 2025. National Bureau of Statistics of China.
- Press Information Bureau. (2026, January 16). Year End Review of Ministry of Power - 2025. Government of India.
- U.S. Department of Energy. (2026, June 17). Distribution transformer webinar text alternative. U.S. Department of Energy.
- U.S. Department of Energy. (2024, July 5). Large Power Transformer Resilience. U.S. Department of Energy.
- Office for National Statistics. (2026, April 16). Index of Production, UK: February 2026. Office for National Statistics.
- Destatis. (2026, February 5). New orders in manufacturing in December 2025: +7.8% on the previous month. Federal Statistical Office of Germany.
- INSEE. (2026, June 5). In April 2026, manufacturing output increased by 0.4%. INSEE.
- Cabinet Office of Japan. (2026). Machinery Orders in December, 2025 and Forecast for Jan.-Mar. 2026. Cabinet Office of Japan.
- Ministry of Trade, Industry and Energy. (2026, January 2). Korea's annual exports reach new highs in 2025. MOTIR.
- Megger. (2026, January 5). Are you missing critical motor imbalance warning signs? Megger.
- Schleich North America. (2025, February 19). Surge voltage testers. Schleich North America.
- International Energy Agency. (2026, January). Grids - Electricity 2026 - Analysis. IEA.
- International Energy Agency. (2025, February 25). Rising component prices and supply chain pressures are hindering the development of transmission grid infrastructure. IEA.
This bibliography is provided for reader reference and uses primary government, standards-body, official trade body, and company sources.
This Report Answers
- What is the expected global value of the Surge Comparison Testers Market in 2026 and 2036?
- What CAGR is forecast for surge comparison testers during the 2026 to 2036 period?
- Which tester type category is used to assess portable surge tester demand in 2026?
- Why do motor repair shops and OEMs buy surge comparison testers for winding workflows?
- How does the 5-15 kV voltage range shape buyer shortlists?
- Which countries are compared in the surge comparison testers forecast?
- Which companies compete across portable analyzers and production winding test systems?
- What capabilities are included within the surge comparison testers definition?
- How does FMI size and forecast surge comparison tester demand across segments and countries?
- What implementation and supplier-selection factors should executives assess?
Frequently Asked Questions
Why should executives track the Surge Comparison Testers Market?
Executives should track this market because surge testing protects uptime by identifying hidden winding defects before motors generators or transformers return to service.
What business problem does the Surge Comparison Testers Market address?
It reveals turn to turn insulation weakness that low voltage tests cannot detect which helps prevent early failure after repair or production release.
What should procurement leaders evaluate before selecting suppliers?
Procurement leaders should evaluate voltage range waveform comparison capability reporting clarity calibration support operator training and local service access.
What can limit return on investment for buyers?
Return on investment can be limited by operator skill gaps incorrect voltage selection or lack of documented test procedures during release decisions.
How can suppliers build executive confidence?
Suppliers build confidence by delivering safe voltage control clear waveform comparison traceable reports and reliable post sale technical support.
Preview the report firsthand - request a free sample
Get SampleGet the brochure for pricing and purchase details.
Get PDFTable of Content
- Key Takeaways
- Market Size and CAGR
- Top Growth Driver
- Fastest Growing Segment
- Leading Region
- Key Companies
- Emerging Opportunities
- Executive Summary
- Global Market Outlook
- Demand-side Trends
- Supply-side Trends
- Technology Roadmap Analysis
- Analysis and Recommendations
- Analyst Perspective (What is happening? Why now? What should investors know?)
- Key Questions Answered
- How large is the market?
- What is the CAGR?
- What are key trends?
- Which region dominates?
- Who are the leaders?
- Market Overview
- Market Coverage / Taxonomy
- Market Definition / Scope / Limitations
- Research Methodology
- Chapter Orientation
- Analytical Lens and Working Hypotheses
- Market Structure, Signals, and Trend Drivers
- Benchmarking and Cross-market Comparability
- Market Sizing, Forecasting, and Opportunity Mapping
- Research Design and Evidence Framework
- Desk Research Programme (Secondary Evidence)
- Expert Input and Fieldwork (Primary Evidence)
- Tooling, Models, and Reference Databases
- Data Engineering and Model Build
- Quality Assurance and Audit Trail
- Market Background
- Market Dynamics (Drivers, Restraints, Opportunity, Trends)
- Scenario Forecast (Optimistic, Likely, Conservative)
- Impact Analysis
- AI Impact
- Sustainability Impact
- Regulatory Impact
- Technology Impact
- Consumer / Buyer Analysis
- Purchase Drivers
- Adoption Barriers
- Buyer Journey
- Opportunity Map Analysis
- Product Life Cycle Analysis
- Supply Chain Analysis
- Investment Feasibility Matrix
- Value Chain Analysis
- PESTLE and Porter's Analysis
- Regulatory Landscape
- Regional Parent Market Outlook
- Production and Consumption Statistics
- Import and Export Statistics
- Global Market Analysis and Forecast, 2021 to 2036
- Historical Market Size Value (USD Million) & Volume (Unit) Analysis, 2021 to 2025
- Current and Future Market Size Value (USD Million) & Volume (Unit) Projections, 2026 to 2036
- Y-o-Y Growth Trend Analysis
- Absolute $ Opportunity Analysis
- Global Market Pricing Analysis, 2021 to 2036
- Global Market Analysis and Forecast, By Tester Type, 2021 to 2036
- Introduction / Key Findings
- Historical Market Size Value (USD Million) & Volume (Unit) Analysis By Tester Type, 2021 to 2025
- Current and Future Market Size Value (USD Million) & Volume (Unit) Analysis and Forecast By Tester Type, 2026 to 2036
- Portable Surge Testers
- Benchtop Surge Testers
- High-voltage Surge Analyzers
- Automated Winding Test Systems
- Portable Surge Testers
- Y-o-Y Growth Trend Analysis By Tester Type, 2021 to 2025
- Absolute $ Opportunity Analysis By Tester Type, 2026 to 2036
- Global Market Analysis and Forecast, By Voltage Range, 2021 to 2036
- Introduction / Key Findings
- Historical Market Size Value (USD Million) & Volume (Unit) Analysis By Voltage Range, 2021 to 2025
- Current and Future Market Size Value (USD Million) & Volume (Unit) Analysis and Forecast By Voltage Range, 2026 to 2036
- 5-15 kV
- <5 kV
- >15 kV
- 5-15 kV
- Y-o-Y Growth Trend Analysis By Voltage Range, 2021 to 2025
- Absolute $ Opportunity Analysis By Voltage Range, 2026 to 2036
- Global Market Analysis and Forecast, By Application, 2021 to 2036
- Introduction / Key Findings
- Historical Market Size Value (USD Million) & Volume (Unit) Analysis By Application, 2021 to 2025
- Current and Future Market Size Value (USD Million) & Volume (Unit) Analysis and Forecast By Application, 2026 to 2036
- Motor Winding Testing
- Transformer Coil Testing
- Production Line QC
- Generator Testing
- Motor Winding Testing
- Y-o-Y Growth Trend Analysis By Application, 2021 to 2025
- Absolute $ Opportunity Analysis By Application, 2026 to 2036
- Global Market Analysis and Forecast, By End Use, 2021 to 2036
- Introduction / Key Findings
- Historical Market Size Value (USD Million) & Volume (Unit) Analysis By End Use, 2021 to 2025
- Current and Future Market Size Value (USD Million) & Volume (Unit) Analysis and Forecast By End Use, 2026 to 2036
- Motor Repair Shops
- Electrical OEMs
- Industrial Maintenance
- Utilities
- Motor Repair Shops
- Y-o-Y Growth Trend Analysis By End Use, 2021 to 2025
- Absolute $ Opportunity Analysis By End Use, 2026 to 2036
- Global Market Analysis and Forecast, By Sales Channel, 2021 to 2036
- Introduction / Key Findings
- Historical Market Size Value (USD Million) & Volume (Unit) Analysis By Sales Channel, 2021 to 2025
- Current and Future Market Size Value (USD Million) & Volume (Unit) Analysis and Forecast By Sales Channel, 2026 to 2036
- Direct OEM
- Electrical Test Distributors
- Calibration / Service Providers
- Direct OEM
- Y-o-Y Growth Trend Analysis By Sales Channel, 2021 to 2025
- Absolute $ Opportunity Analysis By Sales Channel, 2026 to 2036
- Global Market Analysis and Forecast, By Region, 2021 to 2036
- Introduction
- Historical Market Size Value (USD Million) & Volume (Unit) Analysis By Region, 2021 to 2025
- Current Market Size Value (USD Million) & Volume (Unit) Analysis and Forecast By Region, 2026 to 2036
- North America
- Latin America
- Western Europe
- Eastern Europe
- East Asia
- South Asia and Pacific
- Middle East & Africa
- Market Attractiveness Analysis By Region
- North America Market Analysis and Forecast, By Country, 2021 to 2036
- Historical Market Size Value (USD Million) & Volume (Unit) Trend Analysis By Market Taxonomy, 2021 to 2025
- Market Size Value (USD Million) & Volume (Unit) Forecast By Market Taxonomy, 2026 to 2036
- By Country
- USA
- Canada
- Mexico
- By Tester Type
- By Voltage Range
- By Application
- By End Use
- By Sales Channel
- By Country
- Market Attractiveness Analysis
- By Country
- By Tester Type
- By Voltage Range
- By Application
- By End Use
- By Sales Channel
- Key Takeaways
- Latin America Market Analysis and Forecast, By Country
- Historical Market Size Value (USD Million) & Volume (Unit) Trend Analysis By Market Taxonomy, 2021 to 2025
- Market Size Value (USD Million) & Volume (Unit) Forecast By Market Taxonomy, 2026 to 2036
- By Country
- Brazil
- Chile
- Rest of Latin America
- By Tester Type
- By Voltage Range
- By Application
- By End Use
- By Sales Channel
- By Country
- Market Attractiveness Analysis
- By Country
- By Tester Type
- By Voltage Range
- By Application
- By End Use
- By Sales Channel
- Key Takeaways
- Western Europe Market Analysis and Forecast, By Country
- Historical Market Size Value (USD Million) & Volume (Unit) Trend Analysis By Market Taxonomy, 2021 to 2025
- Market Size Value (USD Million) & Volume (Unit) Forecast By Market Taxonomy, 2026 to 2036
- By Country
- Germany
- UK
- Italy
- Spain
- France
- Nordic
- BENELUX
- Rest of Western Europe
- By Tester Type
- By Voltage Range
- By Application
- By End Use
- By Sales Channel
- By Country
- Market Attractiveness Analysis
- By Country
- By Tester Type
- By Voltage Range
- By Application
- By End Use
- By Sales Channel
- Key Takeaways
- Eastern Europe Market Analysis and Forecast, By Country
- Historical Market Size Value (USD Million) & Volume (Unit) Trend Analysis By Market Taxonomy, 2021 to 2025
- Market Size Value (USD Million) & Volume (Unit) Forecast By Market Taxonomy, 2026 to 2036
- By Country
- Russia
- Poland
- Hungary
- Balkan & Baltic
- Rest of Eastern Europe
- By Tester Type
- By Voltage Range
- By Application
- By End Use
- By Sales Channel
- By Country
- Market Attractiveness Analysis
- By Country
- By Tester Type
- By Voltage Range
- By Application
- By End Use
- By Sales Channel
- Key Takeaways
- East Asia Market Analysis and Forecast, By Country
- Historical Market Size Value (USD Million) & Volume (Unit) Trend Analysis By Market Taxonomy, 2021 to 2025
- Market Size Value (USD Million) & Volume (Unit) Forecast By Market Taxonomy, 2026 to 2036
- By Country
- China
- Japan
- South Korea
- By Tester Type
- By Voltage Range
- By Application
- By End Use
- By Sales Channel
- By Country
- Market Attractiveness Analysis
- By Country
- By Tester Type
- By Voltage Range
- By Application
- By End Use
- By Sales Channel
- Key Takeaways
- South Asia and Pacific Market Analysis and Forecast, By Country
- Historical Market Size Value (USD Million) & Volume (Unit) Trend Analysis By Market Taxonomy, 2021 to 2025
- Market Size Value (USD Million) & Volume (Unit) Forecast By Market Taxonomy, 2026 to 2036
- By Country
- India
- ASEAN
- Australia & New Zealand
- Rest of South Asia and Pacific
- By Tester Type
- By Voltage Range
- By Application
- By End Use
- By Sales Channel
- By Country
- Market Attractiveness Analysis
- By Country
- By Tester Type
- By Voltage Range
- By Application
- By End Use
- By Sales Channel
- Key Takeaways
- Middle East & Africa Market Analysis and Forecast, By Country
- Historical Market Size Value (USD Million) & Volume (Unit) Trend Analysis By Market Taxonomy, 2021 to 2025
- Market Size Value (USD Million) & Volume (Unit) Forecast By Market Taxonomy, 2026 to 2036
- By Country
- Kingdom of Saudi Arabia
- Other GCC Countries
- Türkiye
- South Africa
- Other African Union
- Rest of Middle East & Africa
- By Tester Type
- By Voltage Range
- By Application
- By End Use
- By Sales Channel
- By Country
- Market Attractiveness Analysis
- By Country
- By Tester Type
- By Voltage Range
- By Application
- By End Use
- By Sales Channel
- Key Takeaways
- Key Countries Market Analysis
- USA
- Pricing Analysis
- Market Share Analysis, 2025
- By Tester Type
- By Voltage Range
- By Application
- By End Use
- By Sales Channel
- Canada
- Pricing Analysis
- Market Share Analysis, 2025
- By Tester Type
- By Voltage Range
- By Application
- By End Use
- By Sales Channel
- Mexico
- Pricing Analysis
- Market Share Analysis, 2025
- By Tester Type
- By Voltage Range
- By Application
- By End Use
- By Sales Channel
- Brazil
- Pricing Analysis
- Market Share Analysis, 2025
- By Tester Type
- By Voltage Range
- By Application
- By End Use
- By Sales Channel
- Chile
- Pricing Analysis
- Market Share Analysis, 2025
- By Tester Type
- By Voltage Range
- By Application
- By End Use
- By Sales Channel
- Germany
- Pricing Analysis
- Market Share Analysis, 2025
- By Tester Type
- By Voltage Range
- By Application
- By End Use
- By Sales Channel
- UK
- Pricing Analysis
- Market Share Analysis, 2025
- By Tester Type
- By Voltage Range
- By Application
- By End Use
- By Sales Channel
- Italy
- Pricing Analysis
- Market Share Analysis, 2025
- By Tester Type
- By Voltage Range
- By Application
- By End Use
- By Sales Channel
- Spain
- Pricing Analysis
- Market Share Analysis, 2025
- By Tester Type
- By Voltage Range
- By Application
- By End Use
- By Sales Channel
- France
- Pricing Analysis
- Market Share Analysis, 2025
- By Tester Type
- By Voltage Range
- By Application
- By End Use
- By Sales Channel
- India
- Pricing Analysis
- Market Share Analysis, 2025
- By Tester Type
- By Voltage Range
- By Application
- By End Use
- By Sales Channel
- ASEAN
- Pricing Analysis
- Market Share Analysis, 2025
- By Tester Type
- By Voltage Range
- By Application
- By End Use
- By Sales Channel
- Australia & New Zealand
- Pricing Analysis
- Market Share Analysis, 2025
- By Tester Type
- By Voltage Range
- By Application
- By End Use
- By Sales Channel
- China
- Pricing Analysis
- Market Share Analysis, 2025
- By Tester Type
- By Voltage Range
- By Application
- By End Use
- By Sales Channel
- Japan
- Pricing Analysis
- Market Share Analysis, 2025
- By Tester Type
- By Voltage Range
- By Application
- By End Use
- By Sales Channel
- South Korea
- Pricing Analysis
- Market Share Analysis, 2025
- By Tester Type
- By Voltage Range
- By Application
- By End Use
- By Sales Channel
- Russia
- Pricing Analysis
- Market Share Analysis, 2025
- By Tester Type
- By Voltage Range
- By Application
- By End Use
- By Sales Channel
- Poland
- Pricing Analysis
- Market Share Analysis, 2025
- By Tester Type
- By Voltage Range
- By Application
- By End Use
- By Sales Channel
- Hungary
- Pricing Analysis
- Market Share Analysis, 2025
- By Tester Type
- By Voltage Range
- By Application
- By End Use
- By Sales Channel
- Kingdom of Saudi Arabia
- Pricing Analysis
- Market Share Analysis, 2025
- By Tester Type
- By Voltage Range
- By Application
- By End Use
- By Sales Channel
- Türkiye
- Pricing Analysis
- Market Share Analysis, 2025
- By Tester Type
- By Voltage Range
- By Application
- By End Use
- By Sales Channel
- South Africa
- Pricing Analysis
- Market Share Analysis, 2025
- By Tester Type
- By Voltage Range
- By Application
- By End Use
- By Sales Channel
- USA
- Market Structure Analysis
- Competition Dashboard
- Competition Benchmarking
- Market Share Analysis of Top Players
- By Regional
- By Tester Type
- By Voltage Range
- By Application
- By End Use
- By Sales Channel
- Emerging Startups
- Innovation Benchmarking
- Competition Analysis
- Competition Deep Dive
- Megger
- Overview
- Product Portfolio
- Profitability by Market Segments (Product/Region/Sales Channel)
- Sales Footprint
- Strategy Overview
- Marketing Strategy
- Product Strategy
- Channel Strategy
- Electrom Instruments
- SCHLEICH
- Sourcetronic
- Hioki
- Megger
- Case Studies
- Success Stories
- Recent Developments
- Competition Deep Dive
- Assumptions & Acronyms Used


