
- Market Size (2026)
- USD 2.9 Bn
- Forecast (2036)
- USD 7.1 Bn
- CAGR (2026 to 2036)
- 9.5%
How Big Is the Time Tracking Software Market in 2026?
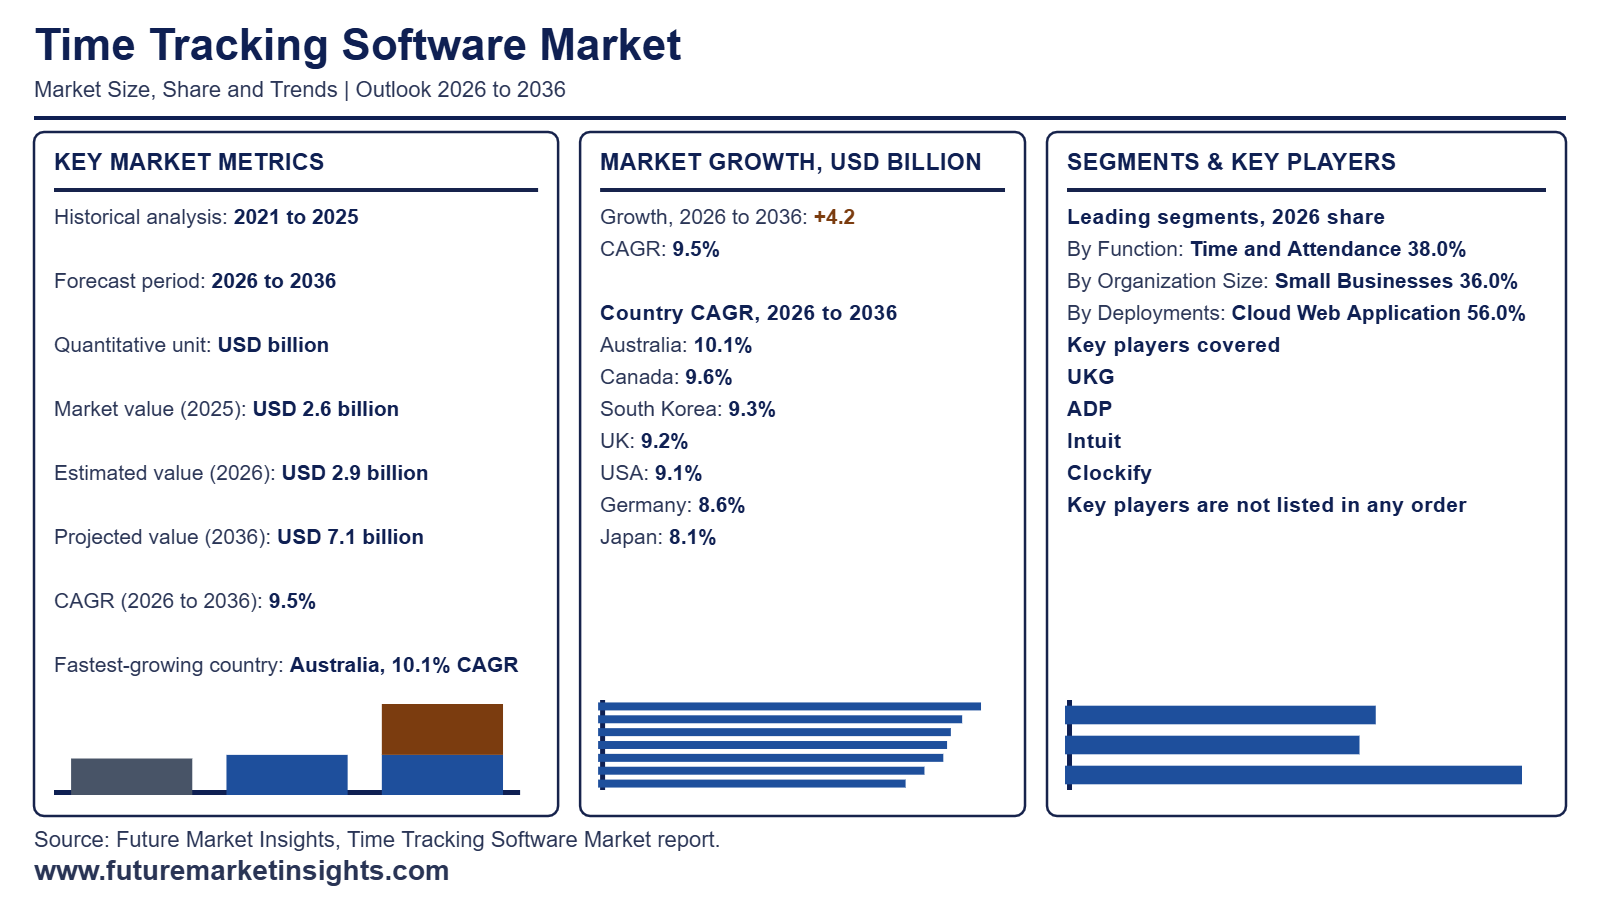
The global time tracking software market is valued at USD 2.9 billion in 2026, up from USD 2.6 billion in 2025, and is projected by Future Market Insights (FMI) to reach USD 7.1 billion by 2036, expanding at a 9.5% CAGR over the 2026 to 2036 forecast period.
| Market Metric | Valuation / Share / Forecast Benchmark |
|---|---|
| 2025 Market Size (Historical) | USD 2.6 billion |
| 2026 Market Size (Estimated) | USD 2.9 billion |
| 2036 Market Size (Projected) | USD 7.1 billion |
| Compound Annual Growth Rate (2026 to 2036) | 9.5% CAGR |
| Incremental Dollar Opportunity (2026 to 2036) | USD 4.2 billion |
| Dominant Function (2026 to 2036 Share) | Time and Attendance (38.0% in 2026, rising to 39.2% by 2036) |
| Leading & Fastest-Growing Functions | Time and Attendance (38.0% share in 2026; 9.7% CAGR) | Automatic Time Capture (12.5% CAGR) |
| Leading & Fastest-Growing Deployments | Cloud Web Application (56.0% share in 2026; 9.9% CAGR) | Mobile Application (12.0% CAGR) |
| Leading & Fastest-Growing End Uses | IT and Business Services (29.0% share in 2026; 9.8% CAGR) | Construction and Field Services (11.5% CAGR) |
| Largest Country Markets (2026 Global Share) | USA (39.0%), UK (9.0%), Germany (8.0%) |
| Fastest-Growing Country Markets (2026 to 2036) | Australia (10.1% CAGR), Canada (9.6% CAGR), South Korea (9.3% CAGR) |
| Leading Tier-1 Companies | UKG, ADP, Intuit, Clockify |
Source: Future Market Insights analysis of the time tracking software market, 2026.
Executive Market Overview
Employers adopt time tracking because accurate hours feed payroll and client billing while giving managers a defense against wage claims. Federal enforcement shows the exposure as the Wage and Hour Division recovered more than USD 259 million in back wages for 176,957 workers in fiscal 2025 (US Department of Labor 2025). Payroll growth keeps the base widening with 165,000 jobs added in October (Bureau of Labor Statistics 2026). Time and Attendance holds 38.0% of Function revenue at a 9.7% CAGR while Automatic Time Capture advances fastest at 12.5% as passive tracking removes manual entry. Cloud Web Application captures 56.0% of Deployment and Mobile Application grows fastest at 12.0% as field and hybrid staff clock in from phones.
Bundling by payroll and workforce suites is the restraint specific to this market since UKG and ADP include timekeeping inside broader platforms and set a price anchor for standalone tools. Construction and Field Services is the fastest-growing End Use at 11.5% while IT and Business Services holds 29.0% at 9.8%. Australia is the fastest-growing country at a 10.1% CAGR ahead of Canada at 9.6% and South Korea at 9.3% as employers tighten labor cost control. The UK at 9.2% and the USA at 9.1% sit alongside Germany at 8.6% and Japan at 8.1% within workforce management and project management software deployments. Small Businesses hold 36.0% of Organization Size with 9.8% and Freelancers and Individuals rise fastest at 12.0%. Sizing covers software that records hours worked and billable time while excluding payroll processing and broader HR suites.
Analyst Perspective
The time tracking software market is expanding as remote and hybrid teams seek accurate visibility into work hours and project costs. Vendors that connect tracking with payroll and analytics tools will strengthen customer retention and grow subscription revenue across small and large organizations.
- Sudip Saha, Principal Consultant, Future Market Insights.
Major Market Trends and Insights
- Free Plan Limits Steer Small Teams Toward Paid Time Tracking: Vendors that once offered unlimited free seats are redrawing the line between free and paid tiers because supporting very large free user bases carries real infrastructure cost. Features tied to billing and reporting now sit behind subscriptions. CAKE.com (April 2026) capped the Clockify free plan at 5 users and moved billable hours and CSV or Excel report export to paid plans. Free workspaces also face an API allowance of 30 requests per hour. Small firms that depend on invoicing and data export have a clear reason to upgrade and vendors gain steadier recurring revenue. Paid tiers then become the home for advanced reporting.
- UK Holiday Record Duty Widens Demand for Auditable Time Systems: Employers in Great Britain must now prove leave compliance rather than assume it so spreadsheets and rota notes give way to systems that store leave and pay history. From 6 April 2026 the Employment Rights Act 2025 requires adequate holiday and holiday pay records kept for six years and covering irregular hours and part year workers as summarized by DAC Beachcroft (2026). The duty is enforced through criminal penalties. Time tracking vendors that link attendance with leave balances and pay elements meet the duty in one place and gain a compliance led reason to sell. Employers gain audit ready history on demand.
- AI Assistants Move Into Hourly Workforce Platforms as Clock Data Grows: Platforms built around clocking in are adding assistants that act on the data they already hold so administrators spend less time on routine tasks. Homebase (October 2026) launched Homebase Assistant on 20 October 2026 after earlier hiring scheduling and payroll assistants that have handled more than 4.7 million administrative tasks. Connecteam (October 2026) added a feature that calculates flat pay on clock-out so variable payouts such as mileage reimbursements land on the timesheet. Automation of this kind raises the stickiness of platforms that hold the full record from shift to paycheck. Administrators can then focus on scheduling quality.
What Are the Main Drivers, Restraints, and Opportunities?
Recording duties push employers toward digital timekeeping while free tool expectations squeeze paid conversion and that tension rewards mobile and automatic capture built around job costing for contractors and field teams in Australia and Canada and South Korea.
Driver: Statutory Recording Duties Anchor Time and Attendance Demand
Recording working time has moved from a managerial choice to an employer duty in Germany. The Federal Labour Court ruled that the whole working time of employees must be recorded and BMAS (August 2025) says employers must follow this today regardless of any future amendment. BMAS (May 2026) published the labour minister’s wish to pass mandatory electronic recording together with the Working Time Act change. Handwritten records still pass for now so the electronic step becomes the buying moment for cloud time and attendance suppliers serving German employers and multinational firms with German sites. Audit ready records then become a routine buyer requirement.
Restraint: Free Tier Habits Compress Paid Conversion
Small teams reach time tracking through free tools and expect core functions for free so suppliers carry infrastructure cost for unlimited users before revenue appears. CAKE.com (April 2026) answered by limiting the Clockify free plan to small teams and moving kiosk and billable hour functions plus exports into paid plans while existing paid users kept their terms. ADP (July 2026) sells time management inside a payroll and HR bundle for more than a million clients which gives it a bundling edge over stand-alone vendors. Independent suppliers in the USA and UK must weigh freemium reach against paid upgrades inside wider project management software suites.
Opportunity: Mobile Capture Opens Contractor and Field Crew Accounts
Crews on job sites work away from desks so hours must be captured by phone with location and job codes instead of typed later. Intuit (August 2026) reported that its Construction Edition launch lifted customer additions in construction. FMI sees Automatic Time Capture as the fastest function and Mobile Application as the fastest deployment with Construction and Field Services the fastest end use while Australia and Canada and South Korea lead country growth. Vendors that attach job costing to mobile capture can sell to contractors and field service firms in those countries through construction management software and field service management partners.
How Is the Time Tracking Software Market Segmented?
The global time tracking software market is organized by function and deployment and organization size and end use and region with each axis describing a different purchase criterion and summing to the whole market.
| Segmentation Axis | Sub-Segments Covered | 2026 Leading Segment and Share | Main Growth Benchmark (2026 to 2036) |
|---|---|---|---|
| Function | Time and Attendance / Project and Timesheet Tracking / Automatic Time Capture / Billable Hours and Invoicing / Productivity Monitoring | Time and Attendance (38.0% revenue share) | Time and Attendance share rises to 39.2% by 2036 at 9.7% CAGR |
| Deployment | Cloud Web Application / Mobile Application / On-Premise / Desktop Installed | Cloud Web Application (56.0% revenue share) | Cloud Web Application share rises to 58.1% by 2036 at 9.9% CAGR |
| Organization Size | Small Businesses / Mid-Sized Businesses / Large Enterprises / Freelancers and Individuals | Small Businesses (36.0% revenue share) | Small Businesses grows at 9.4% CAGR to a 35.7% share by 2036 |
| End Use | IT and Business Services / Professional and Legal Services / Construction and Field Services / Retail and Hospitality / Healthcare | IT and Business Services (29.0% revenue share) | IT and Business Services share rises to 29.8% by 2036 at 9.8% CAGR |
| Region | North America / Latin America / Western Europe / Eastern Europe / East Asia / South Asia and Pacific / Middle East and Africa | United States (39.0% global country share) | Australia leads country growth at 10.1% CAGR |
Source. Future Market Insights analysis of the time tracking software market 2026.
Why Does Time and Attendance Lead by Function?
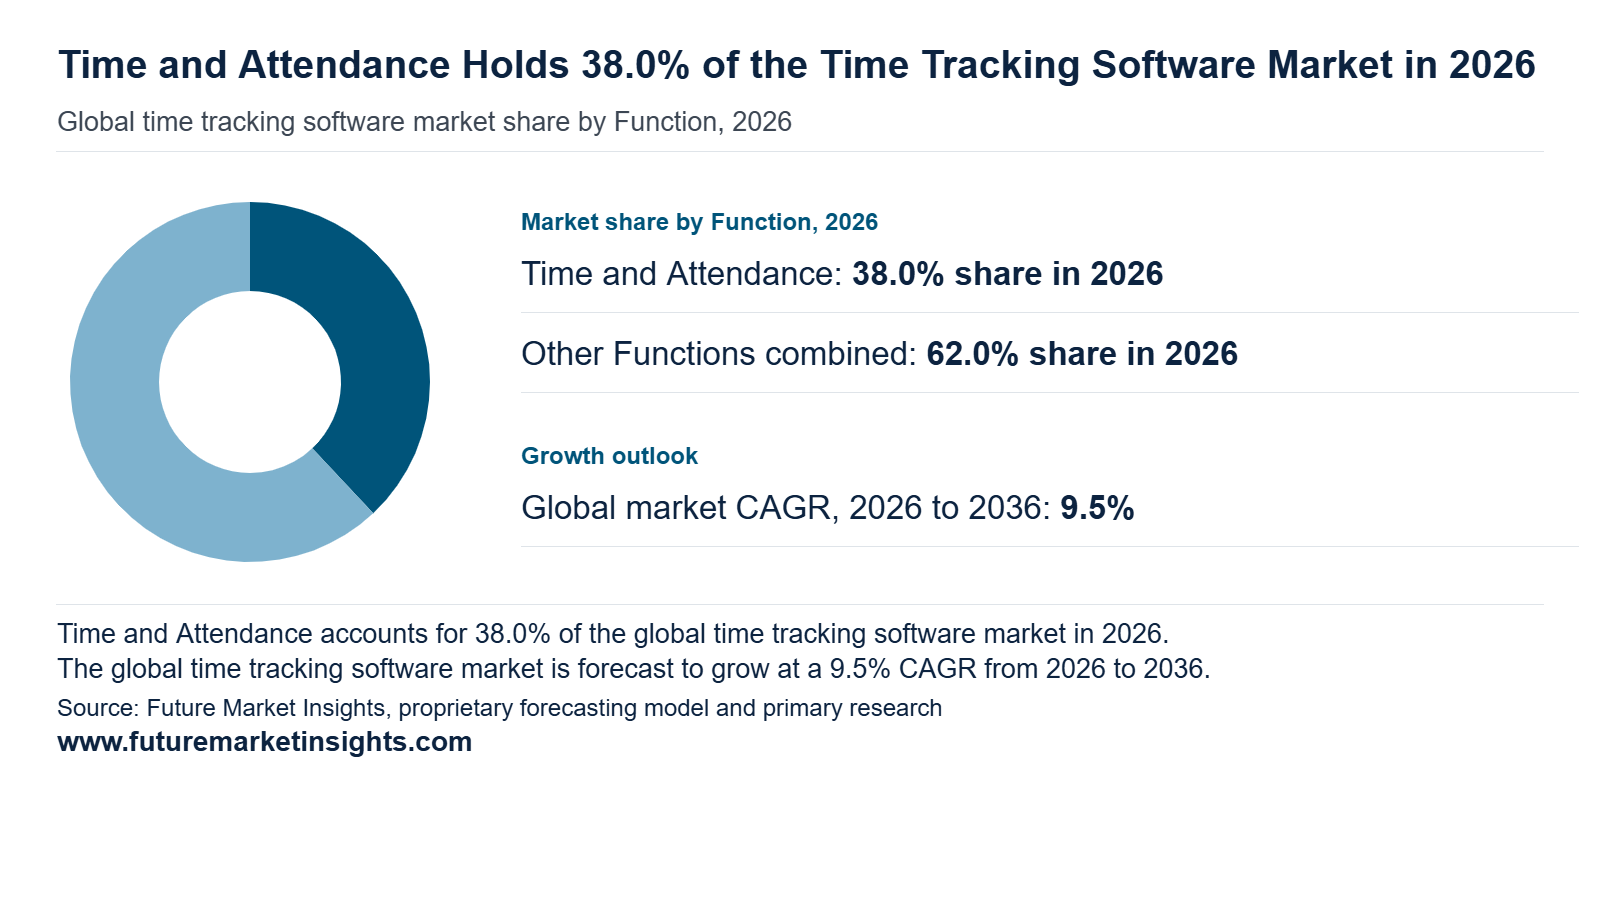
Time and attendance leads by function with a 38.0% share in 2026 and is projected to reach 39.2% by 2036 at a 9.7% CAGR. Employers need defensible hours records for payroll accuracy under the US Fair Labor Standards Act and EU working time rules that national courts read as requiring systematic recording. UKG and ADP embed clocks and approvals directly in payroll suites which keeps switching effort modest for customers. Analytics on overtime and absence feed workforce analytics programs run by HR teams. Project and timesheet tracking and automatic capture and billable hours and productivity monitoring extend the same data into costing and invoicing.
Why Do Cloud Web Applications Lead by Deployment?
Browser delivery lets finance and HR teams roll out tracking across offices and remote staff in days with updates handled by the vendor. Cloud web applications lead by deployment with a 56.0% share in 2026 and are projected to reach 58.1% by 2036 at a 9.9% CAGR. Subscription pricing per user suits small and mid-sized firms that avoid server upkeep. Mobile apps used by crews linked to field service management systems add geofenced clock-ins and photo notes from job sites. Intuit and Clockify and Toggl sell web-first plans that integrate with accounting and payroll tools. On-premise and desktop installed options serve firms with defined data residency rules.
Why Do Small Businesses Lead by Organization Size?
Free and freemium tiers from Homebase and Connecteam lower the first step into the category. Accountants and bookkeepers recommend tools that sync with QuickBooks and Xero which shortens onboarding. Small businesses lead by organization size with a 36.0% share in 2026 and are projected to account for 35.7% by 2036 at a 9.4% CAGR. Owners of cafes and clinics and trade firms replace paper sheets and spreadsheets with low-cost apps priced per employee to cut payroll errors and speed up payday. Mid-sized businesses and large enterprises and freelancers and individuals buy deeper configuration and reporting or lighter personal tracking.
Why Do IT and Business Services Lead by End Use?
Delivery teams working inside project management software want entries captured where tasks live which favors integrated trackers. Distributed teams across India and the Philippines and Eastern Europe need audit-ready logs for client contracts. IT and business services lead by end use with a 29.0% share in 2026 and are projected to reach 29.8% by 2036 at a 9.8% CAGR. Consultancies and software firms and outsourcers bill clients by the hour or by sprint so accurate time data links directly to revenue recognition. Professional and legal services and construction and field services and retail and hospitality and healthcare follow with compliance-driven and scheduling-driven needs.
Time Tracking Software Market by Region and Country (2026 to 2036)
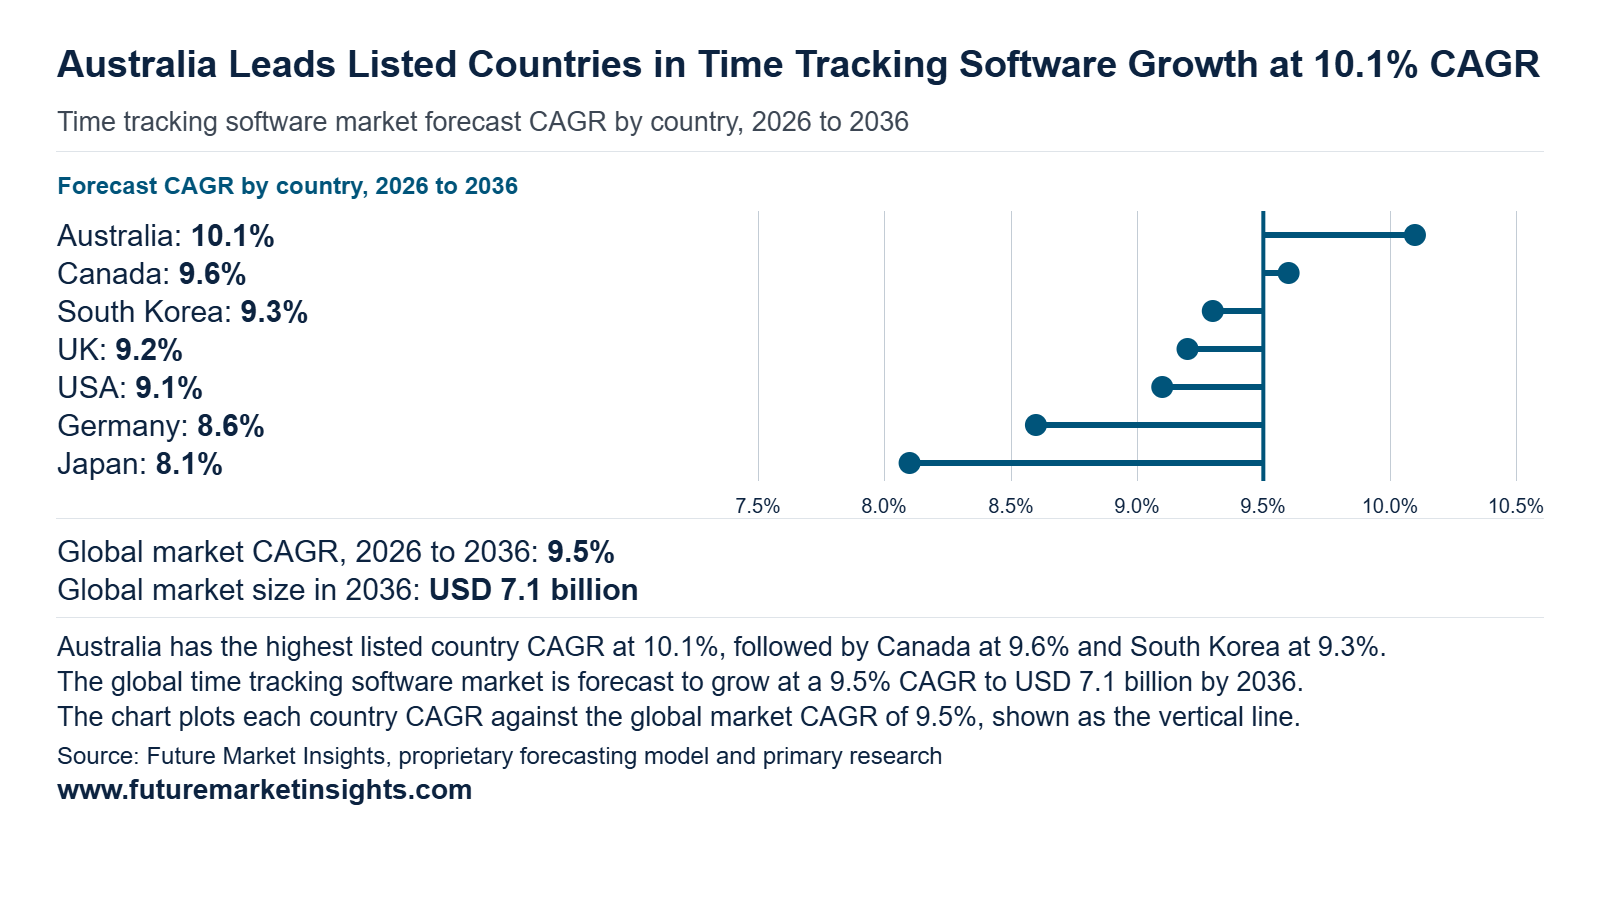
Time tracking software sells wherever labor law asks employers to prove hours worked. Seven countries are profiled across North America (USA and Canada), Western Europe (UK and Germany), East Asia (Japan and South Korea) and South Asia and Pacific (Australia). Australia grows fastest while Canada and South Korea follow. The USA remains the largest buyer.
| Country | 2026 Revenue (USD billion) | 2036 Revenue (USD billion) | 10-Year Addition (USD billion) | 2026 to 2036 CAGR | Global Share (2026 → 2036) |
|---|---|---|---|---|---|
| Australia | 0.15 | 0.39 | 0.24 | 10.1% | 3.5% → 3.8% |
| Canada | 0.17 | 0.42 | 0.25 | 9.6% | 4.0% → 4.1% |
| South Korea | 0.08 | 0.20 | 0.12 | 9.3% | 2.0% → 2.0% |
| UK | 0.38 | 0.91 | 0.53 | 9.2% | 9.0% → 9.0% |
| USA | 1.64 | 3.91 | 2.27 | 9.1% | 39.0% → 38.6% |
| Germany | 0.34 | 0.77 | 0.43 | 8.6% | 8.0% → 7.6% |
| Japan | 0.21 | 0.46 | 0.25 | 8.1% | 5.0% → 4.5% |
| Rest of World | 1.24 | 3.07 | 1.83 | 9.5% | 29.5% → 30.3% |
Source: Future Market Insights analysis of the time tracking software market, 2026.
Australia
A 10.1% CAGR makes Australia the fastest-growing country in time tracking software and moves its global share from 3.5% in 2026 to 3.8% by 2036. Since January 1 2025 intentional underpayment of wages has been a criminal offense under federal workplace rules. Time and wages records must be kept for 7 years. A pay slip is due within one working day of payment. Cafes and care providers and retail chains with rostered staff want hours captured at the moment of work and passed straight to payroll. Records that satisfy an inspector have become part of everyday management and sign-ups keep widening.
Canada
Home-only work covered 11.4% and hybrid arrangements covered 9.8%. Hybrid work stood at 6.4% in May 2022. Clinics and building sites and stores need clock-in on a phone while head offices log hours from home desks. Canada posts a 9.6% CAGR and edges from 4.0% to 4.1% of global revenue. Work location is the local story. Statistics Canada reported in June 2026 that 78.8% of employed Canadians worked fully outside the home in May. Provincial overtime rules differ so a single platform covering every site appeals to national employers. Multi-site buyers value one dashboard for every province and every shift.
South Korea
Eligible firms have 20 or more employees and agree a shorter week such as four and a half days. Labor and management and government also agreed on curbs on misuse of comprehensive wage systems. A subsidy claim rests on proof of real hours. Small manufacturers and service companies see a clear payoff in logging time digitally. South Korea adds a 9.3% CAGR while its 2.0% share holds steady. Public policy pushes firms to measure real hours. The Ministry of Employment and Labor (February 2026) funds KRW 200 thousand to 600 thousand a month for each worker whose actual hours shrink while pay stays intact.
UK
From April 6 2026 employers keep annual leave and holiday pay records for at least six years. The Fair Work Agency was established on April 7 2026 and enforces holiday pay and statutory sick pay. Sitting at 9.0% of global revenue in 2026 the UK is the second largest profiled market and posts a 9.2% CAGR. Statute sets the timetable. The Employment Rights Act 2025 became law on December 18 2025. Shift-based operators in hospitality and care and retail are moving leave and hours into one system that can be shown to inspectors.
USA
Wage and Hour Division recovered more than USD 259 million in back wages for nearly 177 thousand workers in fiscal year 2025 which is the highest since 2019. The USA is the anchor at 39.0% of 2026 global revenue and grows at a 9.1% CAGR that ranks fifth among the profiled countries. Enforcement results explain the demand. The Overtime math across many sites keeps hospitals and warehouses and restaurant chains focused on clean hour data. Platforms tied to payroll and scheduling win the budget. Payroll teams then reconcile fewer disputes after each pay cycle. The share eases slightly to 38.6% by 2036 as other countries grow faster.
Germany
Germany grows at an 8.6% CAGR from an 8.0% share and reaches 7.6% by 2036. The courts moved first and lawmakers are following. On September 13 2022 the Federal Labour Court ruled that employers record the entire working time of employees. The federal government plans to write an electronic recording duty into the Working Time Act. The present minimum covers start and end and duration of each day and handwritten notes still qualify. Mid-sized manufacturers and service firms are replacing paper sheets before the rule arrives to avoid a rushed switch. That head start also eases audits and works council talks.
Japan
Hospitals and builders and delivery fleets watch monthly overtime closely and digital attendance records make that routine. Buyers in construction and logistics add seats as compliance checks continue. Clinics and fleet operators follow a similar pattern. The share settles at 4.5% by 2036. Japan carries a 5.0% share and the lowest CAGR of the group at 8.1% which reflects an established buyer base. Overtime is capped in principle at 45 hours a month and 360 hours a year. Violations can bring up to six months of imprisonment or a fine of up to ¥300000. The cap reached construction and automobile driving and medicine in April 2024.
Competitive Environment and Notable Companies
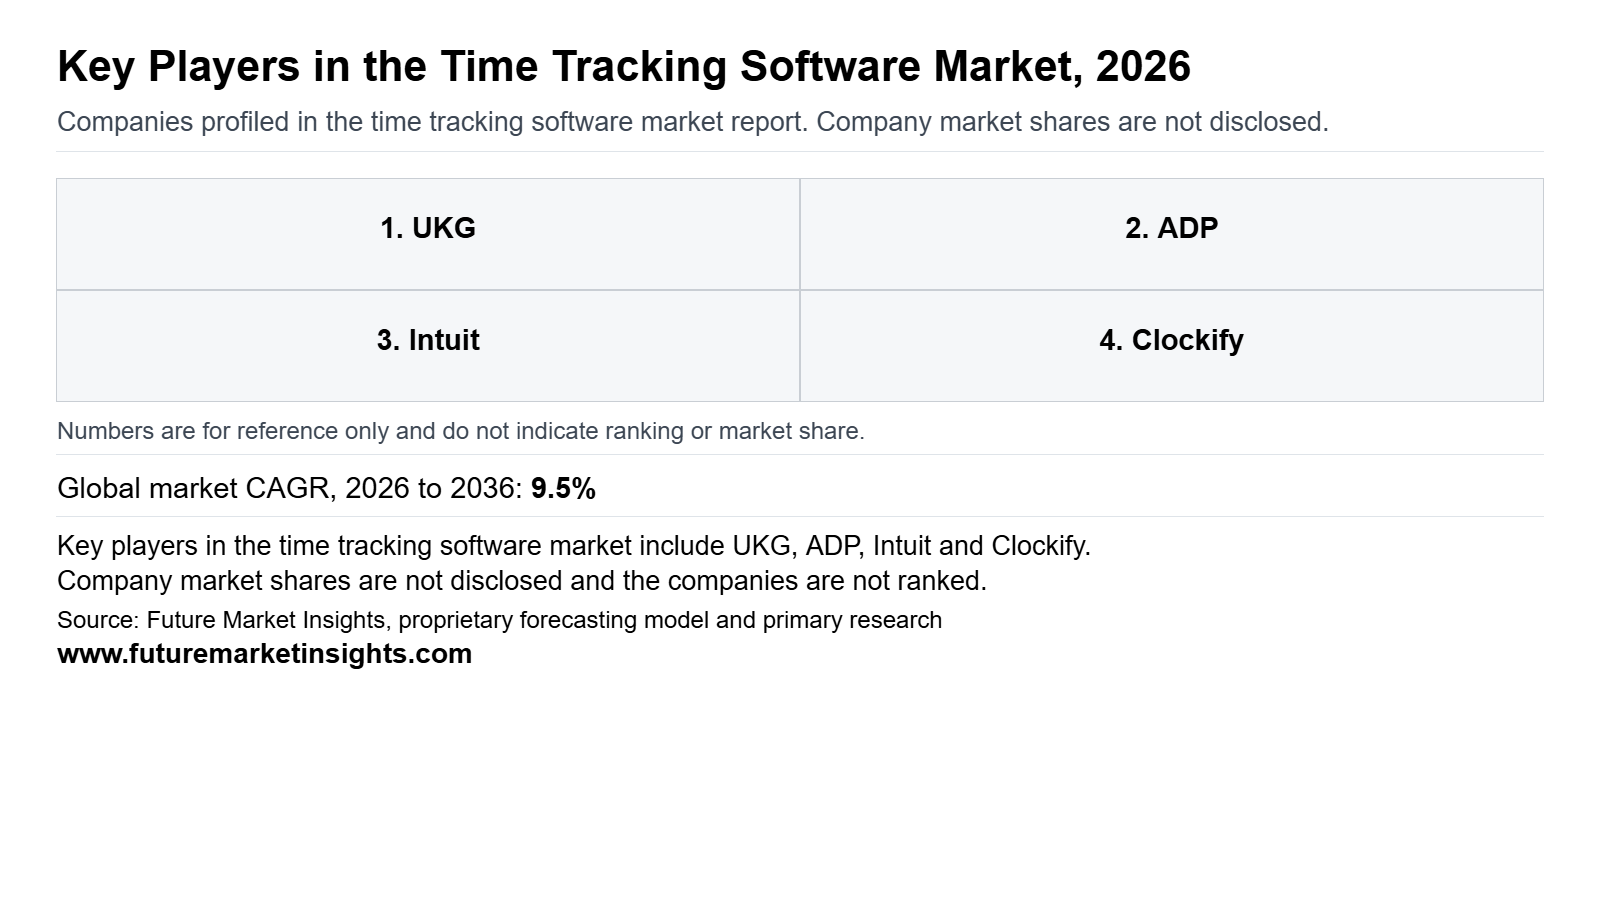
Notable companies in the global time tracking software market include UKG, ADP, Intuit, Clockify, Toggl, Harvest, Hubstaff, Deputy, Replicon, and Timely. Competition forms at two structural levels. Workforce platform providers such as UKG and ADP and Intuit and Replicon fold time capture into payroll and compliance and HR suites for larger employers. Specialist tools such as Clockify and Toggl and Harvest and Hubstaff and Timely compete on ease of use and project insight and integration breadth while Deputy serves shift-based teams. Platform depth and a large installed base keep UKG as the leading company. Payroll links and AI assistant connections and cross-border payout options show the clearest partnership scope beyond the core markets.
How Are Companies Positioned in the Time Tracking Software Market?
Positioning follows the buyer’s size and the surrounding suite. UKG reports that more than 80000 organizations worldwide use its platform (UKG, March 2026). ADP placed its WorkForce Suite inside Workforce Now and Lyric HCM and Global Payroll for organizations with 150 or more employees (ADP, November 2025). Intuit embeds time tracking and payroll and accounting data within QuickBooks Workforce for small and mid-market businesses (Intuit, May 2026). Time capture is therefore becoming a feature of larger operating suites.
What Matters When a Buyer Selects a Time Tracking Software Supplier?
Buyers favor accurate pay outcomes and rule coverage over timer features alone. Hours feed payroll so every error carries a cost. Intuit describes an AI Payroll Agent that gathers and checks time data and flags mismatches (Intuit, May 2026). ADP automates pay rules and overtime and union agreement enforcement (ADP, November 2025). Replicon warns users when work patterns approach overtime limits and can require approval before timesheet submission (Deltek, September 2026). Buyers should confirm these company claims through pilot payroll cycles.
Which Capabilities Distinguish Product Offers?
Offers separate on automation and AI access to time data. Replicon ZeroTime proposes timesheet descriptions from calendar and file and email and browser activity (Deltek, September 2026). Hubstaff added an MCP server and five Insights API endpoints so AI tools can query activity and focus time and meeting data (Hubstaff, October 2026). Harvest shipped an MCP that lets AI tools log time and run reports and draft invoices (Harvest, July 2026). Open data access now shapes how suppliers compete.
How Does Geographic Reach Affect Competition?
Reach depends on labor rule coverage and payout options across countries. ADP offers its suite to employers and employees in more than 140 countries and territories (ADP, November 2025). Replicon updated its payroll rules for Colombia with a lower weekly overtime threshold and higher holiday premium pay (Deltek, September 2026). Hubstaff expanded Wise payouts so team members in more countries receive funds in local bank accounts (Hubstaff, October 2026). Local compliance depth therefore decides cross-border wins.
| Verified Company Evidence (2026) | Commercial Effect | Buyer Action |
|---|---|---|
| 6 May 2026 Intuit unveiled QuickBooks Workforce with time tracking and payroll and accounting data in one platform and an AI Payroll Agent that checks time data [Intuit (May 2026)]. | Brings time capture into an accounting suite used by small and mid-market firms. | Compare tier features such as geofenced and project-based tracking before upgrading plans. |
| 15 July 2026 Harvest shipped Harvest MCP and announced Harvest AI and a Gusto integration as coming soon [Harvest (July 2026)]. | Opens time and budget and invoice data to AI tools and payroll partners. | Review role-based data access settings before connecting AI assistants. |
| 9 September 2026 Deltek published the Replicon Time Q3 2026 release with AI-drafted timesheet comments and overtime warnings and project cost visibility [Deltek (September 2026)]. | Reduces manual entry and flags overtime risk early for enterprise project teams. | Test blocklist and approval settings with a pilot group before rollout. |
Source: Verified corporate disclosures and Future Market Insights analysis, 2026.
| Company | Core Positioning | Verified Activity & Source Attribution |
|---|---|---|
| UKG | Workforce Operating Platform for HR and pay and workforce management and the leading company | Showcased its AI-led platform at UNLEASH America and TRANSFORM in March 2026 (UKG, March 2026). |
| ADP | HR and payroll provider with a global workforce management suite | Made WorkForce Suite available across three platforms on 20 November 2025 (ADP, November 2025). |
| Intuit | Accounting and payroll platform for small and mid-market businesses | Unveiled QuickBooks Workforce with built-in time tracking on 6 May 2026 (Intuit, May 2026). |
| Clockify | Time tracking product within the CAKE.com suite | Positioning only. Recent activity sits outside the source list. |
| Toggl | Time tracking and planning platform for services teams | Positioning only. Recent activity sits outside the source list. |
| Harvest | Time tracking with invoicing and reporting for client work | Shipped Harvest MCP and announced Harvest AI on 15 July 2026 (Harvest, July 2026). |
| Hubstaff | Time tracking and workforce analytics platform | Added an MCP server and Insights API endpoints in Q3 2026 (Hubstaff, October 2026). |
| Deputy | Shift-based workforce scheduling and time platform | Positioning only. Recent activity sits outside the source list. |
| Replicon | Enterprise time tracking within Deltek | Released AI-drafted timesheet comments and overtime controls in Q3 2026 (Deltek, September 2026). |
| Timely | Automatic time tracking platform | Positioning only. Recent activity sits outside the source list. |
Source: Verified corporate disclosures and Future Market Insights analysis, 2026.
Time Tracking Software Market Report Scope and Research Methodology
FMI builds the time tracking software market from the count of paid user seats in each country multiplied by the average subscription revenue per seat. National business population and workforce totals provide the cross-check. Time and attendance anchors the model because wage and labor rules oblige employers to record hours and that keeps renewal rates steady. Monthly and annual and per-user and per-site plans convert to annualized seat revenue so every deployment type shares one value basis. Revenue is counted in the country where the licensed users work. Function and organization and country figures sum to the global total in every year. Company disclosures verify product positioning and pricing tiers rather than estimate proprietary company revenue.
| Coverage Field | Report Scope |
|---|---|
| Market definition | Revenue from software that records worker hours for attendance and project timesheets and automatic time capture and billable invoicing and productivity monitoring. |
| Product types | Time and attendance / project and timesheet tracking / automatic time capture / billable hours and invoicing / productivity monitoring |
| Variants | Cloud web application / mobile application / on-premise / desktop installed |
| Ingredients or materials included | Clock-in modules and timesheet engines and geofencing and biometric add-ons and payroll and invoicing integrations |
| Packaging formats | Per-user monthly subscriptions / annual contracts / per-site licenses / perpetual licenses with maintenance |
| Distribution channels | Direct online sign-up / direct enterprise sales / app marketplaces / payroll and HR platform partners |
| End users | Small businesses / mid-sized businesses / large enterprises / freelancers and individuals |
| Exclusions | Full payroll processing suites / workforce management hardware sold apart from software / general project management tools lacking time capture / consulting services |
| Quantitative units | USD billion for value and paid user seats for volume |
| Volume basis | Paid user seat equivalents with site and device licenses converted to seat terms |
| Value basis | Annualized subscription and license revenue in each country counted where the licensed users work |
| Regions covered | North America / Latin America / Western Europe / Eastern Europe / East Asia / South Asia and Pacific / Middle East and Africa |
| National coverage | United States / United Kingdom / Germany / Canada / Australia / Japan / South Korea |
| Companies covered | UKG / ADP / Intuit / Clockify / Toggl / Harvest / Hubstaff / Deputy / Replicon / Timely |
Source: Future Market Insights analysis of the time tracking software market, 2026.
Research Sources and Bibliography
- Acas (November 2026). Employment Rights Act 2025 [guidance page, accessed 17 November 2026]. https://www.acas.org.uk/employment-rights-act-2025
- ADP (November 2025). ADP Launches Unified Global Workforce Management Suite Across HCM Platforms [Press release, 20 November 2025]. https://mediacenter.adp.com/2025-11-20-ADP-Launches-Unified-Global-Workforce-Management-Suite-Across-HCM-Platforms
- ADP (July 2026). ADP Reports Fourth Quarter and Fiscal 2026 Results [press release, July 29, 2026]. https://mediacenter.adp.com/2026-07-29-ADP-Reports-Fourth-Quarter-and-Fiscal-2026-Results?asPDF
- Bundesministerium für Arbeit und Soziales (August 2025). Fragen und Antworten zur Arbeitszeiterfassung [ministry FAQ page, August 8, 2025]. https://www.bmas.de/DE/Arbeit/Arbeitsrecht/Arbeitnehmerrechte/Regelungen-zur-Arbeitszeit/Fragen-und-Antworten/faq-arbeitszeiterfassung.html
- Bundesministerium für Arbeit und Soziales (May 2026). “Wir müssen uns alle mehr am Riemen reißen” [ministerial interview, May 6, 2026]. https://www.bmas.de/DE/Service/Presse/Interviews/2026/2026-05-06-spiegel.html
- Bureau of Labor Statistics (November 2026). The Employment Situation, October 2026 [news release, November 6, 2026]. https://www.bls.gov/news.release/empsit.nr0.htm
- CAKE.com (April 2026). Changes to the Clockify Free plan [company blog post, April 21, 2026]. https://cake.com/blog/?p=5014
- Connecteam (October 2026). October 2026 product releases. https://releases.connecteam.com/
- DAC Beachcroft (2026). New duty to keep holiday records comes into force on 6 April 2026. https://www.dacbeachcroft.com/en/What-we-think/New-duty-to-keep-holiday-records-comes-into-force-on-6-april-2026
- Deltek (September 2026). What’s New in Replicon Time in Q3 2026: Smarter Time Capture, Better Administrative Control and Compliance Capabilities [Company article, 9 September 2026]. https://www.deltek.com/resources/articles/replicon-time-q3-2026-features/
- Fair Work Ombudsman, Australia (November 2026). Small business and the Fair Work Act best practice guide [guidance page, accessed 17 November 2026]. https://www.fairwork.gov.au/tools-and-resources/best-practice-guides/small-business-and-the-fair-work-act
- Harvest (July 2026). In Season: The Latest from Harvest, Summer 2026 [Company blog post, 15 July 2026]. https://www.getharvest.com/blog/in-season-summer-2026
- Homebase (October 2026). Homebase Assistant launch [20 October 2026]. https://letsdatascience.com/news/homebase-launches-homebase-assistant-ai-for-hourly-small-bus-45b6142f
- Hubstaff (October 2026). What’s New at Hubstaff [Company blog post, 26 October 2026]. https://hubstaff.com/blog/what-is-new/
- Intuit (August 2026). Fourth-quarter Fiscal 2026 Conference Call Remarks [earnings call remarks, August 25, 2026]. https://investors.intuit.com/_assets/_64f3415e6601d7a94d9a083d8f6622dc/intuit/db/946/10378/webcast_transcript/Q4+FY26+Earnings+Script.pdf
- Intuit (May 2026). Intuit Unveils QuickBooks Workforce, Radically Transforming Human Capital Management for Small and Mid-Market Businesses [Press release, 6 May 2026]. https://investors.intuit.com/_assets/_f846a5f5d254e6139bb6691134938154/intuit/news/2026-05-06_Intuit_Unveils_QuickBooks_Workforce_Radically_1310.pdf
- Ministry of Employment and Labor, Republic of Korea (February 2026). Work-Life Balance+4.5 Project [press release, 10 February 2026]. https://www.moel.go.kr/news/enews/report/enewsView.do?news_seq=18952
- Ministry of Health, Labour and Welfare, Japan (2025). Annual Health, Labour and Welfare Report 2025, Working Conditions [annual report chapter, 2025 edition]. https://www.mhlw.go.jp/wp/hakusyo/kousei/25-2/dl/04_en.pdf
- Statistics Canada (June 2026). Labour Force Survey, May 2026 [statistical release, 5 June 2026]. https://www150.statcan.gc.ca/n1/daily-quotidien/260605/dq260605a-eng.htm
- UKG (March 2026). UKG Showcases Next Era of AI-led Workforce Orchestration at UNLEASH America and TRANSFORM [Press release, 16 March 2026]. https://www.businesswire.com/news/home/20260316429211/en/
- US Department of Labor, Wage and Hour Division (January 2026). US Department of Labor recovers more than $259M in back wages for workers in 2025 [press release, 8 January 2026]. https://www.dol.gov/index.php/newsroom/releases/whd/whd20260108
- US Department of Labor, Wage and Hour Division (2025). Wage and Hour Division Data, Fiscal Year 2025 [agency data page, fiscal year 2025]. https://www.dol.gov/agencies/whd/data
Table of Content
- Key Takeaways
- Market Size and CAGR
- Top Growth Driver
- Fastest Growing Segment
- Leading Region
- Key Companies
- Emerging Opportunities
- Executive Summary
- Global Market Outlook
- Demand-side Trends
- Supply-side Trends
- Technology Roadmap Analysis
- Analysis and Recommendations
- Analyst Perspective (What is happening? Why now? What should investors know?)
- Key Questions Answered
- How large is the market?
- What is the CAGR?
- What are key trends?
- Which region dominates?
- Who are the leaders?
Read More...
- Market Overview
- Market Coverage / Taxonomy
- Market Definition / Scope / Limitations
- Research Methodology
- Chapter Orientation
- Analytical Lens and Working Hypotheses
- Market Structure, Signals, and Trend Drivers
- Benchmarking and Cross-market Comparability
- Market Sizing, Forecasting, and Opportunity Mapping
- Research Design and Evidence Framework
- Desk Research Programme (Secondary Evidence)
- Expert Input and Fieldwork (Primary Evidence)
- Tooling, Models, and Reference Databases
- Data Engineering and Model Build
- Quality Assurance and Audit Trail
- Market Background
- Market Dynamics (Drivers, Restraints, Opportunity, Trends)
- Scenario Forecast (Optimistic, Likely, Conservative)
- Impact Analysis
- AI Impact
- Sustainability Impact
- Regulatory Impact
- Technology Impact
- Consumer / Buyer Analysis
- Purchase Drivers
- Adoption Barriers
- Buyer Journey
- Opportunity Map Analysis
- Product Life Cycle Analysis
- Supply Chain Analysis
- Investment Feasibility Matrix
- Value Chain Analysis
- PESTLE and Porter's Analysis
- Regulatory Landscape
- Regional Parent Market Outlook
- Production and Consumption Statistics
- Import and Export Statistics
- Global Market Analysis and Forecast, 2021 to 2036
- Historical Market Size Value (USD Billion) Analysis, 2021 to 2025
- Current and Future Market Size Value (USD Billion) Projections, 2026 to 2036
- Y-o-Y Growth Trend Analysis
- Absolute $ Opportunity Analysis
- Global Market Pricing Analysis, 2021 to 2036
- Global Market Analysis and Forecast, By Function, 2021 to 2036
- Introduction / Key Findings
- Historical Market Size Value (USD Billion) Analysis By Function, 2021 to 2025
- Current and Future Market Size Value (USD Billion) Analysis and Forecast By Function, 2026 to 2036
- Time and Attendance
- Project and Timesheet Tracking
- Automatic Time Capture
- Billable Hours and Invoicing
- Productivity Monitoring
- Y-o-Y Growth Trend Analysis By Function, 2021 to 2025
- Absolute $ Opportunity Analysis By Function, 2026 to 2036
- Global Market Analysis and Forecast, By Deployment, 2021 to 2036
- Introduction / Key Findings
- Historical Market Size Value (USD Billion) Analysis By Deployment, 2021 to 2025
- Current and Future Market Size Value (USD Billion) Analysis and Forecast By Deployment, 2026 to 2036
- Cloud Web Application
- Mobile Application
- On-Premise
- Desktop Installed
- Y-o-Y Growth Trend Analysis By Deployment, 2021 to 2025
- Absolute $ Opportunity Analysis By Deployment, 2026 to 2036
- Global Market Analysis and Forecast, By Organization Size, 2021 to 2036
- Introduction / Key Findings
- Historical Market Size Value (USD Billion) Analysis By Organization Size, 2021 to 2025
- Current and Future Market Size Value (USD Billion) Analysis and Forecast By Organization Size, 2026 to 2036
- Small Businesses
- Mid-Sized Businesses
- Large Enterprises
- Freelancers and Individuals
- Y-o-Y Growth Trend Analysis By Organization Size, 2021 to 2025
- Absolute $ Opportunity Analysis By Organization Size, 2026 to 2036
- Global Market Analysis and Forecast, By End Use, 2021 to 2036
- Introduction / Key Findings
- Historical Market Size Value (USD Billion) Analysis By End Use, 2021 to 2025
- Current and Future Market Size Value (USD Billion) Analysis and Forecast By End Use, 2026 to 2036
- IT and Business Services
- Professional and Legal Services
- Construction and Field Services
- Retail and Hospitality
- Healthcare
- Y-o-Y Growth Trend Analysis By End Use, 2021 to 2025
- Absolute $ Opportunity Analysis By End Use, 2026 to 2036
- Global Market Analysis and Forecast, By Region, 2021 to 2036
- Introduction
- Historical Market Size Value (USD Billion) Analysis By Region, 2021 to 2025
- Current Market Size Value (USD Billion) Analysis and Forecast By Region, 2026 to 2036
- North America
- Latin America
- Western Europe
- Eastern Europe
- East Asia
- South Asia and Pacific
- Middle East and Africa
- Market Attractiveness Analysis By Region
- North America Market Analysis and Forecast, By Country, 2021 to 2036
- Historical Market Size Value (USD Billion) Trend Analysis By Market Taxonomy, 2021 to 2025
- Market Size Value (USD Billion) Forecast By Market Taxonomy, 2026 to 2036
- By Country
- United States
- Canada
- By Function
- By Deployment
- By Organization Size
- By End Use
- By Country
- Market Attractiveness Analysis
- By Country
- By Function
- By Deployment
- By Organization Size
- By End Use
- Key Takeaways
- Latin America Market Analysis and Forecast, By Country, 2021 to 2036
- Historical Market Size Value (USD Billion) Trend Analysis By Market Taxonomy, 2021 to 2025
- Market Size Value (USD Billion) Forecast By Market Taxonomy, 2026 to 2036
- By Country
- Brazil
- Mexico
- Argentina
- Chile
- By Function
- By Deployment
- By Organization Size
- By End Use
- By Country
- Market Attractiveness Analysis
- By Country
- By Function
- By Deployment
- By Organization Size
- By End Use
- Key Takeaways
- Western Europe Market Analysis and Forecast, By Country, 2021 to 2036
- Historical Market Size Value (USD Billion) Trend Analysis By Market Taxonomy, 2021 to 2025
- Market Size Value (USD Billion) Forecast By Market Taxonomy, 2026 to 2036
- By Country
- Germany
- France
- United Kingdom
- Italy
- Spain
- Benelux
- Nordics
- By Function
- By Deployment
- By Organization Size
- By End Use
- By Country
- Market Attractiveness Analysis
- By Country
- By Function
- By Deployment
- By Organization Size
- By End Use
- Key Takeaways
- Eastern Europe Market Analysis and Forecast, By Country, 2021 to 2036
- Historical Market Size Value (USD Billion) Trend Analysis By Market Taxonomy, 2021 to 2025
- Market Size Value (USD Billion) Forecast By Market Taxonomy, 2026 to 2036
- By Country
- Poland
- Czech Republic
- Romania
- Hungary
- By Function
- By Deployment
- By Organization Size
- By End Use
- By Country
- Market Attractiveness Analysis
- By Country
- By Function
- By Deployment
- By Organization Size
- By End Use
- Key Takeaways
- East Asia Market Analysis and Forecast, By Country, 2021 to 2036
- Historical Market Size Value (USD Billion) Trend Analysis By Market Taxonomy, 2021 to 2025
- Market Size Value (USD Billion) Forecast By Market Taxonomy, 2026 to 2036
- By Country
- China
- Japan
- South Korea
- By Function
- By Deployment
- By Organization Size
- By End Use
- By Country
- Market Attractiveness Analysis
- By Country
- By Function
- By Deployment
- By Organization Size
- By End Use
- Key Takeaways
- South Asia and Pacific Market Analysis and Forecast, By Country, 2021 to 2036
- Historical Market Size Value (USD Billion) Trend Analysis By Market Taxonomy, 2021 to 2025
- Market Size Value (USD Billion) Forecast By Market Taxonomy, 2026 to 2036
- By Country
- India
- ASEAN
- Australia and New Zealand
- By Function
- By Deployment
- By Organization Size
- By End Use
- By Country
- Market Attractiveness Analysis
- By Country
- By Function
- By Deployment
- By Organization Size
- By End Use
- Key Takeaways
- Middle East and Africa Market Analysis and Forecast, By Country, 2021 to 2036
- Historical Market Size Value (USD Billion) Trend Analysis By Market Taxonomy, 2021 to 2025
- Market Size Value (USD Billion) Forecast By Market Taxonomy, 2026 to 2036
- By Country
- GCC Countries
- South Africa
- Türkiye
- Israel
- By Function
- By Deployment
- By Organization Size
- By End Use
- By Country
- Market Attractiveness Analysis
- By Country
- By Function
- By Deployment
- By Organization Size
- By End Use
- Key Takeaways
- Key Countries Market Analysis
- United States
- Pricing Analysis
- Market Share Analysis, 2025
- By Function
- By Deployment
- By Organization Size
- By End Use
- Canada
- Pricing Analysis
- Market Share Analysis, 2025
- By Function
- By Deployment
- By Organization Size
- By End Use
- Brazil
- Pricing Analysis
- Market Share Analysis, 2025
- By Function
- By Deployment
- By Organization Size
- By End Use
- Mexico
- Pricing Analysis
- Market Share Analysis, 2025
- By Function
- By Deployment
- By Organization Size
- By End Use
- Argentina
- Pricing Analysis
- Market Share Analysis, 2025
- By Function
- By Deployment
- By Organization Size
- By End Use
- Chile
- Pricing Analysis
- Market Share Analysis, 2025
- By Function
- By Deployment
- By Organization Size
- By End Use
- Germany
- Pricing Analysis
- Market Share Analysis, 2025
- By Function
- By Deployment
- By Organization Size
- By End Use
- France
- Pricing Analysis
- Market Share Analysis, 2025
- By Function
- By Deployment
- By Organization Size
- By End Use
- United Kingdom
- Pricing Analysis
- Market Share Analysis, 2025
- By Function
- By Deployment
- By Organization Size
- By End Use
- Italy
- Pricing Analysis
- Market Share Analysis, 2025
- By Function
- By Deployment
- By Organization Size
- By End Use
- Spain
- Pricing Analysis
- Market Share Analysis, 2025
- By Function
- By Deployment
- By Organization Size
- By End Use
- Benelux
- Pricing Analysis
- Market Share Analysis, 2025
- By Function
- By Deployment
- By Organization Size
- By End Use
- Nordics
- Pricing Analysis
- Market Share Analysis, 2025
- By Function
- By Deployment
- By Organization Size
- By End Use
- Poland
- Pricing Analysis
- Market Share Analysis, 2025
- By Function
- By Deployment
- By Organization Size
- By End Use
- Czech Republic
- Pricing Analysis
- Market Share Analysis, 2025
- By Function
- By Deployment
- By Organization Size
- By End Use
- Romania
- Pricing Analysis
- Market Share Analysis, 2025
- By Function
- By Deployment
- By Organization Size
- By End Use
- Hungary
- Pricing Analysis
- Market Share Analysis, 2025
- By Function
- By Deployment
- By Organization Size
- By End Use
- China
- Pricing Analysis
- Market Share Analysis, 2025
- By Function
- By Deployment
- By Organization Size
- By End Use
- Japan
- Pricing Analysis
- Market Share Analysis, 2025
- By Function
- By Deployment
- By Organization Size
- By End Use
- South Korea
- Pricing Analysis
- Market Share Analysis, 2025
- By Function
- By Deployment
- By Organization Size
- By End Use
- India
- Pricing Analysis
- Market Share Analysis, 2025
- By Function
- By Deployment
- By Organization Size
- By End Use
- ASEAN
- Pricing Analysis
- Market Share Analysis, 2025
- By Function
- By Deployment
- By Organization Size
- By End Use
- Australia and New Zealand
- Pricing Analysis
- Market Share Analysis, 2025
- By Function
- By Deployment
- By Organization Size
- By End Use
- GCC Countries
- Pricing Analysis
- Market Share Analysis, 2025
- By Function
- By Deployment
- By Organization Size
- By End Use
- South Africa
- Pricing Analysis
- Market Share Analysis, 2025
- By Function
- By Deployment
- By Organization Size
- By End Use
- Türkiye
- Pricing Analysis
- Market Share Analysis, 2025
- By Function
- By Deployment
- By Organization Size
- By End Use
- Israel
- Pricing Analysis
- Market Share Analysis, 2025
- By Function
- By Deployment
- By Organization Size
- By End Use
- United States
- Market Structure Analysis
- Competition Dashboard
- Competition Benchmarking
- Market Share Analysis of Top Players
- By Region
- By Function
- By Deployment
- By Organization Size
- By End Use
- Emerging Startups
- Innovation Benchmarking
- Competition Analysis
- Competition Deep Dive
- UKG
- Overview
- Product Portfolio
- Profitability by Market Segments
- Sales Footprint
- Strategy Overview
- Marketing Strategy
- Product Strategy
- Channel Strategy
- ADP
- Intuit
- Clockify
- Toggl
- Harvest
- Hubstaff
- Deputy
- Replicon
- Timely
- UKG
- Case Studies
- Success Stories
- Recent Developments
- Competition Deep Dive
- Assumptions & Acronyms Used
List of Tables
- Table 1: Global Market Value (USD Billion) Forecast by Region, 2021 to 2036
- Table 2: Global Market Value (USD Billion) Forecast by Function, 2021 to 2036
- Table 3: Global Market Value (USD Billion) Forecast by Deployment, 2021 to 2036
- Table 4: Global Market Value (USD Billion) Forecast by Organization Size, 2021 to 2036
- Table 5: Global Market Value (USD Billion) Forecast by End Use, 2021 to 2036
- Table 6: North America Market Value (USD Billion) Forecast by Country, 2021 to 2036
- Table 7: North America Market Value (USD Billion) Forecast by Function, 2021 to 2036
- Table 8: North America Market Value (USD Billion) Forecast by Deployment, 2021 to 2036
- Table 9: North America Market Value (USD Billion) Forecast by Organization Size, 2021 to 2036
- Table 10: North America Market Value (USD Billion) Forecast by End Use, 2021 to 2036
- Table 11: Latin America Market Value (USD Billion) Forecast by Country, 2021 to 2036
- Table 12: Latin America Market Value (USD Billion) Forecast by Function, 2021 to 2036
- Table 13: Latin America Market Value (USD Billion) Forecast by Deployment, 2021 to 2036
- Table 14: Latin America Market Value (USD Billion) Forecast by Organization Size, 2021 to 2036
- Table 15: Latin America Market Value (USD Billion) Forecast by End Use, 2021 to 2036
- Table 16: Western Europe Market Value (USD Billion) Forecast by Country, 2021 to 2036
- Table 17: Western Europe Market Value (USD Billion) Forecast by Function, 2021 to 2036
- Table 18: Western Europe Market Value (USD Billion) Forecast by Deployment, 2021 to 2036
- Table 19: Western Europe Market Value (USD Billion) Forecast by Organization Size, 2021 to 2036
- Table 20: Western Europe Market Value (USD Billion) Forecast by End Use, 2021 to 2036
- Table 21: Eastern Europe Market Value (USD Billion) Forecast by Country, 2021 to 2036
- Table 22: Eastern Europe Market Value (USD Billion) Forecast by Function, 2021 to 2036
- Table 23: Eastern Europe Market Value (USD Billion) Forecast by Deployment, 2021 to 2036
- Table 24: Eastern Europe Market Value (USD Billion) Forecast by Organization Size, 2021 to 2036
- Table 25: Eastern Europe Market Value (USD Billion) Forecast by End Use, 2021 to 2036
- Table 26: East Asia Market Value (USD Billion) Forecast by Country, 2021 to 2036
- Table 27: East Asia Market Value (USD Billion) Forecast by Function, 2021 to 2036
- Table 28: East Asia Market Value (USD Billion) Forecast by Deployment, 2021 to 2036
- Table 29: East Asia Market Value (USD Billion) Forecast by Organization Size, 2021 to 2036
- Table 30: East Asia Market Value (USD Billion) Forecast by End Use, 2021 to 2036
- Table 31: South Asia and Pacific Market Value (USD Billion) Forecast by Country, 2021 to 2036
- Table 32: South Asia and Pacific Market Value (USD Billion) Forecast by Function, 2021 to 2036
- Table 33: South Asia and Pacific Market Value (USD Billion) Forecast by Deployment, 2021 to 2036
- Table 34: South Asia and Pacific Market Value (USD Billion) Forecast by Organization Size, 2021 to 2036
- Table 35: South Asia and Pacific Market Value (USD Billion) Forecast by End Use, 2021 to 2036
- Table 36: Middle East and Africa Market Value (USD Billion) Forecast by Country, 2021 to 2036
- Table 37: Middle East and Africa Market Value (USD Billion) Forecast by Function, 2021 to 2036
- Table 38: Middle East and Africa Market Value (USD Billion) Forecast by Deployment, 2021 to 2036
- Table 39: Middle East and Africa Market Value (USD Billion) Forecast by Organization Size, 2021 to 2036
- Table 40: Middle East and Africa Market Value (USD Billion) Forecast by End Use, 2021 to 2036
List of Figures
- Figure 1: Global Market Pricing Analysis
- Figure 2: Global Market Value (USD Billion) Forecast 2021-2036
- Figure 3: Global Market Value Share and BPS Analysis by Function, 2026 and 2036
- Figure 4: Global Market Y-o-Y Growth Comparison by Function, 2026-2036
- Figure 5: Global Market Attractiveness Analysis by Function
- Figure 6: Global Market Value Share and BPS Analysis by Deployment, 2026 and 2036
- Figure 7: Global Market Y-o-Y Growth Comparison by Deployment, 2026-2036
- Figure 8: Global Market Attractiveness Analysis by Deployment
- Figure 9: Global Market Value Share and BPS Analysis by Organization Size, 2026 and 2036
- Figure 10: Global Market Y-o-Y Growth Comparison by Organization Size, 2026-2036
- Figure 11: Global Market Attractiveness Analysis by Organization Size
- Figure 12: Global Market Value Share and BPS Analysis by End Use, 2026 and 2036
- Figure 13: Global Market Y-o-Y Growth Comparison by End Use, 2026-2036
- Figure 14: Global Market Attractiveness Analysis by End Use
- Figure 15: Global Market Value (USD Billion) Share and BPS Analysis by Region, 2026 and 2036
- Figure 16: Global Market Y-o-Y Growth Comparison by Region, 2026-2036
- Figure 17: Global Market Attractiveness Analysis by Region
- Figure 18: North America Market Incremental Dollar Opportunity, 2026-2036
- Figure 19: Latin America Market Incremental Dollar Opportunity, 2026-2036
- Figure 20: Western Europe Market Incremental Dollar Opportunity, 2026-2036
- Figure 21: Eastern Europe Market Incremental Dollar Opportunity, 2026-2036
- Figure 22: East Asia Market Incremental Dollar Opportunity, 2026-2036
- Figure 23: South Asia and Pacific Market Incremental Dollar Opportunity, 2026-2036
- Figure 24: Middle East and Africa Market Incremental Dollar Opportunity, 2026-2036
- Figure 25: North America Market Value Share and BPS Analysis by Country, 2026 and 2036
- Figure 26: North America Market Value Share and BPS Analysis by Function, 2026 and 2036
- Figure 27: North America Market Y-o-Y Growth Comparison by Function, 2026-2036
- Figure 28: North America Market Attractiveness Analysis by Function
- Figure 29: North America Market Value Share and BPS Analysis by Deployment, 2026 and 2036
- Figure 30: North America Market Y-o-Y Growth Comparison by Deployment, 2026-2036
- Figure 31: North America Market Attractiveness Analysis by Deployment
- Figure 32: North America Market Value Share and BPS Analysis by Organization Size, 2026 and 2036
- Figure 33: North America Market Y-o-Y Growth Comparison by Organization Size, 2026-2036
- Figure 34: North America Market Attractiveness Analysis by Organization Size
- Figure 35: North America Market Value Share and BPS Analysis by End Use, 2026 and 2036
- Figure 36: North America Market Y-o-Y Growth Comparison by End Use, 2026-2036
- Figure 37: North America Market Attractiveness Analysis by End Use
- Figure 38: Latin America Market Value Share and BPS Analysis by Country, 2026 and 2036
- Figure 39: Latin America Market Value Share and BPS Analysis by Function, 2026 and 2036
- Figure 40: Latin America Market Y-o-Y Growth Comparison by Function, 2026-2036
- Figure 41: Latin America Market Attractiveness Analysis by Function
- Figure 42: Latin America Market Value Share and BPS Analysis by Deployment, 2026 and 2036
- Figure 43: Latin America Market Y-o-Y Growth Comparison by Deployment, 2026-2036
- Figure 44: Latin America Market Attractiveness Analysis by Deployment
- Figure 45: Latin America Market Value Share and BPS Analysis by Organization Size, 2026 and 2036
- Figure 46: Latin America Market Y-o-Y Growth Comparison by Organization Size, 2026-2036
- Figure 47: Latin America Market Attractiveness Analysis by Organization Size
- Figure 48: Latin America Market Value Share and BPS Analysis by End Use, 2026 and 2036
- Figure 49: Latin America Market Y-o-Y Growth Comparison by End Use, 2026-2036
- Figure 50: Latin America Market Attractiveness Analysis by End Use
- Figure 51: Western Europe Market Value Share and BPS Analysis by Country, 2026 and 2036
- Figure 52: Western Europe Market Value Share and BPS Analysis by Function, 2026 and 2036
- Figure 53: Western Europe Market Y-o-Y Growth Comparison by Function, 2026-2036
- Figure 54: Western Europe Market Attractiveness Analysis by Function
- Figure 55: Western Europe Market Value Share and BPS Analysis by Deployment, 2026 and 2036
- Figure 56: Western Europe Market Y-o-Y Growth Comparison by Deployment, 2026-2036
- Figure 57: Western Europe Market Attractiveness Analysis by Deployment
- Figure 58: Western Europe Market Value Share and BPS Analysis by Organization Size, 2026 and 2036
- Figure 59: Western Europe Market Y-o-Y Growth Comparison by Organization Size, 2026-2036
- Figure 60: Western Europe Market Attractiveness Analysis by Organization Size
- Figure 61: Western Europe Market Value Share and BPS Analysis by End Use, 2026 and 2036
- Figure 62: Western Europe Market Y-o-Y Growth Comparison by End Use, 2026-2036
- Figure 63: Western Europe Market Attractiveness Analysis by End Use
- Figure 64: Eastern Europe Market Value Share and BPS Analysis by Country, 2026 and 2036
- Figure 65: Eastern Europe Market Value Share and BPS Analysis by Function, 2026 and 2036
- Figure 66: Eastern Europe Market Y-o-Y Growth Comparison by Function, 2026-2036
- Figure 67: Eastern Europe Market Attractiveness Analysis by Function
- Figure 68: Eastern Europe Market Value Share and BPS Analysis by Deployment, 2026 and 2036
- Figure 69: Eastern Europe Market Y-o-Y Growth Comparison by Deployment, 2026-2036
- Figure 70: Eastern Europe Market Attractiveness Analysis by Deployment
- Figure 71: Eastern Europe Market Value Share and BPS Analysis by Organization Size, 2026 and 2036
- Figure 72: Eastern Europe Market Y-o-Y Growth Comparison by Organization Size, 2026-2036
- Figure 73: Eastern Europe Market Attractiveness Analysis by Organization Size
- Figure 74: Eastern Europe Market Value Share and BPS Analysis by End Use, 2026 and 2036
- Figure 75: Eastern Europe Market Y-o-Y Growth Comparison by End Use, 2026-2036
- Figure 76: Eastern Europe Market Attractiveness Analysis by End Use
- Figure 77: East Asia Market Value Share and BPS Analysis by Country, 2026 and 2036
- Figure 78: East Asia Market Value Share and BPS Analysis by Function, 2026 and 2036
- Figure 79: East Asia Market Y-o-Y Growth Comparison by Function, 2026-2036
- Figure 80: East Asia Market Attractiveness Analysis by Function
- Figure 81: East Asia Market Value Share and BPS Analysis by Deployment, 2026 and 2036
- Figure 82: East Asia Market Y-o-Y Growth Comparison by Deployment, 2026-2036
- Figure 83: East Asia Market Attractiveness Analysis by Deployment
- Figure 84: East Asia Market Value Share and BPS Analysis by Organization Size, 2026 and 2036
- Figure 85: East Asia Market Y-o-Y Growth Comparison by Organization Size, 2026-2036
- Figure 86: East Asia Market Attractiveness Analysis by Organization Size
- Figure 87: East Asia Market Value Share and BPS Analysis by End Use, 2026 and 2036
- Figure 88: East Asia Market Y-o-Y Growth Comparison by End Use, 2026-2036
- Figure 89: East Asia Market Attractiveness Analysis by End Use
- Figure 90: South Asia and Pacific Market Value Share and BPS Analysis by Country, 2026 and 2036
- Figure 91: South Asia and Pacific Market Value Share and BPS Analysis by Function, 2026 and 2036
- Figure 92: South Asia and Pacific Market Y-o-Y Growth Comparison by Function, 2026-2036
- Figure 93: South Asia and Pacific Market Attractiveness Analysis by Function
- Figure 94: South Asia and Pacific Market Value Share and BPS Analysis by Deployment, 2026 and 2036
- Figure 95: South Asia and Pacific Market Y-o-Y Growth Comparison by Deployment, 2026-2036
- Figure 96: South Asia and Pacific Market Attractiveness Analysis by Deployment
- Figure 97: South Asia and Pacific Market Value Share and BPS Analysis by Organization Size, 2026 and 2036
- Figure 98: South Asia and Pacific Market Y-o-Y Growth Comparison by Organization Size, 2026-2036
- Figure 99: South Asia and Pacific Market Attractiveness Analysis by Organization Size
- Figure 100: South Asia and Pacific Market Value Share and BPS Analysis by End Use, 2026 and 2036
- Figure 101: South Asia and Pacific Market Y-o-Y Growth Comparison by End Use, 2026-2036
- Figure 102: South Asia and Pacific Market Attractiveness Analysis by End Use
- Figure 103: Middle East and Africa Market Value Share and BPS Analysis by Country, 2026 and 2036
- Figure 104: Middle East and Africa Market Value Share and BPS Analysis by Function, 2026 and 2036
- Figure 105: Middle East and Africa Market Y-o-Y Growth Comparison by Function, 2026-2036
- Figure 106: Middle East and Africa Market Attractiveness Analysis by Function
- Figure 107: Middle East and Africa Market Value Share and BPS Analysis by Deployment, 2026 and 2036
- Figure 108: Middle East and Africa Market Y-o-Y Growth Comparison by Deployment, 2026-2036
- Figure 109: Middle East and Africa Market Attractiveness Analysis by Deployment
- Figure 110: Middle East and Africa Market Value Share and BPS Analysis by Organization Size, 2026 and 2036
- Figure 111: Middle East and Africa Market Y-o-Y Growth Comparison by Organization Size, 2026-2036
- Figure 112: Middle East and Africa Market Attractiveness Analysis by Organization Size
- Figure 113: Middle East and Africa Market Value Share and BPS Analysis by End Use, 2026 and 2036
- Figure 114: Middle East and Africa Market Y-o-Y Growth Comparison by End Use, 2026-2036
- Figure 115: Middle East and Africa Market Attractiveness Analysis by End Use
- Figure 116: Global Market - Tier Structure Analysis
- Figure 117: Global Market - Company Share Analysis
Frequently Asked Questions
How big is the Time Tracking Software Market in 2026?
Future Market Insights estimates the global time tracking software market at USD 2.9 billion in 2026 and projects it to reach USD 7.1 billion by 2036.
How fast is the Time Tracking Software Market expected to grow through 2036?
FMI projects the market to expand at a 9.5% CAGR from 2026 to 2036, reflecting increasing adoption of digital tools for workforce monitoring, attendance management, and project time tracking.
Which function leads the Time Tracking Software Market?
Time and attendance lead the function segment with a 38.0% share, supported by organizational requirements for employee attendance monitoring and work-hour management.
Which deployment model leads the Time Tracking Software Market?
Cloud web applications lead the deployment segment with a 56.0% share, reflecting the preference for accessible, flexible, and remotely managed time tracking solutions.
Which country is expected to record the fastest growth in the Time Tracking Software Market?
Australia is projected to record the fastest growth at a 10.1% CAGR from 2026 to 2036, followed by Canada at 9.6% and South Korea at 9.3%.
Who are the leading players in the Time Tracking Software Market?
Key players in the time tracking software market include UKG, ADP, Intuit, Clockify, Toggl, Harvest, Hubstaff, Deputy, Replicon, and Timely.
Preview the report firsthand - request a free sample
Get SampleGet the brochure for pricing and purchase details.
Get PDF
