Reports

- Global Locations -

Headquarters

Future Market Insights, Inc.

Christiana Corporate, 200
Continental Drive, Suite 401,
Newark, Delaware - 19713,
United States

T: +1-845-579-5705

Americas

Future Market Insights, Inc.

616 Corporate Way, Suite 2-9018,
Valley Cottage, NY 10989, United States

T: +1-347-918-3531

MEA

Future Market Insights

1602-6 Jumeirah Bay X2 Tower, Plot No: JLT-PH2-X2A,
Jumeirah Lakes Towers, Dubai,
United Arab Emirates

Europe

Future Market Insights

3rd Floor, 207 Regent Street,
W1B 3HH London
United Kingdom

T: + 44 (0) 20 8123 9659
D: +44 (0) 20 3287 4268

Asia Pacific

Future Market Insights

IndiaLand Global Tech Park, Unit UG-1, Behind Grand HighStreet, Phase 1, Hinjawadi, MH, Pune – 411057, India

Field Service Management Market Outlook (2023 to 2033)

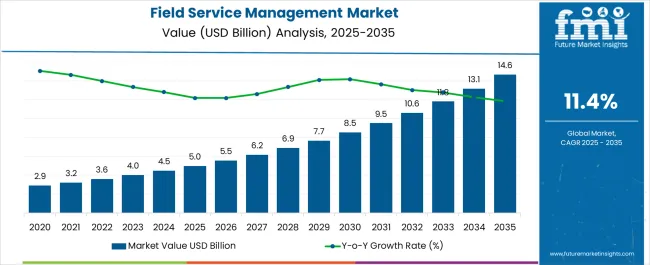
The global field service management market is expected to advance at a sturdy CAGR of 11.4% during the forecast period. The market is expected to cross the mark of US$ 12.2 billion by 2033. In 2023, the valuation is expected to be at US$ 4.2 billion.

The growth of the market is supported by:

  • The rising need for mobility for real-time visibility, as well as the increased adoption of automation and digitization
  • The growing need for IoT is pushing the use of cloud-based field service management solutions, which is expected to provide substantial prospects to the sector in the future.
  • The installation of field service management software has had a considerable effect.
  • The growing requirement to use field service management solutions to provide better customer service, lower labor costs, and higher productivity.

The integration of artificial intelligence, virtual reality, and augmented reality for field service management is another factor that is likely to propel growth. The field service management market is principally influenced by the implementation of field management software.

The field service solutions can integrate a lot of systems into a single unit. This coupled with the usage of fewer software solutions helps businesses save a lot of money. Field service management is also helpful in enabling the seamless scheduling of events. In current times, remote working is adopted by a lot of companies. The ability to schedule allows the team members to share ideas and even assign jobs without being present at the same time.

Owing to the ease of scheduling and routing the workers as per the expertise, the companies can optimize resources efficiently using field service management. Moreover, the telematics technology utilized by the application helps monitor the location of every piece of equipment. The inception of 5G technology is expected to further enhance tracking and various other capabilities.

According to the research, North America is expected to dominate the worldwide field service management industry. The growing need for cost-effective solutions is one of the leading factors driving the market growth. Furthermore, there is a rising demand for mobility solutions as well as simplifying field service teams and processes.

North America is also identified as a technology advancement hotspot and home to renowned players. Industry participants are making considerable expenditures on research and development, which is projected to boost the market. ServiceMax, Inc., for example, acquired LiquidFrameworks, a well-known provider of mobile field operations clients, in July 2021. The acquisition was made to supplement their field service management solution in the energy sector.

Attributes Value
Field Service Management Market Value (2022) US$ 3.6 billion
Field Service Management Market Expected Value (2023) US$ 4.2 billion
Field Service Management Market Forecast Value (2033) US$ 12.2 billion
Field Service Management Market Expected CAGR (2023 to 2033) 11.4%

Don't pay for what you don't need

Customize your report by selecting specific countries or regions and save 30%!

Understanding the Gist of Historical CAGR (2017 to 2022) vs Anticipated CAGR

As companies look to increase productivity by automating the majority of the tasks, the sales of field service management systems are expected to surge. The ability to make effective applications of client databases is something that has captured the attention of several stakeholders. With the continuous evolution of cloud technology, the market has a lot of opportunities in the future.

However, the COVID-19 pandemic brought about a temporary slump in market growth. This was because of the disruption in supply chain management. This has ultimately led to a reduction in the anticipated CAGR. While the historical CAGR for the market was 12.9%, the anticipated CAGR is 11.4%. But, with technology shaping up at a rapid pace, and the increased adoption of automation processes, the growth might surge in the future.

  • Short Term (2023 to 2026): During this period, the field service management application might be making inroads into the developing economies in specific. With a huge amount of data available in countries like China, the manufacturers may be looking to expand their market. This comes at a time when data is believed to be the new ‘oil’, which may drive every sector.
  • Medium Term (2026 to 2029): Owing to the massive deployment of cloud technology, the market might witness the development of higher capabilities. This might lead to a democratization of data. Consequently, end-users may be willing to adopt more services from the market because of the transparency of organizations to make data accessible to everybody.
  • Long Term (2029 to 2033): During this period, enterprises might reap the benefits of investing in technologies like IoT, Artificial Intelligence, data analytics, etc. This may be massively felt in the healthcare sector. The Augmented Reality glasses can potentially help field service workers where the customers need help, and provide remote support.

Factors Hindering Market Growth

Majority of field service data functions on servers behind corporate firewalls. However, devices that access this data do not have such protection. With the growing digitization, there have been increasing cyberattacks. Therefore, data security has become a substantial issue for several organizations.

There is a considerable increase in cybersecurity attacks with a rising transfer of data from the field to the cloud since servers, communication channels, and networks can be easily attacked. Besides, the BYOD policies have enhanced such cases. The personal devices of technicians are vulnerable to attacks when they are connected to an unsecured network.

Sudip Saha
Sudip Saha

Principal Consultant

Talk to Analyst

Find your sweet spots for generating winning opportunities in this market.

Emerging Trends in the Field Service Management Market

As per the analysis, service contract management is expected to gain significant traction in the coming years. Organizations that rely on third-party service providers for their fieldwork demand the same services as those offered by enterprise businesses where client visibility is a priority. The outsourcing of field services can aid companies in lessening labor costs and augmenting their functionalities.

In September 2020, the Salesforce field service platform got a third-party add-on that may assist service providers and customers monitor and manage equipment more efficiently. ServiceMax Asset 360 for Salesforce offers a 360-degree view into several metrics, including install base, asset performance, and warranties for reducing maintenance costs.

In addition, there has been a rise in cloud-integrated contract management solutions across several organizations since digital transformation has been increasing. It facilitates efficient management and enables organizations from several industries to track, approve, sign, and negotiate contracts in a consolidated form.

Comparative View of Field Service Management Market

Field Service Management Market:

Attributes

Field Service Management Market

Anticipated CAGR (2023 to 2033)

11.4%

Market Value (2023)

US$ 4.2 billion

Growth Factor

Adoption of artificial intelligence

Future Opportunities

A surge in the adoption of automation techniques

Market Trends

Key players working on developing field service management software

Information Technology Service Management:

Attributes

Information Technology Service Management

Anticipated CAGR (2023 to 2033)

8%

Market Value (2023)

US$ 6.9 billion

Growth Factor

Increasing adoption of BYOD by the organizations

Future Opportunities

Increasing cyberattacks on financial institutions to drive the adoption

Market Trends

Manufacturers investing in cloud technology is the key trend in the market

Business as a Service Market:

Attributes

Business as a Service Market

Anticipated CAGR (2023 to 2033)

20.2%

Market Value (2023)

US$ 204 billion

Growth Factor

Democratization of functionalities to drive growth

Future Opportunities

Surging e-commerce market

Market Trends

Companies adopting Sales as a Service, which presents prospects for Business as a Service

Get the data you need at a Fraction of the cost

Personalize your report by choosing insights you need
and save 40%!

Country-wise Insights

Regions North America
Countries United States
CAGR (2023 to 2033) 11.1%
Regions Europe
Countries United Kingdom
CAGR (2023 to 2033) 10.7%
Regions Asia Pacific
Countries China
CAGR (2023 to 2033) 10.4%
Regions Asia Pacific
Countries South Korea
CAGR (2023 to 2033) 9.4%
Regions Asia Pacific
Countries Japan
CAGR (2023 to 2033) 9.8%

United States: Massive Developments in the Oil and Gas Market to drive the demand

The United States is currently one of the significant markets of oil and gas. As per the research conducted, the oil and gas market in the United States is expected to grow at nearly 7% during the forecast period. The increase in oil prices and reduction in the cost of machinery is expected to massively drive the market. This business management software ensures the smooth functioning of all the key activities and coherence at various levels. By utilizing the checklist feature, which includes inspections, site surveys, maintenance procedures, etc. efficiency offered by the oil and gas companies sky-rockets.

Attributes Details
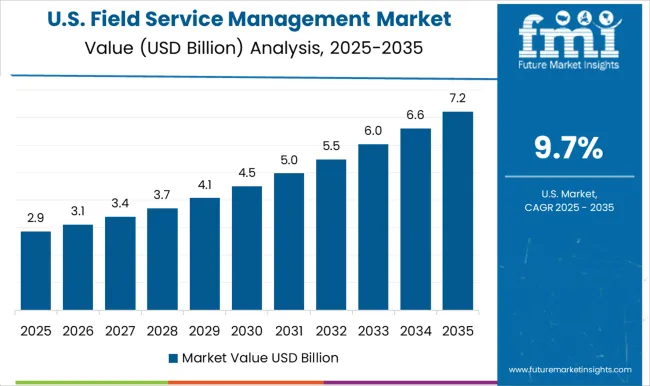
United States Market Expected Size (2033) US$ 4.3 billion
United States Market Absolute Dollar Growth US$ 2.8 billion
CAGR % 2017 to 2022 15.3%

United Kingdom: Burgeoning Fire Detection Market Presents Ample Opportunity

The United Kingdom is known for its huge fire and life safety market. In 2021, the fire detection market was valued at close to US$ 1.5 billion, and it is expected to grow at 6%. The application of field service management in the fire detection market ensures that the equipment and safety systems run at peak efficiency. The field service management provides appropriate services which assist in the functioning of this equipment. The business software that is used in field service management helps in monitoring security technologies, responding to customers, and managing compliance.

Attributes Details
United Kingdom Market Expected Size (2033) US$ 959.2 million
United Kingdom Market Absolute Dollar Growth US$ 613.3 million
CAGR % 2017 to 2022 14.8%

China: Medical Devices Market all set to drive the growth

China is in the second spot when it comes to the medical devices market. Increasing investment in healthcare infrastructure and a surging geriatric population are some of the factors driving growth. The field service operations help in improving the sales and service of medical device manufacturers. The installation, repair, and maintenance of medical devices are taken care of by the field service management. Through the software of field service management, companies can adopt a better way of tracking crucial records, which is useful for compliance. These also shorten the billing process by integrating the invoice procedure into the accounting systems.

Attributes Details
China Market Expected Size (2033) US$ 468.6 million
China Market Absolute Dollar Growth US$ 294.5 million
CAGR % 2017 to 2022 14.2%

Japan: IT Industry to propel the demand for Field Service Management

Japan has always exhibited dominance when it comes to Information Technology. In 2021, the IT market in Japan was valued at a mammoth US$ 450 billion. Internet service providers and communications enterprises are looking for ways to improve service delivery. The software that is being used by the field service management system can design and install complex internet infrastructure. The technology also helps IT companies to set up recurring maintenance plans to ensure the smooth functioning of the installed internet systems. The technology also provides a foundation to handle complex data architectures.

Attributes Details
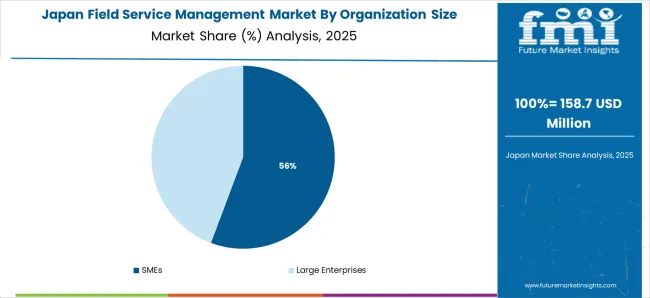
Japan Market Expected Size (2033) US$ 715.5 million
Japan Market Absolute Dollar Growth US$ 435.2 million
CAGR % 2017 to 2022 13.7%

South Korea: Surging Construction Market to fuel the demand

The South Korea construction market was valued at US$ 240 billion in 2021. Massive demand for shipbuilding is expected to further surge the market growth during the forecast period. Since the construction industry is an amalgamation of on-site and off-site work, the field service management system can efficiently integrate field and office work. This technology maintains an effective communication channel between the office staff and field workers. Through software tools, supervisors can easily manage daily operations. The documentation process is also simplified and these folders are documented in a central place. This makes the retrieval of information extremely simple.

Attributes Details
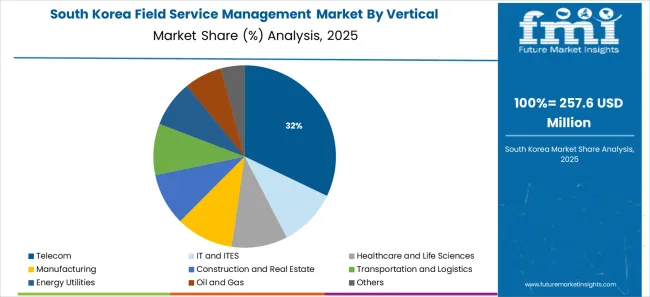
South Korea Market Expected Size (2033) US$ 434.9 million
South Korea Market Absolute Dollar Growth US$ 257.9 million
CAGR % 2017 to 2022 12.3%

Segmentation Insights

Segment Organization Size
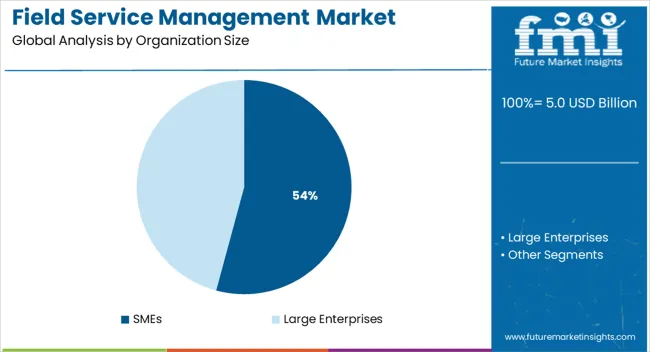
Attributes Large Enterprises
CAGR (2017 to 2022) 12.6%
CAGR (2023 to 2033) 11.1%
Segment Deployment
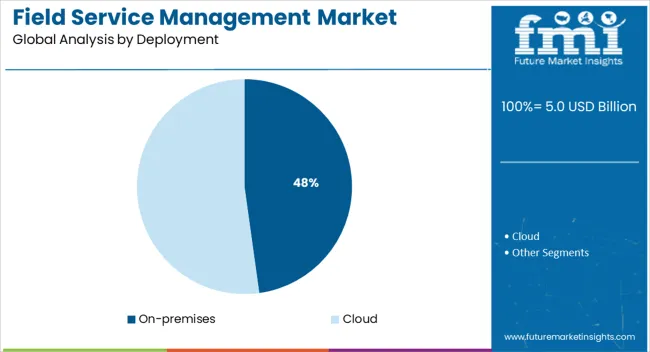
Attributes On-premises
CAGR (2017 to 2022) 12.4%
CAGR (2023 to 2033) 10.8%

Which Organization Size is expected to be the Leading Market?

The large enterprise segment is anticipated to make a significant contribution to the growth of the market. There is a higher adoption of field service management solutions in large enterprises. The trend is expected to continue throughout the forecast period. The evolution of technology and the growing adoption of BYOD culture in enterprises is expected to propel the market in the forecast period. Owing to the size of the organization, the frequency of application may be much more in large enterprises as compared to SMEs.

Which Deployment Type is expected to be in high demand?

As per the estimations, the on-premise segment is anticipated to witness a higher expansion rate during the forecast period. The development of the segment can be attributed to its ability to provide security and flexibility offered by them while retrieving data. On-premise solutions are installed in an enterprise’s IT infrastructure and are operated by IT staff.

The on-premise segment demands high initial investment by organizations. However, they do not require incremental expenses. They also lessen the reliance of companies on third-party applications, which could pose a significant threat to the personal details of the end user. The ease of integration with the existing IT infrastructure is more as compared to the cloud deployment.

Newbies Find a Way Out for Calculating Hourly Wages

The start-ups have made creative use of field service management and have developed software for calculating hourly wages. The software has been providing features like shift management, schedule creation, training, and evaluation of employees. The employees and managers can collaborate on scheduling shifts, and the platform automates scheduling as per availability.

Workrise: The start-up has been providing employee wellness tracking and a management platform. It has also been providing employee wellness and happiness indices. Workrise has mainly been catering to construction, solar, defense, upstream oil and gas, and midstream oil and gas. In 2021, Workrise raised US$ 300 million in the Series E round which was led by Baillie Gifford.
Key players focus on Strategic Alliance to drive Clean Energy Economy

The manufacturers operating in the market are entering into strategic partnerships with players from other niches. The idea is to curb carbon emissions and power the clean energy economy. Through this alliance, it is expected that electricity of more than 2.5 gigawatts might be generated by the usage of solar panels. In January 2023, Microsoft and Qcells announced a strategic collaboration to contain carbon emissions, and focus more on the renewable source of energy.

Key developments in the market:

  • In February 2023, Microsoft rolled out ChatGPT-powered Teams premium.
  • In January 2023, Oracle and Red Hat expanded collaboration to bring Red Hat Enterprise Linux to Oracle cloud infrastructure.

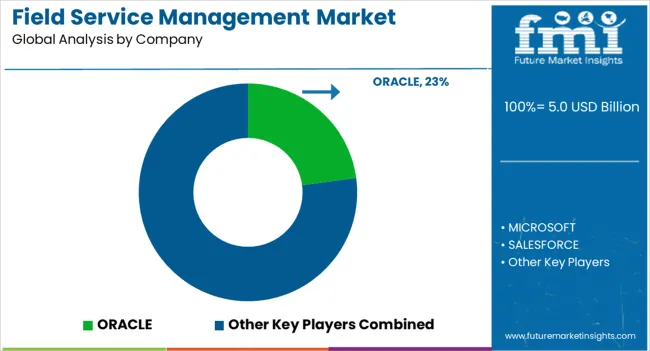
Dominant field service management companies are

Company

Description

Microsoft

Microsoft has been enabling digital transformation in the era of an intelligent cloud and intelligent edge. The mission has always been to empower every person and organization on the planet to achieve much more. The company has been offering cloud services to every organization, ranging from local data centers to start-ups, businesses, and government agencies. Microsoft has been helping businesses to reimagine how they can bring together people, data, and processes to create value for their customers. The cyber security engagement center brings together the capabilities to foster collaborations with public and private sector organizations.

Oracle

Oracle has been at the forefront of building a vibrant future that is technologically robust and environmentally friendly. The company has been taking bold and urgent action to drive sustainable development. Oracle has been offering more than 100 cloud infrastructure and platform services. Across application and infrastructure, with public and hybrid cloud options, Oracle has been supporting local access, regional compliance, and true business continuity.

Salesforce

Salesforce is the world’s number one Customer Relationship Management platform. It enables marketing, sales, commerce, service, and IT teams to work as one from anywhere. Using salesforce’s Customer 360, employees can focus on what is right at a given point in time for a business. The company has always been working on trust, customer success, innovation, equality, and sustainability. The company has always championed its customers to achieve extraordinary things.

Other key players profiled: SERVICEMAX and SAP SE

Market Segmentation

By Organization Size:

  • SMEs
  • Large Enterprises

By Vertical:

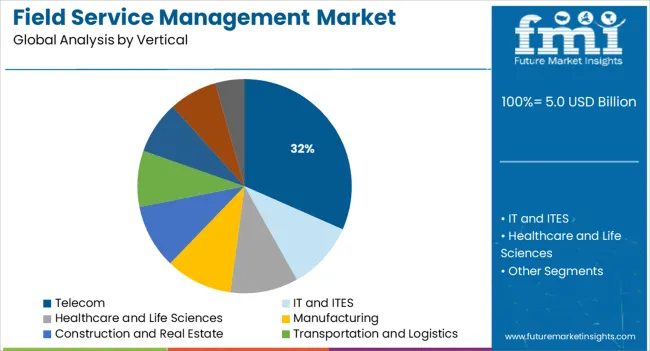
  • Telecom
  • IT and ITES
  • Healthcare and Life Sciences
  • Manufacturing
  • Construction and Real Estate
  • Transportation and Logistics
  • Energy Utilities
  • Oil and Gas
  • Others

By Deployment:

  • On-premises
  • Cloud

By Component:

  • Solutions (Schedule, Dispatch, and Route Optimization, Customer Management, Work Order Management, Inventory Management, Service Contract Management, Reporting, and Analytics)
  • Services (Integration and Implementation Services, Training and Support Services, Consulting Services)

By Region:

  • North America
  • Latin America
  • Asia Pacific
  • The Middle East and Africa
  • Europe

Frequently Asked Questions

How big is the Field Service Management Market size?

The field service management market size is valued at US$ 4.2 billion in 2023.

What is the Field Service Management Market’s projected CAGR?

The field service management market is anticipated to thrive at an 11.4% CAGR from 2023 to 2033.

What is the anticipated CAGR in the Field Service Management Market for the Asia Pacific region?

The field service management market in Asia Pacific is set to rise at 10.7% CAGR through 2033.

What is the absolute dollar growth for the United States Field Service Management Market?

The United States field service management market is anticipated to exhibit an absolute dollar growth worth US$ 2.8 billion by 2033.

What is the CAGR of the leading deployment segment in the Field Service Management Market?

The on-premises segment is projected to develop at a 10.8% CAGR from 2023 to 2033.

Table of Content

1. Executive Summary | Field Service Management Market 

    1.1. Global Market Outlook

    1.2. Demand-side Trends

    1.3. Supply-side Trends

    1.4. Technology Roadmap Analysis

    1.5. Analysis and Recommendations

2. Market Overview

    2.1. Market Coverage / Taxonomy

    2.2. Market Definition / Scope / Limitations

3. Market Background

    3.1. Market Dynamics

        3.1.1. Drivers

        3.1.2. Restraints

        3.1.3. Opportunity

        3.1.4. Trends

    3.2. Scenario Forecast

        3.2.1. Demand in Optimistic Scenario

        3.2.2. Demand in Likely Scenario

        3.2.3. Demand in Conservative Scenario

    3.3. Opportunity Map Analysis

    3.4. Investment Feasibility Matrix

    3.5. PESTLE and Porter’s Analysis

    3.6. Regulatory Landscape

        3.6.1. By Key Regions

        3.6.2. By Key Countries

    3.7. Regional Parent Market Outlook

4. Global Market Analysis 2017 to 2022 and Forecast, 2023 to 2033

    4.1. Historical Market Size Value (US$ Million) Analysis, 2017 to 2022

    4.2. Current and Future Market Size Value (US$ Million) Projections, 2023 to 2033

        4.2.1. Y-o-Y Growth Trend Analysis

        4.2.2. Absolute $ Opportunity Analysis

5. Global Market Analysis 2017 to 2022 and Forecast 2023 to 2033, By Organization Size

    5.1. Introduction / Key Findings

    5.2. Historical Market Size Value (US$ Million) Analysis By Organization Size, 2017 to 2022

    5.3. Current and Future Market Size Value (US$ Million) Analysis and Forecast By Organization Size, 2023 to 2033

        5.3.1. SMEs

        5.3.2. Large Enterprises

    5.4. Y-o-Y Growth Trend Analysis By Organization Size, 2017 to 2022

    5.5. Absolute $ Opportunity Analysis By Organization Size, 2023 to 2033

6. Global Market Analysis 2017 to 2022 and Forecast 2023 to 2033, By Vertical

    6.1. Introduction / Key Findings

    6.2. Historical Market Size Value (US$ Million) Analysis By Vertical, 2017 to 2022

    6.3. Current and Future Market Size Value (US$ Million) Analysis and Forecast By Vertical, 2023 to 2033

        6.3.1. Telecom

        6.3.2. IT and ITES

        6.3.3. Healthcare and Life Sciences

        6.3.4. Manufacturing

        6.3.5. Construction and Real Estate

        6.3.6. Transportation and Logistics

        6.3.7. Energy Utilities

        6.3.8. Oil and Gas

        6.3.9. Others

    6.4. Y-o-Y Growth Trend Analysis By Vertical, 2017 to 2022

    6.5. Absolute $ Opportunity Analysis By Vertical, 2023 to 2033

7. Global Market Analysis 2017 to 2022 and Forecast 2023 to 2033, By Deployment 

    7.1. Introduction / Key Findings

    7.2. Historical Market Size Value (US$ Million) Analysis By Deployment , 2017 to 2022

    7.3. Current and Future Market Size Value (US$ Million) Analysis and Forecast By Deployment , 2023 to 2033

        7.3.1. On-Premises

        7.3.2. Cloud

    7.4. Y-o-Y Growth Trend Analysis By Deployment , 2017 to 2022

    7.5. Absolute $ Opportunity Analysis By Deployment , 2023 to 2033

8. Global Market Analysis 2017 to 2022 and Forecast 2023 to 2033, By Component

    8.1. Introduction / Key Findings

    8.2. Historical Market Size Value (US$ Million) Analysis By Component, 2017 to 2022

    8.3. Current and Future Market Size Value (US$ Million) Analysis and Forecast By Component, 2023 to 2033

        8.3.1. Solutions

            8.3.1.1. Schedule

            8.3.1.2. Dispatch, and Route Optimization

            8.3.1.3. Customer Management

            8.3.1.4. Work Order Management

            8.3.1.5. Inventory Management

            8.3.1.6. Service Contract Management

            8.3.1.7. Reporting and Analytics

        8.3.2. Services

            8.3.2.1. Integration and Implementation Services

            8.3.2.2. Training and Support Services

            8.3.2.3. Consulting Services

    8.4. Y-o-Y Growth Trend Analysis By Component, 2017 to 2022

    8.5. Absolute $ Opportunity Analysis By Component, 2023 to 2033

9. Global Market Analysis 2017 to 2022 and Forecast 2023 to 2033, By Region

    9.1. Introduction

    9.2. Historical Market Size Value (US$ Million) Analysis By Region, 2017 to 2022

    9.3. Current Market Size Value (US$ Million) Analysis and Forecast By Region, 2023 to 2033

        9.3.1. North America

        9.3.2. Latin America

        9.3.3. Europe

        9.3.4. Asia Pacific

        9.3.5. Middle East and Africa

    9.4. Market Attractiveness Analysis By Region

10. North America Market Analysis 2017 to 2022 and Forecast 2023 to 2033, By Country

    10.1. Historical Market Size Value (US$ Million) Trend Analysis By Market Taxonomy, 2017 to 2022

    10.2. Market Size Value (US$ Million) Forecast By Market Taxonomy, 2023 to 2033

        10.2.1. By Country

            10.2.1.1. USA

            10.2.1.2. Canada

        10.2.2. By Organization Size

        10.2.3. By Vertical

        10.2.4. By Deployment

        10.2.5. By Component

    10.3. Market Attractiveness Analysis

        10.3.1. By Country

        10.3.2. By Organization Size

        10.3.3. By Vertical

        10.3.4. By Deployment

        10.3.5. By Component

    10.4. Key Takeaways

11. Latin America Market Analysis 2017 to 2022 and Forecast 2023 to 2033, By Country

    11.1. Historical Market Size Value (US$ Million) Trend Analysis By Market Taxonomy, 2017 to 2022

    11.2. Market Size Value (US$ Million) Forecast By Market Taxonomy, 2023 to 2033

        11.2.1. By Country

            11.2.1.1. Brazil

            11.2.1.2. Mexico

            11.2.1.3. Rest of Latin America

        11.2.2. By Organization Size

        11.2.3. By Vertical

        11.2.4. By Deployment

        11.2.5. By Component

    11.3. Market Attractiveness Analysis

        11.3.1. By Country

        11.3.2. By Organization Size

        11.3.3. By Vertical

        11.3.4. By Deployment

        11.3.5. By Component

    11.4. Key Takeaways

12. Europe Market Analysis 2017 to 2022 and Forecast 2023 to 2033, By Country

    12.1. Historical Market Size Value (US$ Million) Trend Analysis By Market Taxonomy, 2017 to 2022

    12.2. Market Size Value (US$ Million) Forecast By Market Taxonomy, 2023 to 2033

        12.2.1. By Country

            12.2.1.1. United Kingdom

            12.2.1.2. Spain

            12.2.1.3. Germany

            12.2.1.4. Italy

            12.2.1.5. France

            12.2.1.6. Rest of Europe

        12.2.2. By Organization Size

        12.2.3. By Vertical

        12.2.4. By Deployment

        12.2.5. By Component

    12.3. Market Attractiveness Analysis

        12.3.1. By Country

        12.3.2. By Organization Size

        12.3.3. By Vertical

        12.3.4. By Deployment

        12.3.5. By Component

    12.4. Key Takeaways

13. Asia Pacific Market Analysis 2017 to 2022 and Forecast 2023 to 2033, By Country

    13.1. Historical Market Size Value (US$ Million) Trend Analysis By Market Taxonomy, 2017 to 2022

    13.2. Market Size Value (US$ Million) Forecast By Market Taxonomy, 2023 to 2033

        13.2.1. By Country

            13.2.1.1. India

            13.2.1.2. China

            13.2.1.3. Japan

            13.2.1.4. Australia

            13.2.1.5. Rest of Asia Pacific

        13.2.2. By Organization Size

        13.2.3. By Vertical

        13.2.4. By Deployment

        13.2.5. By Component

    13.3. Market Attractiveness Analysis

        13.3.1. By Country

        13.3.2. By Organization Size

        13.3.3. By Vertical

        13.3.4. By Deployment

        13.3.5. By Component

    13.4. Key Takeaways

14. Middle East and Africa Market Analysis 2017 to 2022 and Forecast 2023 to 2033, By Country

    14.1. Historical Market Size Value (US$ Million) Trend Analysis By Market Taxonomy, 2017 to 2022

    14.2. Market Size Value (US$ Million) Forecast By Market Taxonomy, 2023 to 2033

        14.2.1. By Country

            14.2.1.1. South Africa

            14.2.1.2. GCC Countries

            14.2.1.3. Rest of Middle East and Africa

        14.2.2. By Organization Size

        14.2.3. By Vertical

        14.2.4. By Deployment

        14.2.5. By Component

    14.3. Market Attractiveness Analysis

        14.3.1. By Country

        14.3.2. By Organization Size

        14.3.3. By Vertical

        14.3.4. By Deployment

        14.3.5. By Component

    14.4. Key Takeaways

15. Key Countries Market Analysis

    15.1. USA

        15.1.1. Pricing Analysis

        15.1.2. Market Share Analysis, 2022

            15.1.2.1. By Organization Size

            15.1.2.2. By Vertical

            15.1.2.3. By Deployment

            15.1.2.4. By Component

    15.2. Canada

        15.2.1. Pricing Analysis

        15.2.2. Market Share Analysis, 2022

            15.2.2.1. By Organization Size

            15.2.2.2. By Vertical

            15.2.2.3. By Deployment

            15.2.2.4. By Component

    15.3. Brazil

        15.3.1. Pricing Analysis

        15.3.2. Market Share Analysis, 2022

            15.3.2.1. By Organization Size

            15.3.2.2. By Vertical

            15.3.2.3. By Deployment

            15.3.2.4. By Component

    15.4. Mexico

        15.4.1. Pricing Analysis

        15.4.2. Market Share Analysis, 2022

            15.4.2.1. By Organization Size

            15.4.2.2. By Vertical

            15.4.2.3. By Deployment

            15.4.2.4. By Component

    15.5. United Kingdom

        15.5.1. Pricing Analysis

        15.5.2. Market Share Analysis, 2022

            15.5.2.1. By Organization Size

            15.5.2.2. By Vertical

            15.5.2.3. By Deployment

            15.5.2.4. By Component

    15.6. Spain

        15.6.1. Pricing Analysis

        15.6.2. Market Share Analysis, 2022

            15.6.2.1. By Organization Size

            15.6.2.2. By Vertical

            15.6.2.3. By Deployment

            15.6.2.4. By Component

    15.7. Germany

        15.7.1. Pricing Analysis

        15.7.2. Market Share Analysis, 2022

            15.7.2.1. By Organization Size

            15.7.2.2. By Vertical

            15.7.2.3. By Deployment

            15.7.2.4. By Component

    15.8. Italy

        15.8.1. Pricing Analysis

        15.8.2. Market Share Analysis, 2022

            15.8.2.1. By Organization Size

            15.8.2.2. By Vertical

            15.8.2.3. By Deployment

            15.8.2.4. By Component

    15.9. France

        15.9.1. Pricing Analysis

        15.9.2. Market Share Analysis, 2022

            15.9.2.1. By Organization Size

            15.9.2.2. By Vertical

            15.9.2.3. By Deployment

            15.9.2.4. By Component

    15.10. India

        15.10.1. Pricing Analysis

        15.10.2. Market Share Analysis, 2022

            15.10.2.1. By Organization Size

            15.10.2.2. By Vertical

            15.10.2.3. By Deployment

            15.10.2.4. By Component

    15.11. China

        15.11.1. Pricing Analysis

        15.11.2. Market Share Analysis, 2022

            15.11.2.1. By Organization Size

            15.11.2.2. By Vertical

            15.11.2.3. By Deployment

            15.11.2.4. By Component

    15.12. Japan

        15.12.1. Pricing Analysis

        15.12.2. Market Share Analysis, 2022

            15.12.2.1. By Organization Size

            15.12.2.2. By Vertical

            15.12.2.3. By Deployment

            15.12.2.4. By Component

    15.13. Australia & New Zealand

        15.13.1. Pricing Analysis

        15.13.2. Market Share Analysis, 2022

            15.13.2.1. By Organization Size

            15.13.2.2. By Vertical

            15.13.2.3. By Deployment

            15.13.2.4. By Component

    15.14. South Africa

        15.14.1. Pricing Analysis

        15.14.2. Market Share Analysis, 2022

            15.14.2.1. By Organization Size

            15.14.2.2. By Vertical

            15.14.2.3. By Deployment

            15.14.2.4. By Component

    15.15. GCC Countries

        15.15.1. Pricing Analysis

        15.15.2. Market Share Analysis, 2022

            15.15.2.1. By Organization Size

            15.15.2.2. By Vertical

            15.15.2.3. By Deployment

            15.15.2.4. By Component

16. Market Structure Analysis

    16.1. Competition Dashboard

    16.2. Competition Benchmarking

    16.3. Market Share Analysis of Top Players

        16.3.1. By Regional

        16.3.2. By Organization Size

        16.3.3. By Vertical

        16.3.4. By Deployment

        16.3.5. By Component

17. Competition Analysis

    17.1. Competition Deep Dive

        17.1.1. ORACLE

            17.1.1.1. Overview

            17.1.1.2. Product Portfolio

            17.1.1.3. Profitability by Market Segments

            17.1.1.4. Sales Footprint

            17.1.1.5. Strategy Overview

                17.1.1.5.1. Marketing Strategy

        17.1.2. MICROSOFT

            17.1.2.1. Overview

            17.1.2.2. Product Portfolio

            17.1.2.3. Profitability by Market Segments

            17.1.2.4. Sales Footprint

            17.1.2.5. Strategy Overview

                17.1.2.5.1. Marketing Strategy

        17.1.3. SALESFORCE

            17.1.3.1. Overview

            17.1.3.2. Product Portfolio

            17.1.3.3. Profitability by Market Segments

            17.1.3.4. Sales Footprint

            17.1.3.5. Strategy Overview

                17.1.3.5.1. Marketing Strategy

        17.1.4. SERVICEMAX

            17.1.4.1. Overview

            17.1.4.2. Product Portfolio

            17.1.4.3. Profitability by Market Segments

            17.1.4.4. Sales Footprint

            17.1.4.5. Strategy Overview

                17.1.4.5.1. Marketing Strategy

        17.1.5. SAP SE

            17.1.5.1. Overview

            17.1.5.2. Product Portfolio

            17.1.5.3. Profitability by Market Segments

            17.1.5.4. Sales Footprint

            17.1.5.5. Strategy Overview

                17.1.5.5.1. Marketing Strategy

        17.1.6. TRIMBLE

            17.1.6.1. Overview

            17.1.6.2. Product Portfolio

            17.1.6.3. Profitability by Market Segments

            17.1.6.4. Sales Footprint

            17.1.6.5. Strategy Overview

                17.1.6.5.1. Marketing Strategy

        17.1.7. COMARCH

            17.1.7.1. Overview

            17.1.7.2. Product Portfolio

            17.1.7.3. Profitability by Market Segments

            17.1.7.4. Sales Footprint

            17.1.7.5. Strategy Overview

                17.1.7.5.1. Marketing Strategy

        17.1.8. SERVICEPOWER

            17.1.8.1. Overview

            17.1.8.2. Product Portfolio

            17.1.8.3. Profitability by Market Segments

            17.1.8.4. Sales Footprint

            17.1.8.5. Strategy Overview

                17.1.8.5.1. Marketing Strategy

        17.1.9. OVERIT

            17.1.9.1. Overview

            17.1.9.2. Product Portfolio

            17.1.9.3. Profitability by Market Segments

            17.1.9.4. Sales Footprint

            17.1.9.5. Strategy Overview

                17.1.9.5.1. Marketing Strategy

        17.1.10. FIELDAWARE

            17.1.10.1. Overview

            17.1.10.2. Product Portfolio

            17.1.10.3. Profitability by Market Segments

            17.1.10.4. Sales Footprint

            17.1.10.5. Strategy Overview

                17.1.10.5.1. Marketing Strategy

18. Assumptions & Acronyms Used

19. Research Methodology

Don't pay for what you don't need

Customize your report by selecting specific countries or regions and save 30%!

List of Tables

Table 1: Global Market Value (US$ Million) Forecast by Region, 2017 to 2033

Table 2: Global Market Value (US$ Million) Forecast by Organization Size, 2017 to 2033

Table 3: Global Market Value (US$ Million) Forecast by Vertical, 2017 to 2033

Table 4: Global Market Value (US$ Million) Forecast by Deployment , 2017 to 2033

Table 5: Global Market Value (US$ Million) Forecast by Component, 2017 to 2033

Table 6: North America Market Value (US$ Million) Forecast by Country, 2017 to 2033

Table 7: North America Market Value (US$ Million) Forecast by Organization Size, 2017 to 2033

Table 8: North America Market Value (US$ Million) Forecast by Vertical, 2017 to 2033

Table 9: North America Market Value (US$ Million) Forecast by Deployment , 2017 to 2033

Table 10: North America Market Value (US$ Million) Forecast by Component, 2017 to 2033

Table 11: Latin America Market Value (US$ Million) Forecast by Country, 2017 to 2033

Table 12: Latin America Market Value (US$ Million) Forecast by Organization Size, 2017 to 2033

Table 13: Latin America Market Value (US$ Million) Forecast by Vertical, 2017 to 2033

Table 14: Latin America Market Value (US$ Million) Forecast by Deployment , 2017 to 2033

Table 15: Latin America Market Value (US$ Million) Forecast by Component, 2017 to 2033

Table 16: Europe Market Value (US$ Million) Forecast by Country, 2017 to 2033

Table 17: Europe Market Value (US$ Million) Forecast by Organization Size, 2017 to 2033

Table 18: Europe Market Value (US$ Million) Forecast by Vertical, 2017 to 2033

Table 19: Europe Market Value (US$ Million) Forecast by Deployment , 2017 to 2033

Table 20: Europe Market Value (US$ Million) Forecast by Component, 2017 to 2033

Table 21: Asia Pacific Market Value (US$ Million) Forecast by Country, 2017 to 2033

Table 22: Asia Pacific Market Value (US$ Million) Forecast by Organization Size, 2017 to 2033

Table 23: Asia Pacific Market Value (US$ Million) Forecast by Vertical, 2017 to 2033

Table 24: Asia Pacific Market Value (US$ Million) Forecast by Deployment , 2017 to 2033

Table 25: Asia Pacific Market Value (US$ Million) Forecast by Component, 2017 to 2033

Table 26: Middle East and Africa Market Value (US$ Million) Forecast by Country, 2017 to 2033

Table 27: Middle East and Africa Market Value (US$ Million) Forecast by Organization Size, 2017 to 2033

Table 28: Middle East and Africa Market Value (US$ Million) Forecast by Vertical, 2017 to 2033

Table 29: Middle East and Africa Market Value (US$ Million) Forecast by Deployment , 2017 to 2033

Table 30: Middle East and Africa Market Value (US$ Million) Forecast by Component, 2017 to 2033
Sudip Saha
Sudip Saha

Principal Consultant

Talk to Analyst

Find your sweet spots for generating winning opportunities in this market.

List of Charts

Figure 1: Global Market Value (US$ Million) by Organization Size, 2023 to 2033

Figure 2: Global Market Value (US$ Million) by Vertical, 2023 to 2033

Figure 3: Global Market Value (US$ Million) by Deployment , 2023 to 2033

Figure 4: Global Market Value (US$ Million) by Component, 2023 to 2033

Figure 5: Global Market Value (US$ Million) by Region, 2023 to 2033

Figure 6: Global Market Value (US$ Million) Analysis by Region, 2017 to 2033

Figure 7: Global Market Value Share (%) and BPS Analysis by Region, 2023 to 2033

Figure 8: Global Market Y-o-Y Growth (%) Projections by Region, 2023 to 2033

Figure 9: Global Market Value (US$ Million) Analysis by Organization Size, 2017 to 2033

Figure 10: Global Market Value Share (%) and BPS Analysis by Organization Size, 2023 to 2033

Figure 11: Global Market Y-o-Y Growth (%) Projections by Organization Size, 2023 to 2033

Figure 12: Global Market Value (US$ Million) Analysis by Vertical, 2017 to 2033

Figure 13: Global Market Value Share (%) and BPS Analysis by Vertical, 2023 to 2033

Figure 14: Global Market Y-o-Y Growth (%) Projections by Vertical, 2023 to 2033

Figure 15: Global Market Value (US$ Million) Analysis by Deployment , 2017 to 2033

Figure 16: Global Market Value Share (%) and BPS Analysis by Deployment , 2023 to 2033

Figure 17: Global Market Y-o-Y Growth (%) Projections by Deployment , 2023 to 2033

Figure 18: Global Market Value (US$ Million) Analysis by Component, 2017 to 2033

Figure 19: Global Market Value Share (%) and BPS Analysis by Component, 2023 to 2033

Figure 20: Global Market Y-o-Y Growth (%) Projections by Component, 2023 to 2033

Figure 21: Global Market Attractiveness by Organization Size, 2023 to 2033

Figure 22: Global Market Attractiveness by Vertical, 2023 to 2033

Figure 23: Global Market Attractiveness by Deployment , 2023 to 2033

Figure 24: Global Market Attractiveness by Component, 2023 to 2033

Figure 25: Global Market Attractiveness by Region, 2023 to 2033

Figure 26: North America Market Value (US$ Million) by Organization Size, 2023 to 2033

Figure 27: North America Market Value (US$ Million) by Vertical, 2023 to 2033

Figure 28: North America Market Value (US$ Million) by Deployment , 2023 to 2033

Figure 29: North America Market Value (US$ Million) by Component, 2023 to 2033

Figure 30: North America Market Value (US$ Million) by Country, 2023 to 2033

Figure 31: North America Market Value (US$ Million) Analysis by Country, 2017 to 2033

Figure 32: North America Market Value Share (%) and BPS Analysis by Country, 2023 to 2033

Figure 33: North America Market Y-o-Y Growth (%) Projections by Country, 2023 to 2033

Figure 34: North America Market Value (US$ Million) Analysis by Organization Size, 2017 to 2033

Figure 35: North America Market Value Share (%) and BPS Analysis by Organization Size, 2023 to 2033

Figure 36: North America Market Y-o-Y Growth (%) Projections by Organization Size, 2023 to 2033

Figure 37: North America Market Value (US$ Million) Analysis by Vertical, 2017 to 2033

Figure 38: North America Market Value Share (%) and BPS Analysis by Vertical, 2023 to 2033

Figure 39: North America Market Y-o-Y Growth (%) Projections by Vertical, 2023 to 2033

Figure 40: North America Market Value (US$ Million) Analysis by Deployment , 2017 to 2033

Figure 41: North America Market Value Share (%) and BPS Analysis by Deployment , 2023 to 2033

Figure 42: North America Market Y-o-Y Growth (%) Projections by Deployment , 2023 to 2033

Figure 43: North America Market Value (US$ Million) Analysis by Component, 2017 to 2033

Figure 44: North America Market Value Share (%) and BPS Analysis by Component, 2023 to 2033

Figure 45: North America Market Y-o-Y Growth (%) Projections by Component, 2023 to 2033

Figure 46: North America Market Attractiveness by Organization Size, 2023 to 2033

Figure 47: North America Market Attractiveness by Vertical, 2023 to 2033

Figure 48: North America Market Attractiveness by Deployment , 2023 to 2033

Figure 49: North America Market Attractiveness by Component, 2023 to 2033

Figure 50: North America Market Attractiveness by Country, 2023 to 2033

Figure 51: Latin America Market Value (US$ Million) by Organization Size, 2023 to 2033

Figure 52: Latin America Market Value (US$ Million) by Vertical, 2023 to 2033

Figure 53: Latin America Market Value (US$ Million) by Deployment , 2023 to 2033

Figure 54: Latin America Market Value (US$ Million) by Component, 2023 to 2033

Figure 55: Latin America Market Value (US$ Million) by Country, 2023 to 2033

Figure 56: Latin America Market Value (US$ Million) Analysis by Country, 2017 to 2033

Figure 57: Latin America Market Value Share (%) and BPS Analysis by Country, 2023 to 2033

Figure 58: Latin America Market Y-o-Y Growth (%) Projections by Country, 2023 to 2033

Figure 59: Latin America Market Value (US$ Million) Analysis by Organization Size, 2017 to 2033

Figure 60: Latin America Market Value Share (%) and BPS Analysis by Organization Size, 2023 to 2033

Figure 61: Latin America Market Y-o-Y Growth (%) Projections by Organization Size, 2023 to 2033

Figure 62: Latin America Market Value (US$ Million) Analysis by Vertical, 2017 to 2033

Figure 63: Latin America Market Value Share (%) and BPS Analysis by Vertical, 2023 to 2033

Figure 64: Latin America Market Y-o-Y Growth (%) Projections by Vertical, 2023 to 2033

Figure 65: Latin America Market Value (US$ Million) Analysis by Deployment , 2017 to 2033

Figure 66: Latin America Market Value Share (%) and BPS Analysis by Deployment , 2023 to 2033

Figure 67: Latin America Market Y-o-Y Growth (%) Projections by Deployment , 2023 to 2033

Figure 68: Latin America Market Value (US$ Million) Analysis by Component, 2017 to 2033

Figure 69: Latin America Market Value Share (%) and BPS Analysis by Component, 2023 to 2033

Figure 70: Latin America Market Y-o-Y Growth (%) Projections by Component, 2023 to 2033

Figure 71: Latin America Market Attractiveness by Organization Size, 2023 to 2033

Figure 72: Latin America Market Attractiveness by Vertical, 2023 to 2033

Figure 73: Latin America Market Attractiveness by Deployment , 2023 to 2033

Figure 74: Latin America Market Attractiveness by Component, 2023 to 2033

Figure 75: Latin America Market Attractiveness by Country, 2023 to 2033

Figure 76: Europe Market Value (US$ Million) by Organization Size, 2023 to 2033

Figure 77: Europe Market Value (US$ Million) by Vertical, 2023 to 2033

Figure 78: Europe Market Value (US$ Million) by Deployment , 2023 to 2033

Figure 79: Europe Market Value (US$ Million) by Component, 2023 to 2033

Figure 80: Europe Market Value (US$ Million) by Country, 2023 to 2033

Figure 81: Europe Market Value (US$ Million) Analysis by Country, 2017 to 2033

Figure 82: Europe Market Value Share (%) and BPS Analysis by Country, 2023 to 2033

Figure 83: Europe Market Y-o-Y Growth (%) Projections by Country, 2023 to 2033

Figure 84: Europe Market Value (US$ Million) Analysis by Organization Size, 2017 to 2033

Figure 85: Europe Market Value Share (%) and BPS Analysis by Organization Size, 2023 to 2033

Figure 86: Europe Market Y-o-Y Growth (%) Projections by Organization Size, 2023 to 2033

Figure 87: Europe Market Value (US$ Million) Analysis by Vertical, 2017 to 2033

Figure 88: Europe Market Value Share (%) and BPS Analysis by Vertical, 2023 to 2033

Figure 89: Europe Market Y-o-Y Growth (%) Projections by Vertical, 2023 to 2033

Figure 90: Europe Market Value (US$ Million) Analysis by Deployment , 2017 to 2033

Figure 91: Europe Market Value Share (%) and BPS Analysis by Deployment , 2023 to 2033

Figure 92: Europe Market Y-o-Y Growth (%) Projections by Deployment , 2023 to 2033

Figure 93: Europe Market Value (US$ Million) Analysis by Component, 2017 to 2033

Figure 94: Europe Market Value Share (%) and BPS Analysis by Component, 2023 to 2033

Figure 95: Europe Market Y-o-Y Growth (%) Projections by Component, 2023 to 2033

Figure 96: Europe Market Attractiveness by Organization Size, 2023 to 2033

Figure 97: Europe Market Attractiveness by Vertical, 2023 to 2033

Figure 98: Europe Market Attractiveness by Deployment , 2023 to 2033

Figure 99: Europe Market Attractiveness by Component, 2023 to 2033

Figure 100: Europe Market Attractiveness by Country, 2023 to 2033

Figure 101: Asia Pacific Market Value (US$ Million) by Organization Size, 2023 to 2033

Figure 102: Asia Pacific Market Value (US$ Million) by Vertical, 2023 to 2033

Figure 103: Asia Pacific Market Value (US$ Million) by Deployment , 2023 to 2033

Figure 104: Asia Pacific Market Value (US$ Million) by Component, 2023 to 2033

Figure 105: Asia Pacific Market Value (US$ Million) by Country, 2023 to 2033

Figure 106: Asia Pacific Market Value (US$ Million) Analysis by Country, 2017 to 2033

Figure 107: Asia Pacific Market Value Share (%) and BPS Analysis by Country, 2023 to 2033

Figure 108: Asia Pacific Market Y-o-Y Growth (%) Projections by Country, 2023 to 2033

Figure 109: Asia Pacific Market Value (US$ Million) Analysis by Organization Size, 2017 to 2033

Figure 110: Asia Pacific Market Value Share (%) and BPS Analysis by Organization Size, 2023 to 2033

Figure 111: Asia Pacific Market Y-o-Y Growth (%) Projections by Organization Size, 2023 to 2033

Figure 112: Asia Pacific Market Value (US$ Million) Analysis by Vertical, 2017 to 2033

Figure 113: Asia Pacific Market Value Share (%) and BPS Analysis by Vertical, 2023 to 2033

Figure 114: Asia Pacific Market Y-o-Y Growth (%) Projections by Vertical, 2023 to 2033

Figure 115: Asia Pacific Market Value (US$ Million) Analysis by Deployment , 2017 to 2033

Figure 116: Asia Pacific Market Value Share (%) and BPS Analysis by Deployment , 2023 to 2033

Figure 117: Asia Pacific Market Y-o-Y Growth (%) Projections by Deployment , 2023 to 2033

Figure 118: Asia Pacific Market Value (US$ Million) Analysis by Component, 2017 to 2033

Figure 119: Asia Pacific Market Value Share (%) and BPS Analysis by Component, 2023 to 2033

Figure 120: Asia Pacific Market Y-o-Y Growth (%) Projections by Component, 2023 to 2033

Figure 121: Asia Pacific Market Attractiveness by Organization Size, 2023 to 2033

Figure 122: Asia Pacific Market Attractiveness by Vertical, 2023 to 2033

Figure 123: Asia Pacific Market Attractiveness by Deployment , 2023 to 2033

Figure 124: Asia Pacific Market Attractiveness by Component, 2023 to 2033

Figure 125: Asia Pacific Market Attractiveness by Country, 2023 to 2033

Figure 126: Middle East and Africa Market Value (US$ Million) by Organization Size, 2023 to 2033

Figure 127: Middle East and Africa Market Value (US$ Million) by Vertical, 2023 to 2033

Figure 128: Middle East and Africa Market Value (US$ Million) by Deployment , 2023 to 2033

Figure 129: Middle East and Africa Market Value (US$ Million) by Component, 2023 to 2033

Figure 130: Middle East and Africa Market Value (US$ Million) by Country, 2023 to 2033

Figure 131: Middle East and Africa Market Value (US$ Million) Analysis by Country, 2017 to 2033

Figure 132: Middle East and Africa Market Value Share (%) and BPS Analysis by Country, 2023 to 2033

Figure 133: Middle East and Africa Market Y-o-Y Growth (%) Projections by Country, 2023 to 2033

Figure 134: Middle East and Africa Market Value (US$ Million) Analysis by Organization Size, 2017 to 2033

Figure 135: Middle East and Africa Market Value Share (%) and BPS Analysis by Organization Size, 2023 to 2033

Figure 136: Middle East and Africa Market Y-o-Y Growth (%) Projections by Organization Size, 2023 to 2033

Figure 137: Middle East and Africa Market Value (US$ Million) Analysis by Vertical, 2017 to 2033

Figure 138: Middle East and Africa Market Value Share (%) and BPS Analysis by Vertical, 2023 to 2033

Figure 139: Middle East and Africa Market Y-o-Y Growth (%) Projections by Vertical, 2023 to 2033

Figure 140: Middle East and Africa Market Value (US$ Million) Analysis by Deployment , 2017 to 2033

Figure 141: Middle East and Africa Market Value Share (%) and BPS Analysis by Deployment , 2023 to 2033

Figure 142: Middle East and Africa Market Y-o-Y Growth (%) Projections by Deployment , 2023 to 2033

Figure 143: Middle East and Africa Market Value (US$ Million) Analysis by Component, 2017 to 2033

Figure 144: Middle East and Africa Market Value Share (%) and BPS Analysis by Component, 2023 to 2033

Figure 145: Middle East and Africa Market Y-o-Y Growth (%) Projections by Component, 2023 to 2033

Figure 146: Middle East and Africa Market Attractiveness by Organization Size, 2023 to 2033

Figure 147: Middle East and Africa Market Attractiveness by Vertical, 2023 to 2033

Figure 148: Middle East and Africa Market Attractiveness by Deployment , 2023 to 2033

Figure 149: Middle East and Africa Market Attractiveness by Component, 2023 to 2033

Figure 150: Middle East and Africa Market Attractiveness by Country, 2023 to 2033

Recommendations

Technology

Cloud Field Service Management (FSM) Market

Published : June 2023

Technology

Service Lifecycle Management Application Market

Published : July 2022

Explore Technology Insights

View Reports

Field Service Management Market