Field Force Automation Market
Field Force Automation Market By Components (Solution, Service), Deployment (On-premises, Services), Organization Size (SMEs, Large Enterprises), Vertical (IT and Telecom, Healthcare and Life Sciences, Manufacturing, Transportation and Logistics, Construction and Real Estate, Energy and Utilities) & Region - Forecast 2022 - 2032
Market Insights on Field Force Automation covering sales outlook, demand forecast & up-to-date key trends
Field Force Automation Market Outlook (2022-2032)
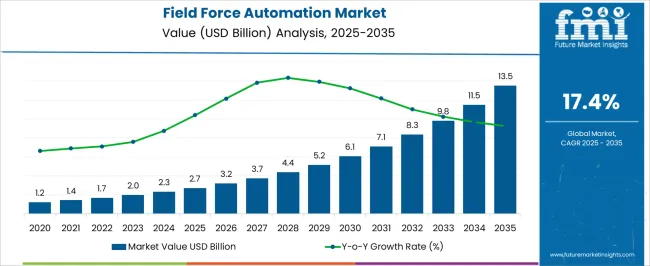
[325 Pages Report] The global field force automation market was estimated at USD 1.7 Billion in 2021, and is expected to reach USD 2 Billion in 2022. The market is projected to secure USD 10.1 Billion while witnessing a growth rate of 17.6% during the forecast period from 2022 to 2032.
Principal growth drivers of the market include increasing mobile internet penetration, growing focus on leveraging advanced technologies, cloud computing, the internet of things (IoT), and AI.
“Increasing adoption of advanced technologies such as AI, ML, and IoT is anticipated to boost the market expansion in the coming time.”
Attributes |
Details |
Field Force Automation Market CAGR (2022-2032) |
17.6% |
Field Force Automation Market (2032) |
US$ 10.1 Billion |
Field Force Automation Market Attraction |
Increasing demand for robust solutions to enhance the efficiency of field forces in real-time and the rising adoption of cloud-based enterprise mobility solutions to fuel the market. |
What Are The Major Factors Contributing To Fuelling The Global Field Force Automation Market?
“Rapid penetration of connected devices and the emergence of advanced technologies are projected to augment the market significantly during the forecast period.”
Growing penetration of connected devices and the advent of the latest technologies are expected to play an important role in driving the market in the forecast period. Sectors such as healthcare and life sciences, IT and Telecom, transportation and logistics, construction, real estate, and others are significant consumers of field force automation.
Besides, ambitious multinationals demand efficient field force automation methods to meet the targets for logistical growth, which is expected to augment the market in the forecast period. In addition, the growing demand for improved workforce productivity will propel the market in the coming time.
The rapid deployment of next-generation technologies such as ML, robotics, cloud computing, and computer vision has resulted in the digital transformation of business entities. This has made a significant impact on the market, propelling the industry size during the forecast period. In addition, players are taking various initiatives that can propel the market notably.
For instance, in December 2019, IFS AB announced the acquisition of U.S based field service management solution (FSM) provider Astea International Inc. The acquisition aims to strengthen the expansion plans for IFS AB by helping it offer an improved FSM offerings.
Let us know your requirement to get
100% FREE customization
What Are The Limitations Of The Field Force Automation Market?
Growing concerns regarding the increasing number of cyberattacks are projected to be the key factor hampering the market during the forecast period. Other than this, the field force automation software consumes too much time while data entry, which is expected to play a significant role in impeding the market during the forecast period.
Besides, they are also difficult to accustom to software systems, which is another salient cause hampering the industry growth.
What Are The Emerging Trends In The Global Field Force Automation Market?
The growing usage of cloud-supported field forces mobile applications is expected to be the emerging trend in the global field force automation market. The growing preference for cloud-based field forces mobile applications can be credited to various benefits such as; flexibility in sharing and retrieving data, high storage capacity, and multiple platform support.
Cloud-based field force mobile applications assist in assigning work orders and working with real-time status updates. Therefore, players in the market are focusing on combining the benefits of cloud storage with field force automation services.
The retail & e-commerce sector is projected to be a significant consumer of force automation solutions. Field force automation services witness significant demand since it assists in reducing high labor costs, raw material cost inflation, and the complex process of supply chain management.
Moreover, the growing revenue motivates retailers to make large investments in sales automation solutions since it offers a detailed analysis of customer requirements, automated control sales operations, and better customer loyalty. This is projected to be another emerging opportunity for market expansion.
Find your sweet spots for generating winning opportunities in this market.
Talk to AnalystComparative View Of Adjacent Field Force Automation Market
Field Force Automation Market :
Attributes |
Field Force Automation Market |
CAGR (2022-2032) |
17.6% |
Market Value (2032) |
USD 10.1 Bn |
Growth Factor |
Rapid penetration of connected devices and the emergence of the latest technologies are expected to play an important role in driving the market in the forecast period |
Opportunity |
Increasing application of cloud-supported field forces mobile applications is expected to offer significant opportunities for market expansion. |
Sales Force Automation Market :
Attributes |
Sales Force Automation Market |
CAGR (2022-2032) |
8% |
Market Value (2032) |
USD 18.98 Bn |
Growth Factor |
Growing adoption of cloud technologies for sales force automation and increasing demand for sales forecasting applications are significant factors boosting the market. |
Opportunity |
Developing countries such as India, China, and Japan are making significant investments in sales process automation which is projected to offer remunerative opportunities for market expansion. |
Industrial Automation Market :
Attributes |
Industrial Automation Market |
CAGR (2022-2032) |
8% |
Market Value (2032) |
USD 308 Bn |
Growth Factor |
Growing demand for connected enterprises and increasing need for mass manufacturing of products is expected to bolster the market in the forecast period. |
Opportunity |
The rising demand for safety compliance automation solutions is projected to offer significant opportunities for market expansion. |
What Is The Segmental Analysis Of The Global Field Force Automation Market?
The global field force automation market can be segmented into deployment, organization size, and vertical.
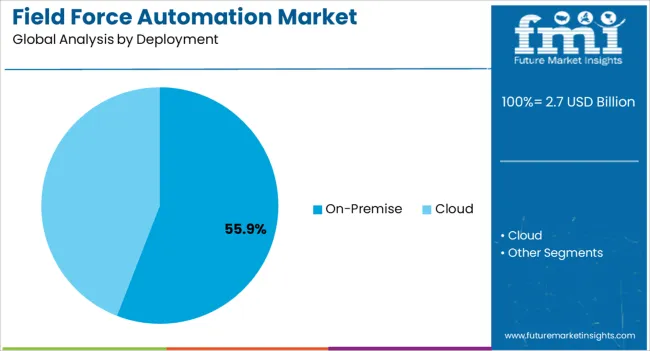
Based on deployment, the global field force automation market can be segmented into cloud and on-premise. As per the analysis, the cloud segment is anticipated to garner a larger market share during the forecast period.
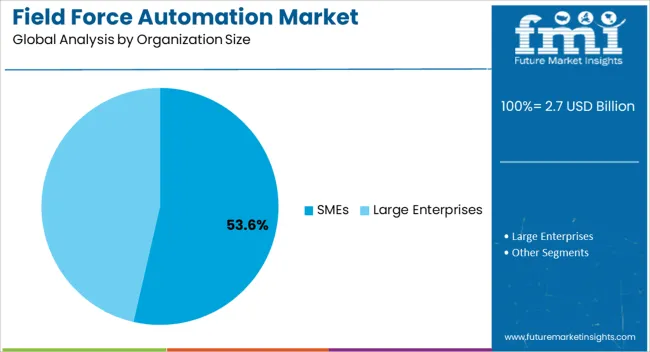
Based on organization size, the global field force automation market can be segmented into larger enterprises and SMEs. The analysis reveals that the large enterprises are predicted to procure the largest market share during the assessment period.
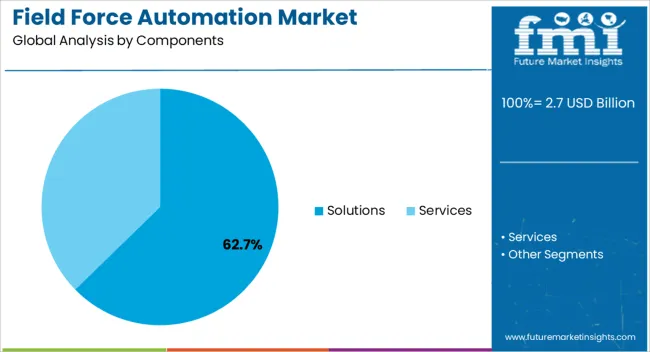
Based on components, the global field force automation market can be segmented into services and solutions. The solutions segment is anticipated to garner a larger market share during the forecast period.
Based on vertical, the global field force automation market can be segmented into IT and Telecom, manufacturing, healthcare, and life sciences, energy and utilities, construction and real estate, and others.

An unified Market Research Subscription Platform, built for today’s disparate research needs.
What Is The Role Of Cloud Segment In Developing The Global Field Force Automation Market?
According to the analysis, based on components, the solution segment is anticipated to lead the market during the forecast period. The segment is expected to witness a growth rate of 16.6% from 2022 to 2032. Growth can be attributed to the integration of solutions with existing systems like FSM, ERP, and CRM.
Moreover, the emergence of advanced features such as daily reporting, automated scheduling, and worker dispatching, mobile workforce monitoring, and real-time communication propels the demand for field force automation solutions. This is projected to augment the industry in the forecast period.
What Is The Contribution Of Deployment Segment In Developing The Market?
As per the analysis, the cloud segment is anticipated to expand at a CAGR of 16.8% during the forecast period. Expansion of the segment can be attributed to the growing preference for cloud-based field force applications. Developing nations such as India, China, and Japan are expected to make significant contributions to strengthening the market.
What Is The Regional Demand Analysis In The Field Force Automation Market?
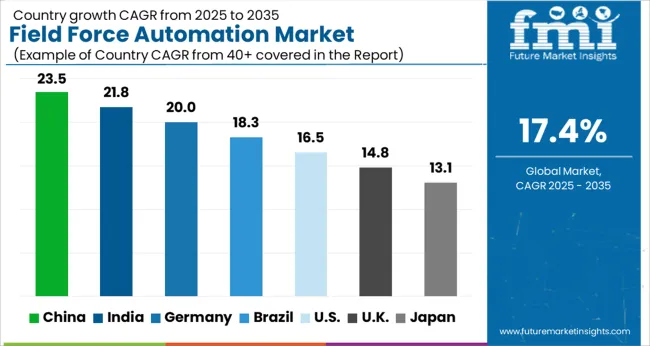
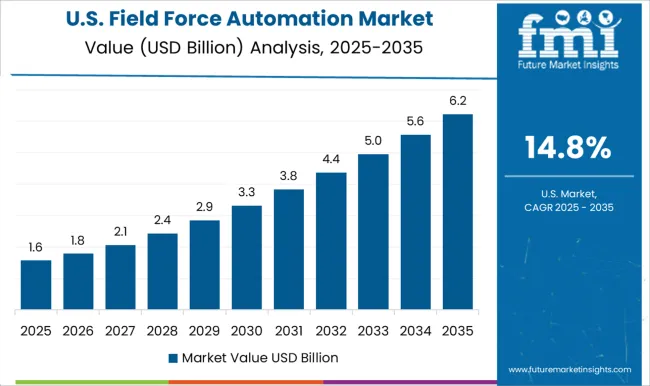
According to the analysis, the global field force automation market is expected to be dominated by the U.S during the forecast period. The country is projected to register a value of US$ 3.5 Billion while recording a CAGR of 17.3% during the forecast period.
Expansion of the U.S market can be attributed to the presence of a large number of field force automation vendors and growing technology among the enterprises. Also, players take various initiatives to expand their reach.
For instance, in 2019, SalesForce, Inc., a US-based cloud software organization acquired ClickSoftware Technologies. The acquisition helped SalesForce to augment its service cloud software and offer better Field Service Lighting (FSL).
According to the analysis, the U.K is another remunerative market. The market is expected to garner US$ 433.4 Mn while expanding at a CAGR of 16.5% during the forecast period from 2022 to 2032. The growth of the U.K market can be attributed to the rapid adoption of advanced technologies like cloud computing, IoT, and AI. Moreover, players in the region are making aggressive investments to augment their reach in the global market.
On the other hand, APAC has been identified as the most lucrative market during the forecast period. As per the analysis, China is projected to garner US$ 725 Mn while recording a CAGR of 16.8% during the forecast period. Japan is estimated at US$ 584 Mn, expanding at a CAGR of 15.7% until 2032. South Korea has been anticipated at US$ 364 Mn, exhibiting a 15% CAGR.
APAC is anticipated to gain considerable market share owing to the rapid industrialization and the growing awareness regarding computerized operations of field sales teams. Besides, the deployment of cloud technology, the presence of a large number of startups in India, China, Japan, among others are projected to augment the regional expansion.
Country |
Estimated CAGR |
U.S |
17.3% |
U.K |
16.5% |
China |
16.8% |
Japan |
15.7% |
South Korea |
15% |
What Is The Competition Status In Global Field Force Automation Market?
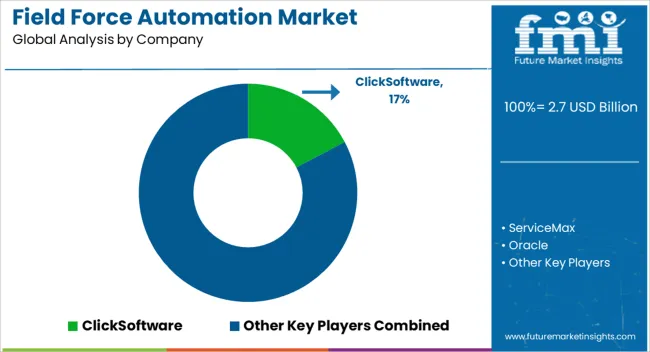
Major players of the global field force automation include ClickSoftware, ServiceMax, Oracle, Microsoft, Salesforce, among others.
Recent key developments among players are:
- In May 2019, Microsoft updated the capabilities of Dynamics 365 for Field Service. The update would allow the end customers to use IoT capabilities, and enhance field productivity.
- In April 2019, Trimble rolled out the Trimble PULSE Remote Expert. It is an Augmented Reality (AR) tool that enhanced the productivity of field service workers by connecting them with experts via audio, video, and spatial annotations in real-time.
Key Segments Covered In The Field Force Automation Industry Survey
By Components:
- Field Force Automation Solutions
- Field Force Automation Services
By Deployment:
- On-premise Field Force Automation
- Cloud Field Force Automation
By Organization Size:
- Field Force Automation for SMEs
- Field Force Automation for Large Enterprises
By Vertical:
- Field Force Automation for IT and Telecom
- Field Force Automation for Healthcare and Life Sciences
- Field Force Automation for Manufacturing
- Field Force Automation for Transportation and Logistics
- Field Force Automation for Construction and Real Estate
- Field Force Automation for Energy and Utilities
- Field Force Automation for Other Verticals
By Region:
- North America Field Force Automation Market
- Europe Field Force Automation Market
- Asia Pacific Field Force Automation Market
- Middle East and Africa Field Force Automation Market
- Latin America Field Force Automation Market
Frequently Asked Questions
The global field force automation market is estimated at USD 10.1 Bn while expanding at a CAGR of 17.6% during the forecast period.
The US is anticipated to lead the market with USD 3.5 Bn while recording a CAGR of 17.3% during the forecast period.
The cloud segment is expected to expand at a CAGR of 16.8% from 2022 to 2032.
The solution segment is predicted to expand at a CAGR of 16.6% during the forecast period.
Key players in the market include ClickSoftware, ServiceMax, Oracle, Microsoft, Salesforce, among others.
1. Executive Summary
1.1. Global Market Outlook
1.2. Summary of Statistics
1.3. Key Market Characteristics & Attributes
1.4. Fact.MR Analysis and Recommendations
2. Market Overview
2.1. Market Coverage
2.2. Market Definition
3. Market Risks and Trends Assessment
3.1. Risk Assessment
3.1.1. COVID-19 Crisis and Impact on Field Force Automation
3.1.2. COVID-19 Impact Benchmark with Previous Crisis
3.1.3. Impact on Market Value (US$ Mn)
3.1.4. Assessment by Key Countries
3.1.5. Assessment by Key Market Segments
3.1.6. Action Points and Recommendation for Suppliers
3.2. Key Trends Impacting the Market
3.3. Formulation and Product Development Trends
4. Market Background
4.1. Field Force Automation Market, by Key Countries
4.2. Field Force Automation Market Opportunity Assessment (US$ Mn)
4.2.1. Total Available Market
4.2.2. Serviceable Addressable Market
4.2.3. Serviceable Obtainable Market
4.3. Market Scenario Forecast
4.3.1. Demand in optimistic Scenario
4.3.2. Demand in Likely Scenario
4.3.3. Demand in Conservative Scenario
4.4. Investment Feasibility Analysis
4.4.1. Investment in Established Markets
4.4.1.1. In Short Term
4.4.1.2. In Long Term
4.4.2. Investment in Emerging Markets
4.4.2.1. In Short Term
4.4.2.2. In Long Term
4.5. Forecast Factors - Relevance & Impact
4.5.1. Top Companies Historical Growth
4.5.2. Growth in Automation, By Country
4.5.3. Field Force Automation Adoption Rate, By Country
4.6. Market Dynamics
4.6.1. Market Driving Factors and Impact Assessment
4.6.2. Prominent Market Challenges and Impact Assessment
4.6.3. Field Force Automation Market Opportunities
4.6.4. Prominent Trends in the Global Market & Their Impact Assessment
5. Key Success Factors
5.1. Manufacturers’ Focus on Low Penetration High Growth Markets
5.2. Banking on with Segments High Incremental Opportunity
5.3. Peer Benchmarking
6. Global Field Force Automation Market Demand Analysis 2015-2021 and Forecast, 2022-2032
6.1. Historical Market Analysis, 2015-2021
6.2. Current and Future Market Projections, 2022-2032
6.3. Y-o-Y Growth Trend Analysis
7. Global Field Force Automation Market Value Analysis 2015-2021 and Forecast, 2022-2032
7.1. Historical Market Value (US$ Mn) Analysis, 2015-2021
7.2. Current and Future Market Value (US$ Mn) Projections, 2022-2032
7.2.1. Y-o-Y Growth Trend Analysis
7.2.2. Absolute $ Opportunity Analysis
8. Global Field Force Automation Market Analysis 2015-2021 and Forecast 2022-2032, By Organization Size
8.1. Introduction / Key Findings
8.2. Historical Market Size (US$ Mn) Analysis By Organization Size, 2015-2021
8.3. Current and Future Market Size (US$ Mn) Analysis and Forecast By Organization Size, 2022-2032
8.3.1. SMEs
8.3.2. Large Enterprises
8.4. Market Attractiveness Analysis By Organization Size
9. Global Field Force Automation Market Analysis 2015-2021 and Forecast 2022-2032, By Vertical
9.1. Introduction / Key Findings
9.2. Historical Market Size (US$ Mn) Analysis By Vertical, 2015-2021
9.3. Current and Future Market Size (US$ Mn) Analysis and Forecast By Vertical, 2022-2032
9.3.1. IT and Telecom
9.3.2. Healthcare and Life Sciences
9.3.3. Manufacturing
9.3.4. Transportation and Logistics
9.3.5. Construction and Real Estate
9.3.6. Energy and Utilities
9.3.7. Others
9.4. Market Attractiveness Analysis By Vertical
10. Global Field Force Automation Market Analysis 2015-2021 and Forecast 2022-2032, By Deployment Mode
10.1. Introduction / Key Findings
10.2. Historical Market Size (US$ Mn) Analysis By Deployment Mode, 2015-2021
10.3. Current and Future Market Size (US$ Mn) Analysis and Forecast By Deployment Mode, 2022-2032
10.3.1. On-premises
10.3.2. Cloud
10.4. Market Attractiveness Analysis By Deployment Mode
11. Global Field Force Automation Market Analysis 2015-2021 and Forecast 2022-2032, By Component
11.1. Introduction / Key Findings
11.2. Historical Market Size (US$ Mn) Analysis By Component, 2015-2021
11.3. Current and Future Market Size (US$ Mn) Analysis and Forecast By Component, 2022-2032
11.3.1. Solution
11.3.2. Services
11.4. Market Attractiveness Analysis By Component
12. Global Field Force Automation Market Analysis 2015-2021 and Forecast 2022-2032, By Region
12.1. Introduction
12.2. Historical Market Size (US$ Mn) Analysis By Region, 2015-2021
12.3. Current Market Size (US$ Mn) & Analysis and Forecast By Region, 2022-2032
12.3.1. North America
12.3.2. Latin America
12.3.3. Europe
12.3.4. Asia Pacific
12.3.5. Middle East and Africa (MEA)
12.4. Market Attractiveness Analysis By Region
13. North America Field Force Automation Market Analysis 2015-2021 and Forecast 2022-2032
13.1. Introduction
13.2. Pricing Analysis
13.3. Historical Market Value (US$ Mn) Trend Analysis By Market Taxonomy, 2015-2021
13.4. Market Value (US$ Mn) & Forecast By Market Taxonomy, 2022-2032
13.4.1. By Country
13.4.1.1. U.S.
13.4.1.2. Canada
13.4.1.3. Rest of North America
13.4.2. By Organization Size
13.4.3. By Vertical
13.4.4. By Component
13.4.5. By Deployment Mode
13.5. Market Attractiveness Analysis
13.5.1. By Country
13.5.2. By Organization Size
13.5.3. By Vertical
13.5.4. By Component
13.5.5. By Deployment Mode
14. Latin America Field Force Automation Market Analysis 2015-2021 and Forecast 2022-2032
14.1. Introduction
14.2. Pricing Analysis
14.3. Historical Market Value (US$ Mn) Trend Analysis By Market Taxonomy, 2015-2021
14.4. Market Value (US$ Mn) & Forecast By Market Taxonomy, 2022-2032
14.4.1. By Country
14.4.1.1. Brazil
14.4.1.2. Mexico
14.4.1.3. Rest of Latin America
14.4.2. By Organization Size
14.4.3. By Vertical
14.4.4. By Component
14.4.5. By Deployment Mode
14.5. Market Attractiveness Analysis
14.5.1. By Country
14.5.2. By Organization Size
14.5.3. By Vertical
14.5.4. By Component
14.5.5. By Deployment Mode
15. Europe Field Force Automation Market Analysis 2015-2021 and Forecast 2022-2032
15.1. Introduction
15.2. Pricing Analysis
15.3. Historical Market Value (US$ Mn) Trend Analysis By Market Taxonomy, 2015-2021
15.4. Market Value (US$ Mn) & Forecast By Market Taxonomy, 2022-2032
15.4.1. By Country
15.4.1.1. Germany
15.4.1.2. France
15.4.1.3. U.K.
15.4.1.4. Italy
15.4.1.5. Benelux
15.4.1.6. Nordic Countries
15.4.1.7. Rest of Europe
15.4.2. By Organization Size
15.4.3. By Vertical
15.4.4. By Component
15.4.5. By Deployment Mode
15.5. Market Attractiveness Analysis
15.5.1. By Country
15.5.2. By Organization Size
15.5.3. By Vertical
15.5.4. By Component
15.5.5. By Deployment Mode
16. Asia Pacific Field Force Automation Market Analysis 2015-2021 and Forecast 2022-2032
16.1. Introduction
16.2. Pricing Analysis
16.3. Historical Market Value (US$ Mn) Trend Analysis By Market Taxonomy, 2015-2021
16.4. Market Value (US$ Mn) & Forecast By Market Taxonomy, 2022-2032
16.4.1. By Country
16.4.1.1. China
16.4.1.2. Japan
16.4.1.3. South Korea
16.4.1.4. Rest of Asia Pacific
16.4.2. By Organization Size
16.4.3. By Vertical
16.4.4. By Component
16.4.5. By Deployment Mode
16.5. Market Attractiveness Analysis
16.5.1. By Country
16.5.2. By Organization Size
16.5.3. By Vertical
16.5.4. By Component
16.5.5. By Deployment Mode
17. Middle East and Africa Field Force Automation Market Analysis 2015-2021 and Forecast 2022-2032
17.1. Introduction
17.2. Pricing Analysis
17.3. Historical Market Value (US$ Mn) Trend Analysis By Market Taxonomy, 2015-2021
17.4. Market Value (US$ Mn) & Forecast By Market Taxonomy, 2022-2032
17.4.1. By Country
17.4.1.1. GCC Countries
17.4.1.2. South Africa
17.4.1.3. Turkey
17.4.1.4. Rest of Middle East and Africa
17.4.2. By Organization Size
17.4.3. By Vertical
17.4.4. By Component
17.4.5. By Deployment Mode
17.5. Market Attractiveness Analysis
17.5.1. By Country
17.5.2. By Organization Size
17.5.3. By Vertical
17.5.4. By Component
17.5.5. By Deployment Mode
18. Key Countries Field Force Automation Market Analysis 2015-2021 and Forecast 2022-2032
18.1. Introduction
18.1.1. Market Value Proportion Analysis, By Key Countries
18.1.2. Global Vs. Country Growth Comparison
18.2. US Field Force Automation Market Analysis
18.2.1. Value Proportion Analysis by Market Taxonomy
18.2.2. Value Analysis and Forecast by Market Taxonomy, 2015-2032
18.2.2.1. By Organization Size
18.2.2.2. By Vertical
18.2.2.3. By Component
18.2.2.4. By Deployment Mode
18.3. Canada Field Force Automation Market Analysis
18.3.1. Value Proportion Analysis by Market Taxonomy
18.3.2. Value Analysis and Forecast by Market Taxonomy, 2015-2032
18.3.2.1. By Organization Size
18.3.2.2. By Vertical
18.3.2.3. By Component
18.3.2.4. By Deployment Mode
18.4. Mexico Field Force Automation Market Analysis
18.4.1. Value Proportion Analysis by Market Taxonomy
18.4.2. Value Analysis and Forecast by Market Taxonomy, 2015-2032
18.4.2.1. By Organization Size
18.4.2.2. By Vertical
18.4.2.3. By Component
18.4.2.4. By Deployment Mode
18.5. Brazil Field Force Automation Market Analysis
18.5.1. Value Proportion Analysis by Market Taxonomy
18.5.2. Value Analysis and Forecast by Market Taxonomy, 2015-2032
18.5.2.1. By Organization Size
18.5.2.2. By Vertical
18.5.2.3. By Component
18.5.2.4. By Deployment Mode
18.6. Germany Field Force Automation Market Analysis
18.6.1. Value Proportion Analysis by Market Taxonomy
18.6.2. Value Analysis and Forecast by Market Taxonomy, 2015-2032
18.6.2.1. By Organization Size
18.6.2.2. By Vertical
18.6.2.3. By Component
18.6.2.4. By Deployment Mode
18.7. France Field Force Automation Market Analysis
18.7.1. Value Proportion Analysis by Market Taxonomy
18.7.2. Value Analysis and Forecast by Market Taxonomy, 2015-2032
18.7.2.1. By Organization Size
18.7.2.2. By Vertical
18.7.2.3. By Component
18.7.2.4. By Deployment Mode
18.8. Italy Field Force Automation Market Analysis
18.8.1. Value Proportion Analysis by Market Taxonomy
18.8.2. Value Analysis and Forecast by Market Taxonomy, 2015-2032
18.8.2.1. By Organization Size
18.8.2.2. By Vertical
18.8.2.3. By Component
18.8.2.4. By Deployment Mode
18.9. BENELUX Field Force Automation Market Analysis
18.9.1. Value Proportion Analysis by Market Taxonomy
18.9.2. Value Analysis and Forecast by Market Taxonomy, 2015-2032
18.9.2.1. By Organization Size
18.9.2.2. By Vertical
18.9.2.3. By Component
18.9.2.4. By Deployment Mode
18.10. UK Field Force Automation Market Analysis
18.10.1. Value Proportion Analysis by Market Taxonomy
18.10.2. Value Analysis and Forecast by Market Taxonomy, 2015-2032
18.10.2.1. By Organization Size
18.10.2.2. By Vertical
18.10.2.3. By Component
18.10.2.4. By Deployment Mode
18.11. Nordic Countries Field Force Automation Market Analysis
18.11.1. Value Proportion Analysis by Market Taxonomy
18.11.2. Value Analysis and Forecast by Market Taxonomy, 2015-2032
18.11.2.1. By Organization Size
18.11.2.2. By Vertical
18.11.2.3. By Component
18.11.2.4. By Deployment Mode
18.12. China Field Force Automation Market Analysis
18.12.1. Value Proportion Analysis by Market Taxonomy
18.12.2. Value Analysis and Forecast by Market Taxonomy, 2015-2032
18.12.2.1. By Organization Size
18.12.2.2. By Vertical
18.12.2.3. By Component
18.12.2.4. By Deployment Mode
18.13. Japan Field Force Automation Market Analysis
18.13.1. Value Proportion Analysis by Market Taxonomy
18.13.2. Value Analysis and Forecast by Market Taxonomy, 2015-2032
18.13.2.1. By Organization Size
18.13.2.2. By Vertical
18.13.2.3. By Component
18.13.2.4. By Deployment Mode
18.14. South Korea Field Force Automation Market Analysis
18.14.1. Value Proportion Analysis by Market Taxonomy
18.14.2. Value Analysis and Forecast by Market Taxonomy, 2015-2032
18.14.2.1. By Organization Size
18.14.2.2. By Vertical
18.14.2.3. By Component
18.14.2.4. By Deployment Mode
18.15. GCC Countries Field Force Automation Market Analysis
18.15.1. Value Proportion Analysis by Market Taxonomy
18.15.2. Value Analysis and Forecast by Market Taxonomy, 2015-2032
18.15.2.1. By Organization Size
18.15.2.2. By Vertical
18.15.2.3. By Component
18.15.2.4. By Deployment Mode
18.16. South Africa Field Force Automation Market Analysis
18.16.1. Value Proportion Analysis by Market Taxonomy
18.16.2. Value Analysis and Forecast by Market Taxonomy, 2015-2032
18.16.2.1. By Organization Size
18.16.2.2. By Vertical
18.16.2.3. By Component
18.16.2.4. By Deployment Mode
18.17. Turkey Field Force Automation Market Analysis
18.17.1. Value Proportion Analysis by Market Taxonomy
18.17.2. Value Analysis and Forecast by Market Taxonomy, 2015-2032
18.17.2.1. By Organization Size
18.17.2.2. By Vertical
18.17.2.3. By Component
18.17.2.4. By Deployment Mode
18.17.3. Competition Landscape and Player Concentration in the Country
19. Market Structure Analysis
19.1. Market Analysis by Tier of Companies
19.2. Market Concentration
19.3. Market Share Analysis of Top Players
19.4. Market Presence Analysis
19.4.1. By Regional footprint of Players
19.4.2. Product footprint by Players
20. Competition Analysis
20.1. Competition Dashboard
20.2. Competition Benchmarking
20.3. Competition Deep Dive
20.3.1. ServiceMax
20.3.1.1. Overview
20.3.1.2. Product Portfolio
20.3.1.3. Sales Footprint
20.3.1.4. Strategy Overview
20.3.2. Clicksoftware
20.3.2.1. Overview
20.3.2.2. Product Portfolio
20.3.2.3. Sales Footprint
20.3.2.4. Strategy Overview
20.3.3. Oracle
20.3.3.1. Overview
20.3.3.2. Product Portfolio
20.3.3.3. Sales Footprint
20.3.3.4. Strategy Overview
20.3.4. Microsoft
20.3.4.1. Overview
20.3.4.2. Product Portfolio
20.3.4.3. Sales Footprint
20.3.4.4. Strategy Overview
20.3.5. Salesforce
20.3.5.1. Overview
20.3.5.2. Product Portfolio
20.3.5.3. Sales Footprint
20.3.5.4. Strategy Overview
20.3.6. Trimble
20.3.6.1. Overview
20.3.6.2. Product Portfolio
20.3.6.3. Sales Footprint
20.3.6.4. Strategy Overview
20.3.7. SAP
20.3.7.1. Overview
20.3.7.2. Product Portfolio
20.3.7.3. Sales Footprint
20.3.7.4. Strategy Overview
20.3.8. Astea
20.3.8.1. Overview
20.3.8.2. Product Portfolio
20.3.8.3. Sales Footprint
20.3.8.4. Strategy Overview
20.3.9. Accruent
20.3.9.1. Overview
20.3.9.2. Product Portfolio
20.3.9.3. Sales Footprint
20.3.9.4. Strategy Overview
20.3.10. Acumatica
20.3.10.1. Overview
20.3.10.2. Product Portfolio
20.3.10.3. Sales Footprint
20.3.10.4. Strategy Overview
21. Assumptions and Acronyms Used
22. Research Methodology
Let us know your requirement to get
100% FREE customization
Table 1: Global Field Force Automation Market Value (US$ Mn),By Organization Size, 2015 – 2021
Table 2: Global Field Force Automation Market Value (US$ Mn),By Organization Size, 2022 – 2032
Table 3: Global Field Force Automation Market Value (US$ Mn), By Vertical, 2015 – 2021
Table 4: Global Field Force Automation Market Value (US$ Mn), By Vertical, 2022 – 2032
Table 5: Global Field Force Automation Market Value (US$ Mn), By Deployment Mode, 2015 – 2021
Table 6: Global Field Force Automation Market Value (US$ Mn), By Deployment Mode, 2022 – 2032
Table 7: Global Field Force Automation Market Value (US$ Mn), By Component, 2015 – 2021
Table 8: Global Field Force Automation Market Value (US$ Mn), By Component, 2022 – 2032
Table 9: Global Field Force Automation Market, By Region, 2015 – 2021
Table 10: Global Field Force Automation Market, By Region, 2022 – 2032
Table 11: North America Field Force Automation Market Value (US$ Mn),By Organization Size, 2015 – 2021
Table 12: North America Field Force Automation Market Value (US$ Mn),By Organization Size, 2022 – 2032
Table 13: North America Field Force Automation Market Value (US$ Mn), By Vertical, 2015 – 2021
Table 14: North America Field Force Automation Market Value (US$ Mn), By Vertical, 2022 – 2032
Table 15: North America Field Force Automation Market Value (US$ Mn), By Deployment Mode, 2015 – 2021
Table 16: North America Field Force Automation Market Value (US$ Mn), By Deployment Mode, 2022 – 2032
Table 17: North America Field Force Automation Market Value (US$ Mn), By Component, 2015 – 2021
Table 18: North America Field Force Automation Market Value (US$ Mn), By Component, 2022 – 2032
Table 19: North America Field Force Automation Market, By Country, 2015 – 2021
Table 20: North America Field Force Automation Market, By Country, 2022 – 2032
Table 21: Latin America Field Force Automation Market Value (US$ Mn),By Organization Size, 2015 – 2021
Table 22: Latin America Field Force Automation Market Value (US$ Mn),By Organization Size, 2022 – 2032
Table 23: Latin America Field Force Automation Market Value (US$ Mn), By Vertical, 2015 – 2021
Table 24: Latin America Field Force Automation Market Value (US$ Mn), By Vertical, 2022 – 2032
Table 25: Latin America Field Force Automation Market Value (US$ Mn), By Deployment Mode, 2015 – 2021
Table 26: Latin America Field Force Automation Market Value (US$ Mn), By Deployment Mode, 2022 – 2032
Table 27: Latin America Field Force Automation Market Value (US$ Mn), By Component, 2015 – 2021
Table 28: Latin America Field Force Automation Market Value (US$ Mn), By Component, 2022 – 2032
Table 29: Latin America Field Force Automation Market, By Country, 2015 – 2021
Table 30: Latin America Field Force Automation Market, By Country, 2022 – 2032
Table 31: Europe Field Force Automation Market Value (US$ Mn),By Organization Size, 2015 – 2021
Table 32: Europe Field Force Automation Market Value (US$ Mn),By Organization Size, 2022 – 2032
Table 33: Europe Field Force Automation Market Value (US$ Mn), By Vertical, 2015 – 2021
Table 34: Europe Field Force Automation Market Value (US$ Mn), By Vertical, 2022 – 2032
Table 35: Europe Field Force Automation Market Value (US$ Mn), By Deployment Mode, 2015 – 2021
Table 36: Europe Field Force Automation Market Value (US$ Mn), By Deployment Mode, 2022 – 2032
Table 37: Europe Field Force Automation Market Value (US$ Mn), By Component, 2015 – 2021
Table 38: Europe Field Force Automation Market Value (US$ Mn), By Component, 2022 – 2032
Table 39: Europe Field Force Automation Market, By Country, 2015 – 2021
Table 40: Europe Field Force Automation Market, By Country, 2022 – 2032
Table 41: Asia Pacific Field Force Automation Market Value (US$ Mn),By Organization Size, 2015 – 2021
Table 42: Asia Pacific Field Force Automation Market Value (US$ Mn),By Organization Size, 2022 – 2032
Table 43: Asia Pacific Field Force Automation Market Value (US$ Mn), By Vertical, 2015 – 2021
Table 44: Asia Pacific Field Force Automation Market Value (US$ Mn), By Vertical, 2022 – 2032
Table 45: Asia Pacific Field Force Automation Market Value (US$ Mn), By Deployment Mode, 2015 – 2021
Table 46: Asia Pacific Field Force Automation Market Value (US$ Mn), By Deployment Mode, 2022 – 2032
Table 47: Asia Pacific Field Force Automation Market Value (US$ Mn), By Component, 2015 – 2021
Table 48: Asia Pacific Field Force Automation Market Value (US$ Mn), By Component, 2022 – 2032
Table 49: Asia Pacific Field Force Automation Market, By Country, 2015 – 2021
Table 50: Asia Pacific Field Force Automation Market, By Country, 2022 – 2032
Table 51: MEA Field Force Automation Market Value (US$ Mn),By Organization Size, 2015 – 2021
Table 52: MEA Field Force Automation Market Value (US$ Mn),By Organization Size, 2022 – 2032
Table 53: MEA Field Force Automation Market Value (US$ Mn), By Vertical, 2015 – 2021
Table 54: MEA Field Force Automation Market Value (US$ Mn), By Vertical, 2022 – 2032
Table 55: MEA Field Force Automation Market Value (US$ Mn), By Deployment Mode, 2015 – 2021
Table 56: MEA Field Force Automation Market Value (US$ Mn), By Deployment Mode, 2022 – 2032
Table 57: MEA Field Force Automation Market Value (US$ Mn), By Component, 2015 – 2021
Table 58: MEA Field Force Automation Market Value (US$ Mn), By Component, 2022 – 2032
Table 59: MEA Field Force Automation Market, By Country, 2015 – 2021
Table 60: MEA Field Force Automation Market, By Country, 2022 – 2032
Find your sweet spots for generating winning opportunities in this market.
Talk to AnalystFigure 1: Global Field Force Automation Market Value (US$ Mn) and Year-on-Year Growth, 2015-2032
Figure 2: Global Field Force Automation Market Absolute $ Historical Gain (2015 - 2021) and Opportunity (2022 – 2032), US$ Mn
Figure 3: Global Field Force Automation Market Share, By Organization Size, 2022 & 2032
Figure 4: Global Field Force Automation Market Y-o-Y Growth Projections, Organization Size – 2022-2032
Figure 5: Global Field Force Automation Market Attractiveness Index, Organization Size – 2022-2032
Figure 6: Global Field Force Automation Market Share, By Vertical, 2022 & 2032
Figure 7: Global Field Force Automation Market Y-o-Y Growth Projections, By Vertical – 2022-2032
Figure 8: Global Field Force Automation Market Attractiveness Index, By Vertical – 2022-2032
Figure 9: Global Field Force Automation Market Share, By Component, 2022 & 2032
Figure 10: Global Field Force Automation Market Y-o-Y Growth Projections, By Component – 2022-2032
Figure 11: Global Field Force Automation Market Attractiveness Index, By Component – 2022-2032
Figure 12: Global Field Force Automation Market Share, By Deployment Mode, 2022 & 2032
Figure 13: Global Field Force Automation Market Y-o-Y Growth Projections, By Deployment Mode – 2022-2032
Figure 14: Global Field Force Automation Market Attractiveness Index, By Deployment Mode – 2022-2032
Figure 15: Global Field Force Automation Market Share, By Region, 2022 & 2032
Figure 16: Global Field Force Automation Market Y-o-Y Growth Projections, By Region – 2022-2032
Figure 17: Global Field Force Automation Market Attractiveness Index, By Region – 2022-2032
Figure 18: North America Field Force Automation Market Value (US$ Mn) and Year-on-Year Growth, 2015-2032
Figure 19: North America Field Force Automation Market Absolute $ Opportunity Historical (2015 - 2021) and Forecast Period (2022 – 2032), US$ Mn
Figure 20: North America Field Force Automation Market Share, Organization Size, 2022 & 2032
Figure 21: North America Field Force Automation Market Y-o-Y Growth Projections, Organization Size – 2022-2032
Figure 22: North America Field Force Automation Market Attractiveness Index, Organization Size – 2022-2032
Figure 23: North America Field Force Automation Market Share, By Vertical, 2022 & 2032
Figure 24: North America Field Force Automation Market Y-o-Y Growth Projections, By Vertical – 2022-2032
Figure 25: North America Field Force Automation Market Attractiveness Index, By Vertical – 2022-2032
Figure 26: North America Field Force Automation Market Share, By Component, 2022 & 2032
Figure 27: North America Field Force Automation Market Y-o-Y Growth Projections, By Component – 2022-2032
Figure 28: North America Field Force Automation Market Attractiveness Index, By Component – 2022-2032
Figure 29: North America Field Force Automation Market Share, By Deployment Mode, 2022 & 2032
Figure 30: North America Field Force Automation Market Y-o-Y Growth Projections, By Deployment Mode – 2022-2032
Figure 31: North America Field Force Automation Market Attractiveness Index, By Deployment Mode – 2022-2032
Figure 32: North America Field Force Automation Market Share, By Country, 2022 & 2032
Figure 33: North America Market Y-o-Y Growth Projections, By Country – 2022-2032
Figure 34: North America Market Attractiveness Index, By Country – 2022-2032
Figure 35: Latin America Field Force Automation Market Value (US$ Mn) and Year-on-Year Growth, 2015-2032
Figure 36: Latin America Field Force Automation Market Absolute $ Opportunity Historical (2015 - 2021) and Forecast Period (2022 – 2032), US$ Mn
Figure 37: Latin America Field Force Automation Market Share, Organization Size, 2022 & 2032
Figure 38: Latin America Field Force Automation Market Y-o-Y Growth Projections, Organization Size – 2022-2032
Figure 39: Latin America Field Force Automation Market Attractiveness Index, Organization Size – 2022-2032
Figure 40: Latin America Field Force Automation Market Share, By Vertical, 2022 & 2032
Figure 41: Latin America Field Force Automation Market Y-o-Y Growth Projections, By Vertical – 2022-2032
Figure 42: Latin America Field Force Automation Market Attractiveness Index, By Vertical – 2022-2032
Figure 43: Latin America Field Force Automation Market Share, By Component, 2022 & 2032
Figure 44: Latin America Field Force Automation Market Y-o-Y Growth Projections, By Component – 2022-2032
Figure 45: Latin America Field Force Automation Market Attractiveness Index, By Component – 2022-2032
Figure 46: Latin America Field Force Automation Market Share, By Deployment Mode, 2022 & 2032
Figure 47: Latin America Field Force Automation Market Y-o-Y Growth Projections, By Deployment Mode – 2022-2032
Figure 48: Latin America Field Force Automation Market Attractiveness Index, By Deployment Mode – 2022-2032
Figure 49: Latin America Field Force Automation Market Share, By Country, 2022 & 2032
Figure 50: Latin America Field Force Automation Market Y-o-Y Growth Projections, By Country – 2022-2032
Figure 51: Latin America Field Force Automation Market Attractiveness Index, By Country – 2022-2032
Figure 52: Europe Field Force Automation Market Value (US$ Mn) and Year-on-Year Growth, 2015-2032
Figure 53: Europe Field Force Automation Market Absolute $ Opportunity Historical (2015 - 2021) and Forecast Period (2022 – 2032), US$ Mn
Figure 54: Europe Field Force Automation Market Share, Organization Size, 2022 & 2032
Figure 55: Europe Field Force Automation Market Y-o-Y Growth Projections, Organization Size – 2022-2032
Figure 56: Europe Field Force Automation Market Attractiveness Index, Organization Size – 2022-2032
Figure 57: Europe Field Force Automation Market Share, By Vertical, 2022 & 2032
Figure 58: Europe Field Force Automation Market Y-o-Y Growth Projections, By Vertical – 2022-2032
Figure 59: Europe Field Force Automation Market Attractiveness Index, By Vertical – 2022-2032
Figure 60: Europe Field Force Automation Market Share, By Component, 2022 & 2032
Figure 61: Europe Field Force Automation Market Y-o-Y Growth Projections, By Component – 2022-2032
Figure 62: Europe Field Force Automation Market Attractiveness Index, By Component – 2022-2032
Figure 63: Europe Field Force Automation Market Share, By Deployment Mode, 2022 & 2032
Figure 64: Europe Field Force Automation Market Y-o-Y Growth Projections, By Deployment Mode – 2022-2032
Figure 65: Europe Field Force Automation Market Attractiveness Index, By Deployment Mode – 2022-2032
Figure 66: Europe Field Force Automation Market Share, By Country, 2022 & 2032
Figure 67: Europe Field Force Automation Market Y-o-Y Growth Projections, By Country – 2022-2032
Figure 68: Europe Field Force Automation Market Attractiveness Index, By Country – 2022-2032
Figure 69: MEA Field Force Automation Market Value (US$ Mn) and Year-on-Year Growth, 2015-2032
Figure 70: MEA Field Force Automation Market Absolute $ Opportunity Historical (2015 - 2021) and Forecast Period (2022 – 2032), US$ Mn
Figure 71: MEA Field Force Automation Market Share, Organization Size, 2022 & 2032
Figure 72: MEA Field Force Automation Market Y-o-Y Growth Projections, Organization Size – 2022-2032
Figure 73: MEA Field Force Automation Market Attractiveness Index, Organization Size – 2022-2032
Figure 74: MEA Field Force Automation Market Share, By Vertical, 2022 & 2032
Figure 75: MEA Field Force Automation Market Y-o-Y Growth Projections, By Vertical – 2022-2032
Figure 76: MEA Field Force Automation Market Attractiveness Index, By Vertical – 2022-2032
Figure 77: MEA Field Force Automation Market Share, By Component, 2022 & 2032
Figure 78: MEA Field Force Automation Market Y-o-Y Growth Projections, By Component – 2022-2032
Figure 79: MEA Field Force Automation Market Attractiveness Index, By Component – 2022-2032
Figure 80: MEA Field Force Automation Market Share, By Deployment Mode, 2022 & 2032
Figure 81: MEA Field Force Automation Market Y-o-Y Growth Projections, By Deployment Mode – 2022-2032
Figure 82: MEA Field Force Automation Market Attractiveness Index, By Deployment Mode – 2022-2032
Figure 83: MEA Field Force Automation Market Share, By Country, 2022 & 2032
Figure 84: MEA Field Force Automation Market Y-o-Y Growth Projections, By Country – 2022-2032
Figure 85: MEA Field Force Automation Market Attractiveness Index, By Country – 2022-2032
Figure 86: Asia Pacific Field Force Automation Market Value (US$ Mn) and Year-on-Year Growth, 2015-2032
Figure 87: Asia Pacific Field Force Automation Market Absolute $ Opportunity Historical (2015 - 2021) and Forecast Period (2022 – 2032), US$ Mn
Figure 88: Asia Pacific Field Force Automation Market Share, Organization Size, 2022 & 2032
Figure 89: Asia Pacific Field Force Automation Market Y-o-Y Growth Projections, Organization Size – 2022-2032
Figure 90: Asia Pacific Field Force Automation Market Attractiveness Index, Organization Size – 2022-2032
Figure 91: Asia Pacific Field Force Automation Market Share, By Vertical, 2022 & 2032
Figure 92: Asia Pacific Field Force Automation Market Y-o-Y Growth Projections, By Vertical – 2022-2032
Figure 93: Asia Pacific Field Force Automation Market Attractiveness Index, By Vertical – 2022-2032
Figure 94: Asia Pacific Field Force Automation Market Share, By Component, 2022 & 2032
Figure 95: Asia Pacific Field Force Automation Market Y-o-Y Growth Projections, By Component – 2022-2032
Figure 96: Asia Pacific Field Force Automation Market Attractiveness Index, By Component – 2022-2032
Figure 97: Asia Pacific Field Force Automation Market Share, By Deployment Mode, 2022 & 2032
Figure 98: Asia Pacific Field Force Automation Market Y-o-Y Growth Projections, By Deployment Mode – 2022-2032
Figure 99: Asia Pacific Field Force Automation Market Attractiveness Index, By Deployment Mode – 2022-2032
Figure 100: Asia Pacific Field Force Automation Market Share, By Country, 2022 & 2032
Figure 101: Asia Pacific Field Force Automation Market Y-o-Y Growth Projections, By Country – 2022-2032
Figure 102: Asia Pacific Field Force Automation Market Attractiveness Index, By Country – 2022-2032
Need specific information?
Request CustomizationExplore Technology Insights
View Reports