The Fin Field Effect Transistor (FinFET) Market is estimated to be valued at USD 22.7 billion in 2025 and is projected to reach USD 187.1 billion by 2035, registering a compound annual growth rate (CAGR) of 23.5% over the forecast period.
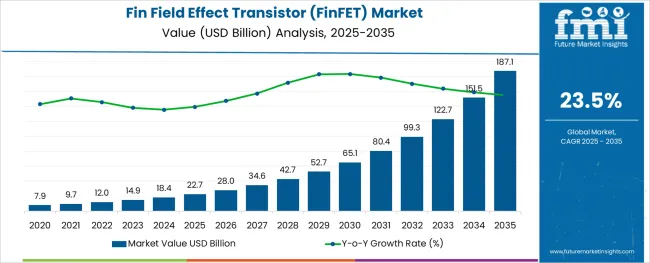
The Fin Field Effect Transistor (FinFET) market is experiencing accelerated growth due to escalating demand for advanced semiconductor performance and power efficiency in a range of electronic applications. FinFET technology, characterized by its three-dimensional gate structure, has become a cornerstone in achieving greater transistor density and reduced leakage in sub-10nm fabrication nodes.
Growing investment in 5G infrastructure, high-performance computing (HPC), and artificial intelligence (AI) accelerators is further strengthening the case for FinFET deployment. Semiconductor foundries and fabless companies are pushing FinFET adoption to meet the scaling challenges of Moore’s Law, while maintaining thermal integrity and switching speeds. As end-user industries require chips that can operate at lower voltages without compromising performance, FinFETs are being integrated into leading-edge designs.
The future trajectory is expected to be shaped by continued innovation in EUV lithography, fab capacity expansion, and increased demand for mobile and cloud-based processing power.
The market is segmented by Technology Node and Product Type and region. By Technology Node, the market is divided into 7nm, 22nm, 20nm, 16nm, 14nm, and 10nm. In terms of Product Type, the market is classified into Smartphones, Computer & Tablets, Wearables, Automotive, Industrial Products, and Other Products. Regionally, the market is classified into North America, Latin America, Western Europe, Eastern Europe, Balkan & Baltic Countries, Russia & Belarus, Central Asia, East Asia, South Asia & Pacific, and the Middle East & Africa.
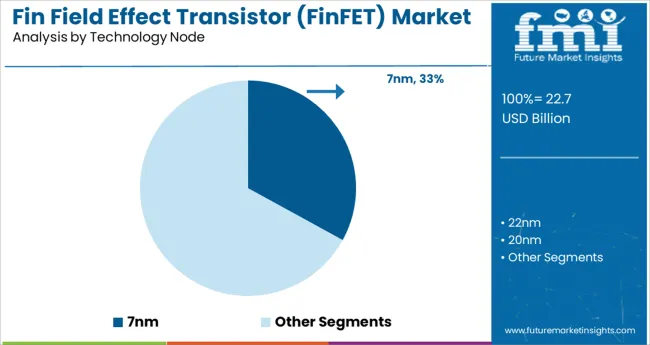
The 7nm technology node is projected to account for 33.0% of the total FinFET market revenue in 2025, positioning it as a leading segment. This node has gained prominence due to its balanced offering of transistor density, performance efficiency, and manufacturing maturity. Adoption has been driven by the ability to integrate a higher number of transistors in compact dies, which improves processing power while reducing energy consumption key attributes required in premium smartphones, data centers, and AI accelerators.
The 7nm node represents a stable and proven platform for volume production, with established IP libraries and design tools available to accelerate time to market. As compared to smaller nodes, it offers a more cost-effective manufacturing process with better yields, making it attractive for OEMs targeting high-performance, cost-sensitive devices.
The continued relevance of 7nm is being supported by demand in consumer electronics and next-generation computing platforms.
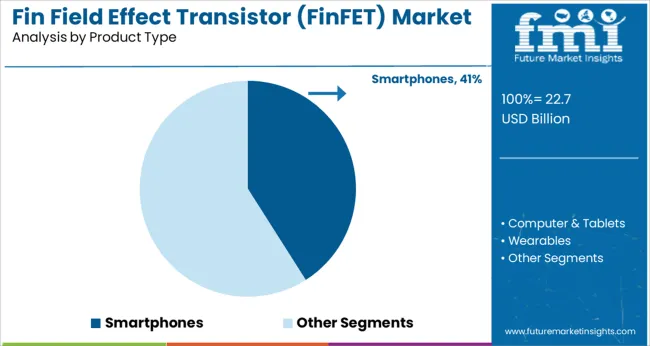
The smartphone segment is projected to contribute 41.0% of the total FinFET market revenue in 2025, making it the dominant product category. This leadership is being reinforced by the continuous demand for enhanced device performance, improved battery efficiency, and support for advanced mobile features such as 5G, AI processing, and high-resolution imaging.
FinFET-based SoCs are critical in enabling multi-core processors that offer high performance per watt, which is essential for today’s flagship smartphones. The miniaturized transistor structure enables low-power operation without sacrificing speed or reliability, supporting longer device lifespans and richer user experiences.
As global smartphone shipments recover with increasing average selling prices (ASPs), OEMs are focusing on FinFET-enabled chipsets to differentiate on performance and energy consumption. Moreover, the integration of machine learning and on-device AI functionalities has heightened the need for transistors capable of processing large datasets in real time-strengthening the dominance of FinFETs in this application area.
Fin Field Effect Transistors (FinFET) is the New Technology Boost in the Electronic Industry
In the last couple of years, the advancement in the internet of things (IoT) has fuelled the need for fin field effect transistors as it drives higher current to electronic applications.
Rising demand for fin field effect transistors (FinFET) due to rising power and space efficiency in various electronic systems in recent years. The fin field effect transistors market size is growing as it is increasing. Many IoT devices are rapidly gaining traction in both consumer and enterprise markets.
FinFET’s Complex Process Design May Limit Market Growth
Due to their large input capacitance, these transistors have a poor frequency response. FinFET has very low linearity and is typically less linear than bipolar junction transistors, which may restrain the fin field effect transistors (FinFET) market growth in the coming period.
It can be harmed by static electricity & the complicated process of developing a fin field that affects transistors and is constraining industry development considerably. In addition to this, the complex process of designing FinFET may limit the fin field effect transistors (FinFET) market trends to the emerging economies getting industrialized rapidly.
The Asia-Pacific region is likely to dominate the market by acquiring the highest CAGR during the forecast period.
The growth of the consumer electronics sector and rapid advancements in these devices, such as headsets, projectors, and smart connectivity, are propelling the market growth. Other devices such as smart wearable electronics devices and on-body smart garments are rising profitable growth in the Asia-Pacific region in recent years.
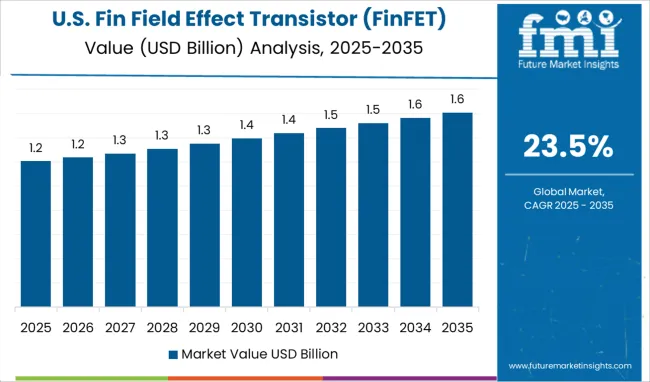
North America is estimated to lead the Market by securing 34.6% of the share during the forecast period.
Due to increased smartphone penetration and developing technologies such as artificial intelligence, IoT, and machine learning, which are boosting demand for FinFET Technology. The increasing variety of applications in the region leads to a rise in the adoption of fin field effect transistors (FinFET) market share. Smartphone manufacturers have used FinFET in CPUs and memory parts to serve various applications in recent years.
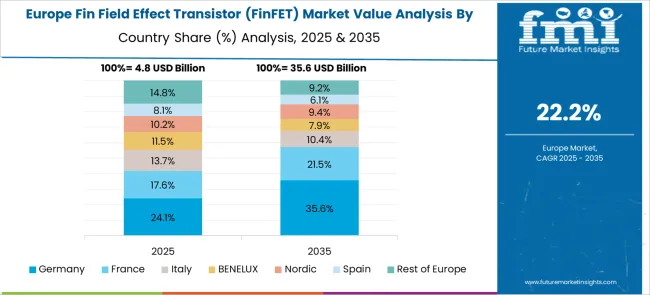
The Europe region is one of the fastest growing regions in the fin field effect transistors market by securing 21.5% of the share during the foreseen time. Rising demand for various electronic applications and smartphone in the region are likely to increase the adoption of fin field effect transistors (FinFET) in recent years.
The uses of FinFET are widely beneficial for system-on-chip (SoC) as it requires minimum space and better performance and is more reliable than any other chip system. These factors and better advanced technological features are rising the market growth in the region during the forecast period.
The 10 nm category is expected to lead the fin field effect transistors (FinFET) market in terms of revenue throughout the projected period. The 7 nm technique employs gate-all-around, a next-generation design in semiconductor manufacturing.
On the other hand, the 14 nm technique uses extreme infrared lithography in metallic coating modeling to reduce cover coatings and give increased reliability, and it is ideal for energy-efficient and high-performance systems on Soc.
While the 16nm manufacturing technology has the most minimal logic thickness and is expected to contribute to a large CAGR throughout the forecast timeframe, these two segments are expected to get rapidly popular in the coming days and further boost the fin field effect transistors (FinFET) market performance.
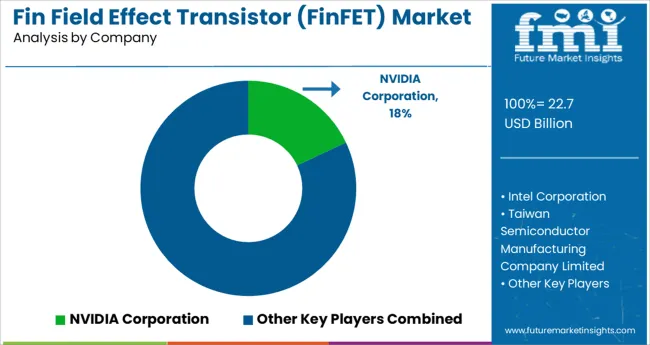
Essential Operators in Fin Field Effect Transistors (FinFET) Market
The fin field effect transistors (FinFET) market is fragmented by the presence of several essential players present in the Market in recent years among all the regions. These players are adopting several methodologies to acquire maximum revenue in the Market. Some of their common marketing strategies are acquisitions, partnerships, and product launches.
Fin-field effect transistors have been widely used in a variety of production and application procedures. In addition to this, the most experienced semiconductor manufacturers are focusing on providing better and more effective transistors in the coming forecast period, which could set an emerging trend in the fin field effect transistors (FinFET) market.
Qualcomm and TSMC, both major players in the semiconductor industry, have joined forces to produce semiconductors using Fin Field Effect manufacturing technology. Qualcomm is rumoured to be searching for a partnership with TSMC to produce 7nm processors.
Following are the prominent players that play a vital role in the growth of the Fin Field Effect Transistors Market
| Report Attribute | Details |
|---|---|
| Growth Rate | CAGR of 23.5% from 2025 to 2035 |
| Base Year for Estimation | 2024 |
| Historical Data | 2020 to 2024 |
| Forecast Period | 2025 to 2035 |
| Quantitative Units | Revenue in USD million and CAGR from 2025 to 2035 |
| Report Coverage | Revenue Forecast, Volume Forecast, Company Ranking, Competitive Landscape, Growth Factors, Trends, and Pricing Analysis |
| Segments Covered | Product, Technology, Region |
| Regions Covered | North America; Latin America; Europe; East Asia; South Asia; Oceania; Middle East and Africa |
| Key Countries Profiled | USA, Canada, Brazil, Argentina, Germany, UK, France, Spain, Italy, Nordics, BENELUX, Australia & New Zealand, China, India, ASIAN, GCC Countries, South Africa |
| Key Companies Profiled | NVIDIA Corporation; Intel Corporation; Taiwan Semiconductor Manufacturing Company Limited; Samsung; Globalfoundries; NXP Semiconductors; Texas Instruments Incorporated |
| Customization | Available Upon Request |
The global fin field effect transistor (finfet) market is estimated to be valued at USD 22.7 billion in 2025.
It is projected to reach USD 187.1 billion by 2035.
The market is expected to grow at a 23.5% CAGR between 2025 and 2035.
The key product types are 7nm, 22nm, 20nm, 16nm, 14nm and 10nm.
smartphones segment is expected to dominate with a 41.0% industry share in 2025.


Our Research Products

The "Full Research Suite" delivers actionable market intel, deep dives on markets or technologies, so clients act faster, cut risk, and unlock growth.

The Leaderboard benchmarks and ranks top vendors, classifying them as Established Leaders, Leading Challengers, or Disruptors & Challengers.

Locates where complements amplify value and substitutes erode it, forecasting net impact by horizon

We deliver granular, decision-grade intel: market sizing, 5-year forecasts, pricing, adoption, usage, revenue, and operational KPIs—plus competitor tracking, regulation, and value chains—across 60 countries broadly.

Spot the shifts before they hit your P&L. We track inflection points, adoption curves, pricing moves, and ecosystem plays to show where demand is heading, why it is changing, and what to do next across high-growth markets and disruptive tech

Real-time reads of user behavior. We track shifting priorities, perceptions of today’s and next-gen services, and provider experience, then pace how fast tech moves from trial to adoption, blending buyer, consumer, and channel inputs with social signals (#WhySwitch, #UX).

Partner with our analyst team to build a custom report designed around your business priorities. From analysing market trends to assessing competitors or crafting bespoke datasets, we tailor insights to your needs.
Supplier Intelligence
Discovery & Profiling
Capacity & Footprint
Performance & Risk
Compliance & Governance
Commercial Readiness
Who Supplies Whom
Scorecards & Shortlists
Playbooks & Docs
Category Intelligence
Definition & Scope
Demand & Use Cases
Cost Drivers
Market Structure
Supply Chain Map
Trade & Policy
Operating Norms
Deliverables
Buyer Intelligence
Account Basics
Spend & Scope
Procurement Model
Vendor Requirements
Terms & Policies
Entry Strategy
Pain Points & Triggers
Outputs
Pricing Analysis
Benchmarks
Trends
Should-Cost
Indexation
Landed Cost
Commercial Terms
Deliverables
Brand Analysis
Positioning & Value Prop
Share & Presence
Customer Evidence
Go-to-Market
Digital & Reputation
Compliance & Trust
KPIs & Gaps
Outputs
Full Research Suite comprises of:
Market outlook & trends analysis
Interviews & case studies
Strategic recommendations
Vendor profiles & capabilities analysis
5-year forecasts
8 regions and 60+ country-level data splits
Market segment data splits
12 months of continuous data updates
DELIVERED AS:
PDF EXCEL ONLINE
Finger Blood Calibration Free Glucose Meter Market Size and Share Forecast Outlook 2025 to 2035
Finishing Chemical for Coated Fabrics Market Forecast Outlook 2025 to 2035
Fine Bubble Diffuser Market Size and Share Forecast Outlook 2025 to 2035
Fine Chemicals Market Size and Share Forecast Outlook 2025 to 2035
Finance Cloud Market Size and Share Forecast Outlook 2025 to 2035
Fingerprint Sensors Market Size and Share Forecast Outlook 2025 to 2035
Finished Vehicles Logistics Market Size and Share Forecast Outlook 2025 to 2035
Fintech As A Service Market Size and Share Forecast Outlook 2025 to 2035
Fine Hydrates Market Analysis & Forecast 2025 to 2035
Financial Analytics Market Analysis by Type, Application, and Region through 2025 to 2035
Fingerprint Biometrics Market by Authentication Type, Mobility, Industry & Region Forecast till 2035
Fintech as a Service Market Analysis – Growth & Trends 2024-2034
Fintech-as-a-Service Platform Market
Fine Line Striping Tape Market
Financial Services Operational Risk Management Solution Market
Financial Fraud Detection Software Market
Refinery Process Chemical Market Size and Share Forecast Outlook 2025 to 2035
Refining Additives Market Size and Share Forecast Outlook 2025 to 2035
Refinery fuel additives Market Size and Share Forecast Outlook 2025 to 2035
Refined Functional Carbohydrates Market Size and Share Forecast Outlook 2025 to 2035

Thank you!
You will receive an email from our Business Development Manager. Please be sure to check your SPAM/JUNK folder too.
Chat With
MaRIA