The Finance Cloud Market is estimated to be valued at USD 52.5 billion in 2025 and is projected to reach USD 151.9 billion by 2035, registering a compound annual growth rate (CAGR) of 11.2% over the forecast period.
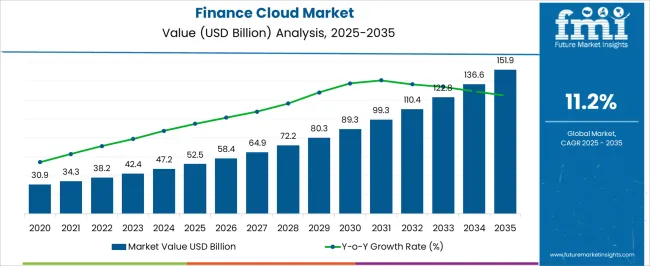
| Metric | Value |
|---|---|
| Finance Cloud Market Estimated Value in (2025 E) | USD 52.5 billion |
| Finance Cloud Market Forecast Value in (2035 F) | USD 151.9 billion |
| Forecast CAGR (2025 to 2035) | 11.2% |
The finance cloud market is experiencing strong growth. Increasing demand for digital transformation in financial services, rising adoption of cloud-based solutions, and the need for real-time data analytics are driving market expansion. Current dynamics reflect growing investment in scalable, secure, and compliant cloud platforms.
Organizations are prioritizing cost efficiency, operational flexibility, and enhanced decision-making capabilities through cloud adoption. The future outlook is shaped by continued integration of artificial intelligence, machine learning, and advanced analytics into finance operations, along with regulatory compliance requirements that encourage secure and auditable platforms.
Growth rationale is underpinned by the need for organizations to streamline financial processes, enhance forecasting accuracy, and support strategic decision-making Cloud infrastructure improvements, coupled with service-based delivery models, are enabling broader adoption across enterprises of all sizes, ensuring sustainable revenue growth, improved operational efficiency, and continued market penetration across global financial sectors.
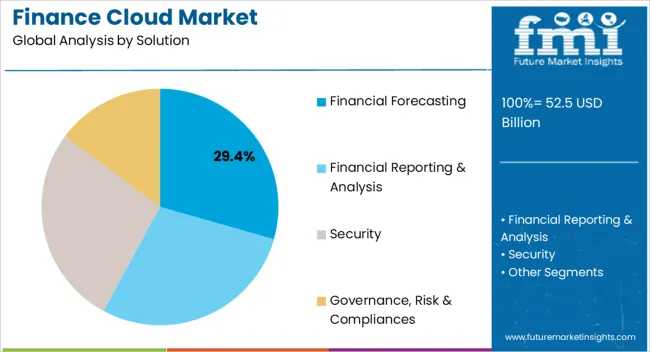
The financial forecasting segment, holding 29.4% of the solution category, has been leading due to its critical role in enabling predictive insights and data-driven financial planning. Adoption has been supported by integration with enterprise resource planning systems and advanced analytics platforms. The segment’s dominance is reinforced by increasing reliance on accurate forecasting for budgeting, risk management, and strategic decision-making.
Technological enhancements in modeling, automation, and scenario analysis have improved forecasting precision. Demand has been stabilized by the requirement for regulatory reporting and internal financial performance monitoring.
Strategic implementation of cloud-based forecasting tools has facilitated scalability, real-time updates, and cross-department collaboration Ongoing innovations and improved user experience are expected to sustain the segment’s market share and drive continued adoption across diverse financial institutions.
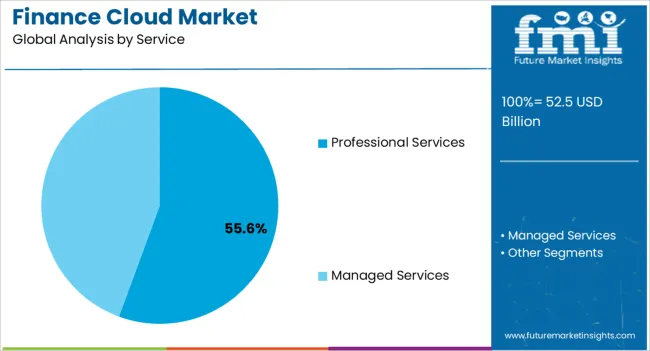
The professional services segment, accounting for 55.6% of the service category, has maintained leadership due to its role in implementation, customization, and support of finance cloud solutions. Adoption has been reinforced by the complexity of integrating cloud platforms with legacy financial systems and the need for expert guidance in compliance and security management.
Demand has been driven by organizations seeking to optimize cloud utilization and maximize return on investment. Service providers’ expertise in deployment, training, and ongoing maintenance has enhanced adoption confidence.
Market positioning has been strengthened by partnerships with cloud solution vendors and expansion into emerging markets Continuous improvement in service delivery models and expansion of consulting capabilities are expected to sustain segment dominance and support further market growth.
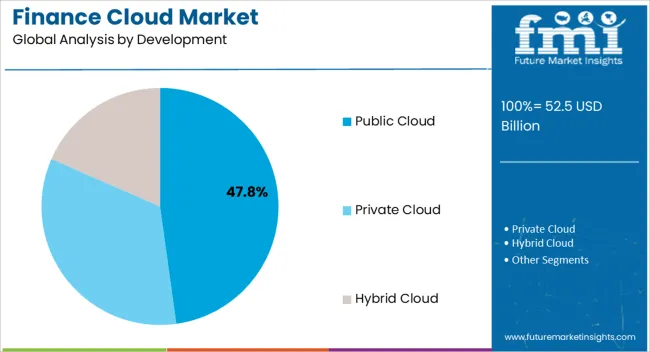
The public cloud segment, representing 47.8% of the development category, has been leading due to its scalability, cost-effectiveness, and accessibility for enterprise finance applications. Adoption has been facilitated by robust infrastructure, flexible deployment models, and compliance with security standards.
Demand has been supported by organizations seeking reduced capital expenditure, enhanced collaboration, and seamless updates. Cloud service providers’ continuous investment in technology enhancements, including high availability and disaster recovery, has reinforced market acceptance.
Public cloud solutions enable rapid deployment of finance applications and facilitate integration with advanced analytics and AI tools Ongoing improvements in performance, security, and regulatory alignment are expected to sustain the segment’s market share and drive continued adoption across diverse enterprise environments.
The global finance cloud market surged to USD 52.5 billion from 2025 to 2025. During the COVID-19 pandemic, the application of digital economic transactions on eCommerce platforms gained even more significance. Businesses are increasingly focused on improving customer experience and expanding operations.
| Historical Market Valuation, 2025 | USD 36.9 billion |
|---|
Financial system implementations and accounting in a cloud environment are comparable to the on-premises environment. Further, the cloud platform provides the flexibility to plan project timelines, assign responsibilities, migrate data, and structure accounting. It ensures that internal operations run smoothly, especially in a post-pandemic scenario.
The size of the global finance cloud market is expected to increase by ten times by the end of 2035. Finance is becoming increasingly popular in addressing inquiries and providing personalized care to customers. The expansion of the eCommerce sector and the widespread use of online platforms are likely to contribute to this growing demand.
Cloud solutions provide financial companies with a robust foundation and an informational backbone, making them strategic platforms. Many financial institutions are utilizing a hybrid mix of public and private clouds to handle back-office tasks and essential business activities such as payments and credit risk monitoring. Businesses are adopting cloud solutions to enhance productivity and ensure better information integration.
Increasing Operational Efficiency and Transparency in Business Processes
Most businesses invest significant time and effort in communicating business information and making informed decisions to become successful. To serve their clients and increase their profit margins, organizations continuously seek systems that can aid them in their endeavors. Cloud solutions provide financial companies with a solid foundation and information backbone, making them strategic platforms.
Nowadays, several financial institutions use a hybrid mix of public and private clouds to handle back-office functions and core business processes such as payments and credit risk management. Companies can improve efficiency and ensure better information integration by adopting cloud solutions. Given the increased competition and rapid changes in the business environment, financial companies need quick access to all relevant information to take necessary business action.
Cloud solutions enhance efficiency and transparency in business operations, significantly fueling market growth.
Higher Demand for Cloud Computing in Developing Regions
Developing economies such as India, China, Japan, and South Korea have shown great potential for the financial cloud services market. These countries are still developing and have limited financial resources, so they require cost-efficient solutions to increase the demand for cloud technology and reduce their IT expenditures.
More regional companies are adopting public cloud services to improve their banking and eCommerce platforms’ interfaces. The competition among financial companies in developing countries to gain a competitive advantage creates potential growth opportunities for the finance cloud market.
High Investment and Maintenance Costs
Acquiring and implementing a cloud system requires a significant initial investment. Major software endeavors such as Microsoft, SAP, Oracle, and IBM Corp. charge high prices for their solutions and maintenance and support functions. The total annual cost of maintaining and updating the cloud system includes internal costs such as user training, IT personnel salaries, and project management, and external costs such as those incurred for IT vendors and contractors.
Additionally, maintenance support fees are paid annually to cloud vendors. Furthermore, the high price of these services limits the adoption of cloud solutions by financial companies unwilling to spend more on the cloud. This, in turn, hampers the market's growth as several financial companies are hesitant to show willingness for upgrades and renewals due to the high cost involved.
Based on services, the professional service segment is expected to grow at a CAGR of 11.4% from 2025 to 2035. Two service industries stand out in the global finance cloud market: professional services and managed services. These industries are crucial in providing effective and efficient cloud services to financial institutions worldwide.
| Top Services | Professional Services |
|---|---|
| CAGR (2020 to 2025) | 14.3% |
| CAGR (2025 to 2035) | 11.4% |
The financial forecasting segment is expected to proliferate at 11.6% CAGR from 2025 to 2035 in the market by solution. Due to the rising automation and digitalization, the demand for cloud-based financial forecasting is increasing rapidly in the BFSI sector.
| Top Solution | Financial Forecasting |
|---|---|
| CAGR (2020 to 2025) | 14.5% |
| CAGR (2025 to 2035) | 11.6% |
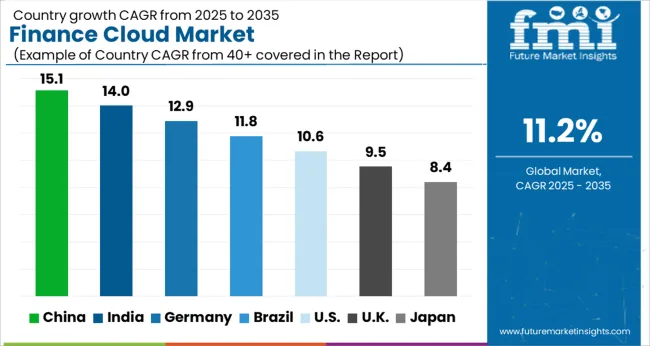
When it comes to the finance cloud market, North America and Asia Pacific are the leading regions. Given its technological prowess, North America, particularly the United States, leads the global finance cloud market. Asia Pacific, as a whole, boasts a robust tech ecosystem. Countries like China and Japan have thriving eCommerce and digital banking platforms that foster innovation in the finance cloud.
| Countries | CAGR |
|---|---|
| United States | 11.9% |
| China | 12.6% |
| Japan | 13.1% |
| South Korea | 12.7% |
| United Kingdom | 12.5% |
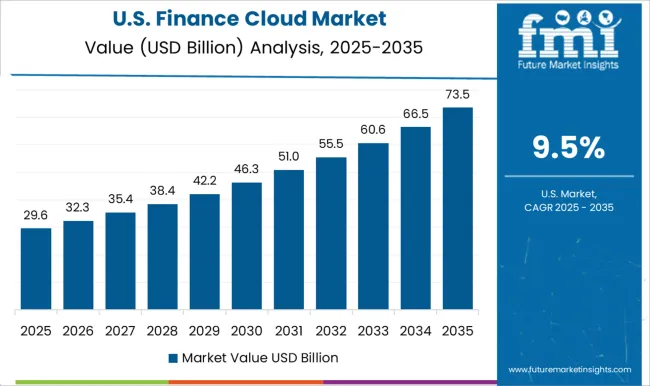
The United States dominates the finance cloud market due to its large and dynamic economy. This benefits start-ups and established businesses by providing vital financial resources for research, development, and commercialization of finance cloud platforms. The strong economy and high internet penetration rates in the US regional market have led to the migration of isolated infrastructure to the cloud.
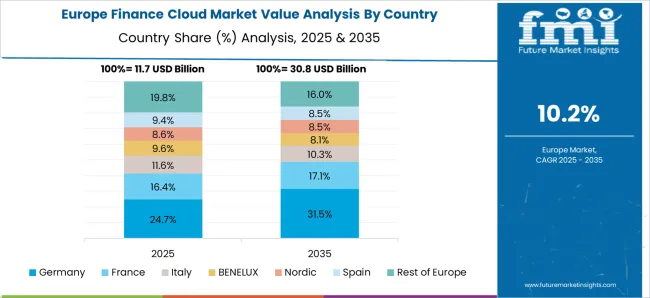
The United Kingdom’s leading position in the regional finance cloud market stems from its strong ecosystem of universities, research institutions, and tech companies focused on cloud computing advancements. The regional market for finance cloud in the United Kingdom is expected to exhibit a significant CAGR of 12.5% over the coming decade from 2025 to 2035.
The regional market of China shows significant growth in the finance cloud market. Demand is continuously growing with a CAGR of 12.6% through 2035. Technology adoption and innovation are strongly ingrained in Chinese culture. This is mirrored in the country’s receptivity to new technological advancements, which makes it the perfect market for cloud computing start-ups seeking to establish the worth of their offerings.
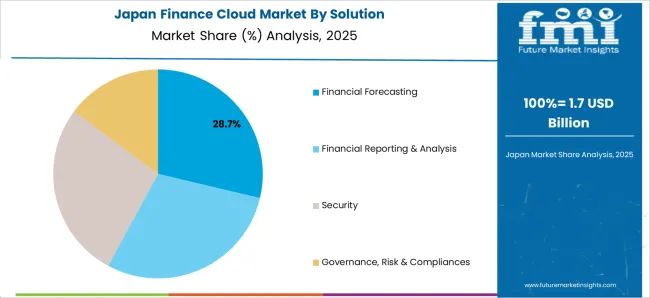
The regional market in Japan is expected to exhibit a rapid growth rate in the coming years, owing to the rapid growth of the banking and insurance sector in developing countries across the nation. The finance cloud demand in Japan is expected to grow at around 13.1% CAGR during the forecast period. The increasing demand for customer management, increased digitalization, and growing client needs are expected to boost the market in the coming years.
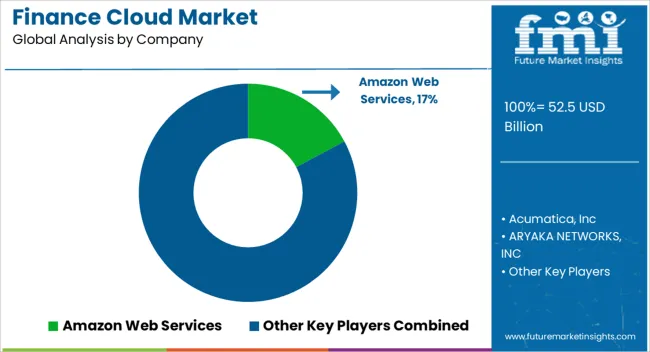
The competitive landscape for finance cloud computing is highly competitive, with numerous established businesses and emerging players trying to offer innovative solutions. The market leaders are well-established companies that provide comprehensive cloud computing platforms. In addition to these industry giants, several start-ups offer finance cloud computing solutions with unique features and capabilities. The finance cloud market has also seen the entry of new and regional players catering to specific niches or industries, contributing to the market’s diversification and development.
Recent Development in the Finance Cloud Market
The global finance cloud market is estimated to be valued at USD 52.5 billion in 2025.
The market size for the finance cloud market is projected to reach USD 151.9 billion by 2035.
The finance cloud market is expected to grow at a 11.2% CAGR between 2025 and 2035.
The key product types in finance cloud market are financial forecasting, financial reporting & analysis, security and governance, risk & compliances.
In terms of service, professional services segment to command 55.6% share in the finance cloud market in 2025.


Full Research Suite comprises of:
Market outlook & trends analysis
Interviews & case studies
Strategic recommendations
Vendor profiles & capabilities analysis
5-year forecasts
8 regions and 60+ country-level data splits
Market segment data splits
12 months of continuous data updates
DELIVERED AS:
PDF EXCEL ONLINE
Embedded Finance Market Size and Share Forecast Outlook 2025 to 2035
Sustainable Finance Market Trends - Growth & Forecast 2025 to 2035
Decentralized Finance Technology Market Trends - Growth & Forecast 2025 to 2035
Europe Embedded Finance Market – Trends & Forecast 2025 to 2035
Electric Vehicle Finance Market Size and Share Forecast Outlook 2025 to 2035
Construction Equipment Finance Market Size and Share Forecast Outlook 2025 to 2035
Natural Language Processing in Finance Market Size and Share Forecast Outlook 2025 to 2035
Cloud Service Market Size and Share Forecast Outlook 2025 to 2035
Cloud Analytics Market Size and Share Forecast Outlook 2025 to 2035
Cloud ERP Industry Analysis in Latin America Forecast Outlook 2025 to 2035
Cloud Backup Service Industry Analysis in Latin America Size and Share Forecast Outlook 2025 to 2035
Cloud Compliance Market Size and Share Forecast Outlook 2025 to 2035
Cloud-Based ITSM Market Size and Share Forecast Outlook 2025 to 2035
Cloud IT Infrastructure Hardware Market Size and Share Forecast Outlook 2025 to 2035
Cloud POS Market Size and Share Forecast Outlook 2025 to 2035
Cloud Systems Management Software Market Size and Share Forecast Outlook 2025 to 2035
Cloud Telephony Services Market Size and Share Forecast Outlook 2025 to 2035
Cloud Field Service Management (FSM) Market Size and Share Forecast Outlook 2025 to 2035
Cloud Seeding System Market Size and Share Forecast Outlook 2025 to 2035
Cloud Professional Services Market Size and Share Forecast Outlook 2025 to 2035

Thank you!
You will receive an email from our Business Development Manager. Please be sure to check your SPAM/JUNK folder too.
Chat With
MaRIA