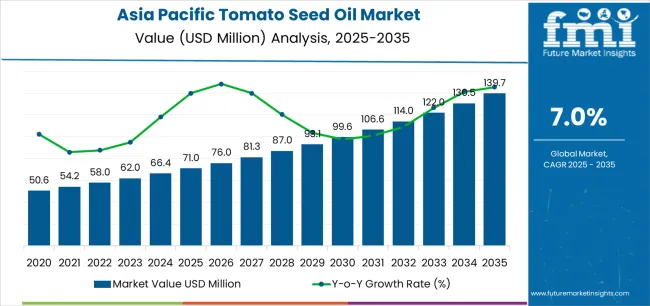
The Asia Pacific tomato seed oil market is projected to grow from USD 71 million in 2025 to USD 139.6 million by 2035, advancing at a robust CAGR of 7%. The refined segment is expected to lead sales with a 65% share in 2025, while the cosmetic industry application is anticipated to account for 35% of the application segment.
Asia Pacific tomato seed oil sales are projected to grow from USD 71 million in 2025 to approximately USD 139.6 million by 2035, recording an absolute increase of USD 68.6 million over the forecast period. This translates into total growth of 96.6%, with demand forecast to expand at a compound annual growth rate (CAGR) of 7% between 2025 and 2035. The overall industry size is expected to grow by nearly 2.0X during the same period, supported by the increasing awareness of tomato seed oil's nutritional and cosmetic benefits, growing emphasis on sustainable ingredient sourcing, and developing understanding of lycopene-rich oil applications throughout Asian manufacturing markets.
| Metric | Value |
|---|---|
| Estimated Value in (2025E) | USD 71 million |
| Forecast Value in (2035F) | USD 139.6 million |
| Forecast CAGR (2025 to 2035) | 7% |
Between 2025 and 2030, Asia Pacific tomato seed oil demand is projected to expand from USD 71 million to USD 100.2 million, resulting in a value increase of USD 29.2 million, which represents 42.6% of the total forecast growth for the decade. This phase of development will be shaped by rising awareness among cosmetic manufacturers about tomato seed oil's exceptional antioxidant properties, increasing adoption in dietary supplement formulations, and growing recognition that tomato processing byproducts offer valuable bioactive compounds. Manufacturers are expanding their extraction capabilities to address the evolving preferences for natural ingredients, organic certifications, and specialized oils targeting specific application needs including premium skincare formulations, functional food products, and nutraceutical supplements.
From 2030 to 2035, sales are forecast to grow from USD 100.2 million to USD 139.6 million, adding another USD 39.4 million, which constitutes 57.4% of the overall ten-year expansion. This period is expected to be characterized by mainstream adoption of tomato seed oil across multiple industries, integration of advanced extraction technologies maximizing yield and quality, and development of innovative applications in emerging sectors. The growing emphasis on circular economy principles and increasing understanding of tomato seed oil's functional benefits will drive demand for high-quality products that meet international standards while supporting sustainable manufacturing practices.
Between 2020 and 2025, Asia Pacific tomato seed oil sales experienced steady expansion at a CAGR of 5.8%, growing from USD 53.4 million to USD 71 million. This period was driven by pioneering extraction facilities in major tomato-producing regions, rising awareness of value addition opportunities in agricultural processing, and growing recognition that food industry byproducts can generate premium ingredients. The industry developed as processing technologies matured and cosmetic manufacturers recognized tomato seed oil's unique positioning. Product standardization, quality certification, and market education initiatives began establishing industry credibility and customer acceptance for specialized applications.
Industry expansion is being supported by the rapid evolution in natural cosmetic ingredients across Asian countries and the corresponding demand for evidence-based functional ingredients that deliver measurable benefits while addressing sustainability concerns. Modern cosmetic formulators increasingly specify tomato seed oil as essential component of anti-aging products, driving demand for oils that address multiple formulation needs including antioxidant protection through high lycopene content, moisturization via essential fatty acid profiles, and marketing appeal through natural origin stories supporting premium positioning.
The growing body of scientific research demonstrating tomato seed oil's bioactive properties is driving demand for standardized, high-quality oils from manufacturers with appropriate extraction capabilities and quality certifications. Research institutions and cosmetic companies are increasingly establishing specifications for tomato seed oil, including minimum lycopene content, fatty acid profiles, and purity parameters. Scientific studies provide evidence supporting application benefits, including photoprotection properties, anti-inflammatory effects, and skin barrier enhancement, requiring specialized extraction and refinement processes that preserve these beneficial compounds while ensuring product stability and consistency.
Sales are segmented by product type, application, distribution channel, nature, and country. By product type, demand is divided into refined and unrefined tomato seed oil. Based on application, sales are categorized into cosmetic industry, food & beverages, food service, dietary supplements, industrial, and animal feed. In terms of distribution channel, demand is segmented into direct sales and retail sales. By nature, sales are classified into organic and conventional. Regionally, demand is focused on China, India, Japan, South Korea, Southeast Asia, and Rest of Asia Pacific.
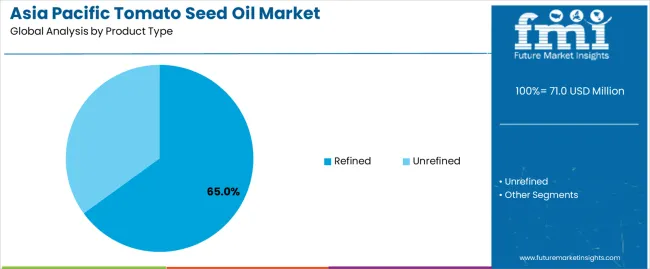
The refined segment is projected to account for 65% of Asia Pacific tomato seed oil sales in 2025, declining moderately to 60.0% by 2035, establishing itself as the preferred choice for industrial applications requiring consistent quality and stability. This commanding position is fundamentally supported by refined oil's superior oxidative stability, standardized specifications meeting industrial requirements, and neutral sensory properties enabling versatile applications. The segment delivers reliable performance characteristics, providing manufacturers with consistent color and odor profiles, extended shelf life for distribution logistics, and predictable behavior in complex formulations essential for quality control.
This segment benefits from established refining infrastructure, international trade standards, and technical specifications that facilitate commercial transactions. Additionally, refined tomato seed oil offers advantages in regulatory compliance, quality documentation, and batch-to-batch consistency that industrial customers require, supported by analytical testing protocols ensuring product integrity and traceability.
The segment's gradual share decline through 2035 reflects growing market sophistication toward unrefined varieties, with cold-pressed and virgin oils gaining traction among premium applications where natural characteristics command price premiums throughout the forecast period.
Key advantages:
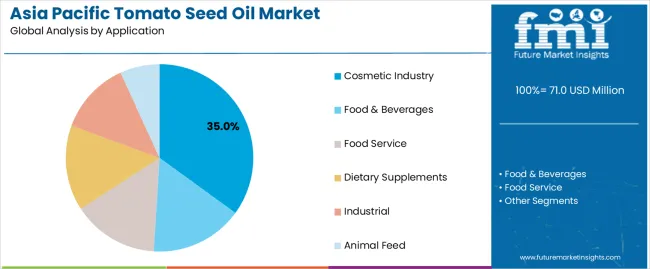
Cosmetic industry is positioned to represent 35% of total tomato seed oil demand across Asian operations in 2025, expanding to 42.0% by 2035, reflecting the segment's dominance as the primary value driver for premium applications. This considerable share directly demonstrates that skincare and beauty products represent core market opportunities, with formulators seeking natural ingredients that deliver functional benefits, support marketing narratives, and meet clean beauty standards.
Modern cosmetic companies increasingly view tomato seed oil as differentiated ingredient, driving demand for products optimized for anti-aging formulations leveraging high antioxidant content, sun care products utilizing natural photoprotection properties, and moisturizers benefiting from balanced fatty acid composition. The segment benefits from continuous innovation focused on extraction methods preserving bioactives, formulation techniques maximizing stability, and clinical studies validating efficacy claims supporting premium positioning.
The segment's expanding share through 2035 reflects accelerating adoption as clinical evidence accumulates, extraction technologies improve, and consumer awareness of tomato seed oil benefits increases across Asian beauty markets.
Key drivers:
Direct sales is strategically estimated to control 60.0% of total Asia Pacific tomato seed oil sales in 2025, declining to 48.0% by 2035, reflecting the channel's importance for bulk transactions while facing growing retail expansion. Business-to-business sales consistently provide efficient distribution for industrial volumes, offering technical support, customization capabilities, and relationship management valuable for manufacturers navigating ingredient selection.
The segment provides essential services through technical consultation where specialists offer formulation guidance, bulk supply agreements ensuring reliable sourcing, and quality assurance programs meeting specific requirements. Major processors, including extraction facilities and trading companies, systematically develop direct sales capabilities, often featuring dedicated account management and technical service teams supporting customer success.
The segment's declining share through 2035 reflects retail channel expansion, which grows from 40.0% in 2025 to 52.0% in 2035, as consumer awareness increases, e-commerce platforms proliferate, and branded retail products offering tomato seed oil gain market presence.
Success factors:
Conventional tomato seed oil is strategically positioned to contribute 70.0% of total Asian sales in 2025, declining to 62.0% by 2035, representing products manufactured through standard processes without organic certification requirements. These conventional products successfully deliver competitive pricing essential for mainstream applications while ensuring quality standards and functional performance that prioritizes cost-effectiveness over premium certifications.
Conventional production serves volume markets, industrial applications, and price-sensitive segments where organic premiums limit adoption. The segment derives significant competitive advantages from established supply chains, processing efficiency enabling competitive costs, and broad availability supporting industrial scale requirements.
The segment's declining share through 2035 reflects organic expansion, which grows from 30.0% in 2025 to 38.0% in 2035, as premium applications increasingly prioritize organic certification, clean-label positioning, and sustainability credentials supporting differentiation strategies aligned with consumer values.
Competitive advantages:
Asia Pacific tomato seed oil sales are advancing rapidly due to increasing valorization of agricultural byproducts, growing demand for natural cosmetic ingredients, and rising awareness of sustainable manufacturing practices. However, the industry faces challenges, including limited extraction infrastructure in developing markets, quality standardization issues across different producers, and competition from established specialty oils. Continued innovation in extraction technology and application development remains central to industry growth.
The rapidly accelerating development of extraction technologies is fundamentally transforming tomato seed oil production from basic mechanical pressing to sophisticated processes, enabling higher yields and quality previously unattainable through traditional methods. Advanced extraction platforms featuring supercritical CO2, enzymatic assistance, and ultrasonic enhancement allow processors to maximize oil recovery, preserve heat-sensitive compounds, and reduce solvent residues with precision meeting pharmaceutical standards. These technological innovations prove particularly transformative for high-value applications, where bioactive preservation and purity directly determine market value.
Major processors invest heavily in extraction infrastructure, process optimization, and quality control systems, recognizing that technology leadership represents competitive advantage for market differentiation. Companies collaborate with equipment manufacturers, research institutions, and technology providers to develop scalable extraction systems that balance yield optimization with quality preservation and economic viability supporting sustainable operations.
Modern tomato seed oil producers systematically incorporate sustainability indicators including carbon footprint, water usage, and waste reduction, recognizing environmental performance as critical differentiator requiring measurement and communication alongside traditional quality parameters. Strategic integration of sustainability metrics enables manufacturers to demonstrate environmental benefits through lifecycle assessments, carbon neutrality initiatives, and circular economy contributions where waste valorization creates shared value. These sustainability credentials prove essential for corporate customers, as multinational brands increasingly require supply chain transparency affecting both supplier selection and long-term partnerships.
Companies implement comprehensive sustainability programs investigating energy efficiency, renewable power adoption, and zero-waste initiatives, including material flow analysis, environmental impact assessments, and third-party certifications. Manufacturers leverage sustainability positioning in corporate communications, highlighting environmental stewardship, social responsibility, and economic development, positioning tomato seed oil as sustainable ingredient beyond functional benefits.
Asian markets increasingly demand transparency regarding tomato seed oil origin, processing methods, and quality verification, driving manufacturers toward blockchain adoption and digital traceability that ensures product authenticity. This traceability trend enables companies to build trust through supply chain visibility, command premiums through verified quality, and differentiate products in markets where adulteration concerns influence purchase decisions. Traceability proves particularly important for export markets where regulatory compliance and customer requirements directly determine market access.
The development of digital tracking systems, laboratory authentication methods, and certification programs expands manufacturers' abilities to verify product claims while preventing fraud and ensuring quality standards. Brands collaborate with technology providers, certification bodies, and industry associations to develop comprehensive traceability systems balancing transparency requirements with commercial confidentiality, supporting premium positioning while protecting proprietary information.
| Country | CAGR % (2025-2035) |
|---|---|
| India | 8.5% |
| Southeast Asia | 7.5% |
| China | 7.2% |
| Rest of Asia Pacific | 7% |
| South Korea | 6.5% |
| Japan | 6.0% |
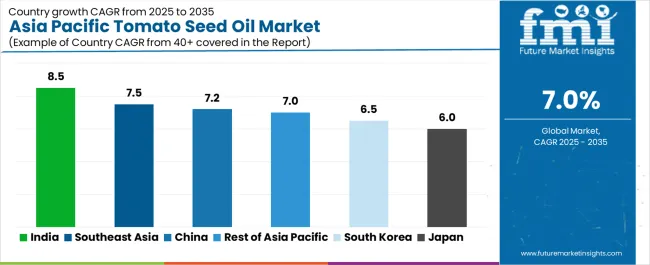
Asia Pacific tomato seed oil sales demonstrate differentiated growth trajectories across major economies, with emerging markets outpacing developed ones through 2035, driven by varying infrastructure development, industrial adoption rates, and market maturity levels. India shows exceptional growth from USD 12.8 million in 2025 to USD 28.8 million by 2035 at 8.5% CAGR. Southeast Asia expands robustly from USD 14.2 million to USD 29.3 million at 7.5% CAGR.
China records strong growth from USD 19.9 million to USD 39.2 million at 7.2% CAGR. Rest of Asia Pacific demonstrates USD 7.1 million to USD 13.9 million at 7% CAGR. South Korea shows USD 8.5 million to USD 15.9 million at 6.5% CAGR. Japan maintains steady expansion from USD 8.5 million to USD 12.5 million at 6.0% CAGR. Overall, sales show varied regional development reflecting different industrial capabilities, market awareness, and application adoption patterns across Asian countries.
Revenue from tomato seed oil in China is projected to exhibit steady growth with a CAGR of 7.2% through 2035, driven by exceptionally large tomato processing industry, established extraction infrastructure, and strong domestic demand across multiple applications throughout the country. China's integrated agricultural system and internationally competitive manufacturing create substantial demand for tomato seed oil across cosmetic, food, and industrial channels.
Major processors, including state-owned enterprises and private companies, systematically expand extraction capacity, often featuring advanced technologies with automated processing systems providing consistent quality. Chinese demand benefits from government support for agricultural value addition, substantial raw material availability from Xinjiang region, and growing middle-class consumption that naturally supports premium ingredient adoption across mainstream demographics.
The relatively strong growth rate reflects China's market scale where established infrastructure enables rapid expansion, requiring both volume growth and quality improvement for value creation throughout the forecast period.
Growth drivers:
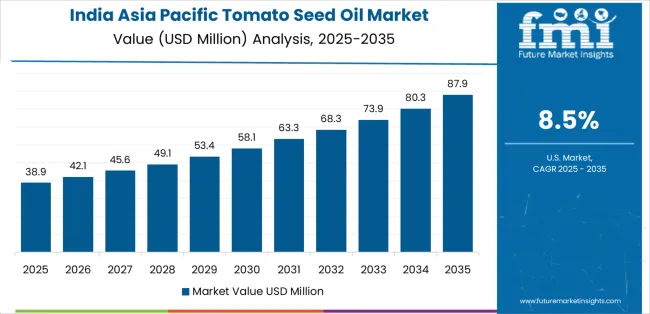
Revenue from tomato seed oil in India is expanding at a CAGR of 8.5%, supported by rapidly developing extraction industry, strong agricultural base providing raw materials, and increasing awareness of value addition opportunities among Indian processors. India's diverse agricultural system and growing food processing sector create favorable conditions for tomato seed oil production with export potential.
Emerging extraction facilities, including small and medium enterprises, actively develop tomato seed oil operations through technology adoption, quality certifications, and market development initiatives targeting both domestic and international customers. Indian sales particularly benefit from competitive production costs enabling global competitiveness, with processors increasingly meeting international quality standards. The country's emphasis on agricultural processing and Make in India initiatives creates supportive policy environment for industry development.
Success factors:
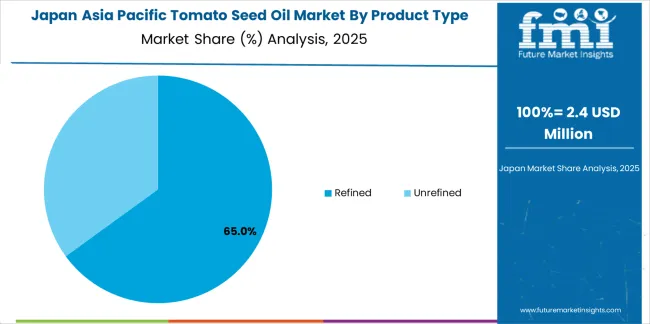
Revenue from tomato seed oil in Japan is growing at a CAGR of 6.0%, fundamentally driven by sophisticated market demanding highest quality standards, innovative applications in cosmetics and supplements, and strong consumer preference for premium natural ingredients. Japan's advanced research capabilities and quality-focused market create unique positioning for high-value tomato seed oil applications.
Major Japanese companies, cosmetic brands, and research institutions actively develop tomato seed oil applications through scientific validation, with particular emphasis on bioactive preservation and clinical efficacy demonstration. Japanese sales particularly benefit from consumer willingness to pay premiums for quality, advanced analytical capabilities ensuring authenticity, and innovative product development within cosmetic and nutraceutical sectors.
Development factors:
Demand for tomato seed oil in Southeast Asia is projected to grow at an impressive CAGR of 7.5%, substantially supported by rapidly developing economies, increasing industrial capabilities, and growing awareness of natural ingredients among Southeast Asian manufacturers. Regional economic integration and improving infrastructure position tomato seed oil as accessible ingredient aligned with regional development priorities.
Major markets including Thailand, Indonesia, Vietnam, and Malaysia systematically introduce tomato seed oil applications with competitive positioning and regional adaptation supporting category development. Southeast Asia's diverse markets and increasing cosmetic manufacturing drive specific applications for natural ingredients. The region's growing middle class and beauty consciousness enable focus on premium ingredients, supporting sustained market expansion throughout the forecast period.
Growth enablers:
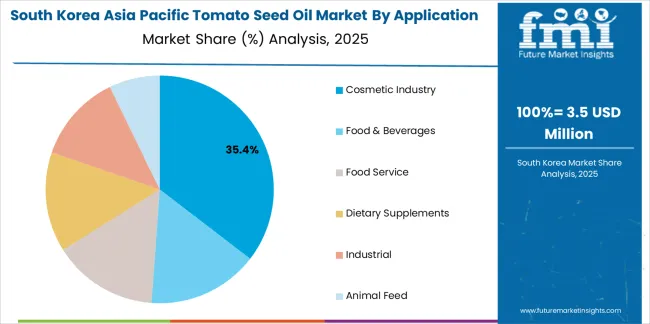
Demand for tomato seed oil in South Korea is expanding at a CAGR of 6.5%, fundamentally driven by exceptional cosmetic innovation, K-beauty global influence, and sophisticated understanding of ingredient functionality among Korean formulators. Korean beauty industry demonstrates particular strength in product innovation, ingredient storytelling, and global trendsetting positioning South Korea as innovation leader.
Korean sales significantly benefit from advanced formulation capabilities creating differentiated products, global export success driving ingredient demand, and consumer sophistication enabling premium positioning. Korean companies' high research investment and rapid product development enable sophisticated tomato seed oil applications based on scientific evidence. The country's innovative cosmetic sector and global influence create favorable environment for advanced application development.
Innovation drivers:
Revenue from tomato seed oil in Rest of Asia Pacific is expanding at 7% CAGR, representing diverse markets including Taiwan, Hong Kong, Singapore, Australia, and emerging nations experiencing varied market development stages. These markets collectively demonstrate growing potential as awareness increases, distribution expands, and applications develop across previously underserved populations.
Developed markets particularly show adoption driven by premium positioning and quality requirements supporting high-value applications, while emerging markets represent growth opportunities as infrastructure develops, awareness builds, and economic growth enables premium ingredient purchases.
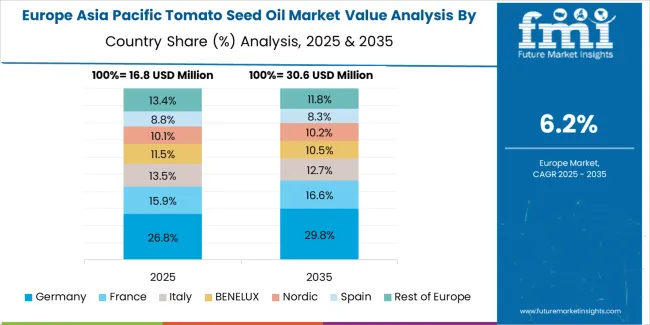
Asia Pacific tomato seed oil sales are projected to grow from USD 71 million in 2025 to USD 139.6 million by 2035, registering a robust CAGR of 7% over the forecast period. India is expected to demonstrate the strongest growth trajectory with an 8.5% CAGR, supported by expanding extraction capacity, government support for food processing, and growing export opportunities. China follows with 7.5% CAGR, attributed to substantial tomato production base and advanced processing infrastructure.
China maintains the largest share at 28.0% in 2025, driven by integrated supply chains and established processing facilities, while growing at 7.2% CAGR. India follows with 18.0% share and exceptional 8.5% CAGR growth reflecting emerging market dynamics. Japan demonstrates 6.0% CAGR, emphasizing premium quality and innovation.
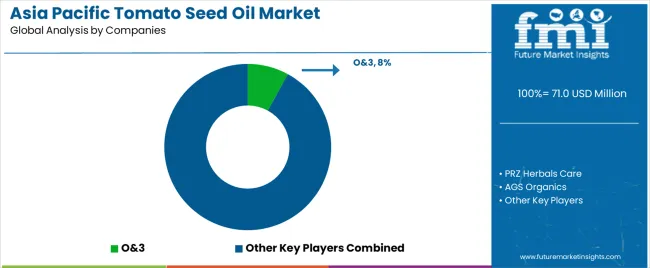
Asia Pacific tomato seed oil sales are defined by competition among specialized extraction companies, agricultural processors, and ingredient distributors. Companies are investing in extraction technology, quality certification, market development, and application research to deliver standardized, traceable, and functional tomato seed oil solutions. Strategic partnerships with tomato processors, cosmetic manufacturers, and research institutions emphasizing supply security and innovation are central to strengthening competitive position.
Major participants include O&3 with an estimated 8.0% share, leveraging its European connections, quality certifications, and strong cosmetic industry relationships through premium oil specialization. O&3 benefits from established distribution networks, technical expertise, and marketing excellence supporting brand recognition among cosmetic formulators.
PRZ Herbals Care holds approximately 6.5% share through its extraction capabilities, emphasizing competitive pricing, reliable supply, and private label services. The company's success in contract manufacturing and ability to provide customized solutions creates strong positioning among brand owners.
AGS Organics accounts for roughly 5.5% share through its position as agricultural ingredient specialist with strong sourcing capabilities, providing certified organic tomato seed oil through sustainable supply chains. The company benefits from agricultural expertise, certification management, and sustainability focus targeting conscious consumers.
Other key players including SVA Organics (4.5%), various regional extractors (3.0%), and emerging companies (2.5%) collectively with additional companies hold 74.0% share, reflecting the fragmented nature of Asian tomato seed oil market where numerous specialized processors, regional manufacturers, and trading companies serve specific segments and geographic markets.
| Item | Value |
|---|---|
| Quantitative Units | USD 71 million |
| Product Type | Refined, Unrefined |
| Application | Cosmetic Industry, Food & Beverages, Food Service, Dietary Supplements, Industrial, Animal Feed |
| Distribution Channel | Direct Sales, Retail Sales |
| Nature | Organic, Conventional |
| Countries Covered | China, India, Japan, South Korea, Southeast Asia, and Rest of Asia Pacific |
| Key Companies Profiled | O&3, PRZ Herbals Care, AGS Organics, SVA Organics, Regional Extractors, Trading Companies |
| Additional Attributes | Dollar sales by product type, application, distribution channel, and nature; regional demand trends across major Asian economies; competitive landscape analysis with specialized extraction companies; market preferences for various oil grades and certifications; integration with cosmetic and food industries; innovations in extraction technology and sustainability; adoption across industrial and retail channels; regulatory framework for specialty oils; market education and awareness initiatives; penetration analysis for organic and sustainable products |
Product Type
The global asia pacific tomato seed oil market is estimated to be valued at USD 71.0 million in 2025.
The market size for the asia pacific tomato seed oil market is projected to reach USD 139.7 million by 2035.
The asia pacific tomato seed oil market is expected to grow at a 7.0% CAGR between 2025 and 2035.
The key product types in asia pacific tomato seed oil market are refined and unrefined.
In terms of application, cosmetic industry segment to command 35.0% share in the asia pacific tomato seed oil market in 2025.


Full Research Suite comprises of:
Market outlook & trends analysis
Interviews & case studies
Strategic recommendations
Vendor profiles & capabilities analysis
5-year forecasts
8 regions and 60+ country-level data splits
Market segment data splits
12 months of continuous data updates
DELIVERED AS:
PDF EXCEL ONLINE
Asian Sea Bass Market Size and Share Forecast Outlook 2025 to 2035
Asia Pallets Market Size and Share Forecast Outlook 2025 to 2035
Asia Textile Chemicals Market Size and Share Forecast Outlook 2025 to 2035
Asia Neopentyl Glycol (NPG) Market Analysis and Forecast for 2025 to 2035
Asia Pacific Loop-mediated Isothermal Amplification (LAMP) Market Size and Share Forecast Outlook 2025 to 2035
Asia Pacific Nutraceutical Market Size and Share Forecast Outlook 2025 to 2035
Asia Pacific Sachet Packaging Machines Market Size and Share Forecast Outlook 2025 to 2035
Asia Pacific Stick Packaging Machines Market Size and Share Forecast Outlook 2025 to 2035
Asia Pacific and Europe Tarpaulin Sheets Market Size and Share Forecast Outlook 2025 to 2035
Asia Pacific Functional Food Ingredients Market Size and Share Forecast Outlook 2025 to 2035
Asia Pacific Solid State Transformers Market Size and Share Forecast Outlook 2025 to 2035
Asia Pacific Gasoline Injection Technologies Market Size and Share Forecast Outlook 2025 to 2035
Asia Pacific Bentonite Market Size and Share Forecast Outlook 2025 to 2035
Asia Pacific In-Car Entertainment System Market Size and Share Forecast Outlook 2025 to 2035
Asia Pacific Plastic Additives Market Size and Share Forecast Outlook 2025 to 2035
Asia Pacific Waterproofing Chemicals Market Analysis - Size, Share, and Forecast 2025 to 2035
Asia Pacific Wild Rice Market Report – Trends, Growth & Forecast 2025–2035
Asia Pacific Vinegar and Vinaigrette Market Insights – Growth, Demand & Forecast 2025–2035
Asia Pacific Whole Grain and High Fiber Foods Market Outlook – Size, Share & Forecast 2025–2035
Asia Pacific Wood Vinegar Market Analysis – Demand, Size & Forecast 2025–2035

Thank you!
You will receive an email from our Business Development Manager. Please be sure to check your SPAM/JUNK folder too.
Chat With
MaRIA