

- Market Size (2026)
- USD 720.6 Mn
- Forecast (2036)
- USD 1315.0 Mn
- CAGR (2026 to 2036)
- 6.2%
How big is the Transformer Oil Tester Market in 2026?
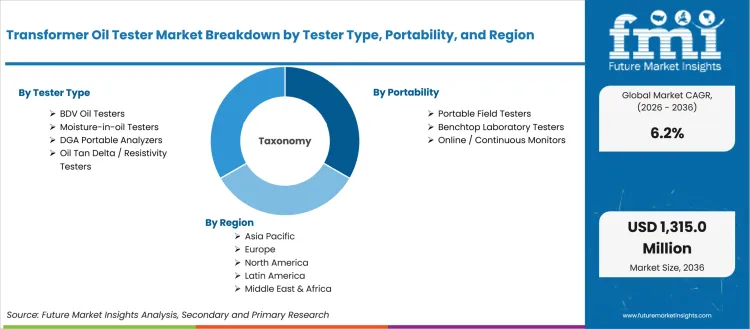
USD 720.6 million in 2026 and USD 1,315.0 million by 2036 at a 6.2% CAGR.
Transformer maintenance is shifting from laboratory-only sampling toward field evidence that can guide outage decisions before failures spread. Utilities and industrial plants are adding oil checks to preventive programs due to transformer replacement delays and higher asset loading. IEA reported in February 2025 that transmission investment rose 10% in 2023 to USD 140 billion. That signal matters for the oil-filled transformer market due to the added need for repeatable fluid diagnostics across new assets and older units. The same evidence supports spending across the liquid-filled transformer market for assets that rely on fluid condition for maintenance decisions.
Buyers include utilities and transformer manufacturers along with oil testing laboratories and industrial plants that need faster evidence. They use testers to assess dielectric strength and moisture levels plus contamination risk and fault gases. The value case is practical: a field tester helps teams decide whether to keep a transformer in service. The same result guides oil filtration decisions or DGA escalation.
Adoption differs by region due to grid age and procurement rules. Local service coverage also shapes buying speed across utilities and industrial maintenance accounts that need calibration access. In established utility systems, tester demand is tied to replacement delays and documentation needs. In high-growth networks, demand is closer to commissioning work and field maintenance scale. The category becomes more valuable once test results connect maintenance teams and calibration records. It also links transformer OEMs and asset-health reviews across the broader transformer market. Medium voltage transformer fleets become frequent service points in networks that add distributed load and renewable interconnections.
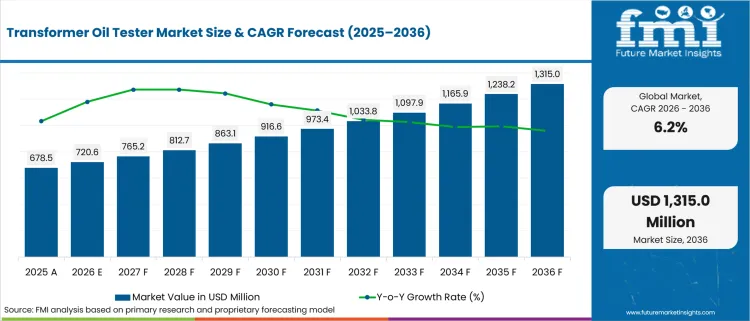
| Metric | Value |
|---|---|
| 2025 Market Size | USD 678.5 million |
| 2026 Market Size | USD 720.6 million |
| 2036 Market Size | USD 1,315.0 million |
| Forecast CAGR (2026-2036) | 6.2% |
| Tester Type Focus | BDV Oil Testers |
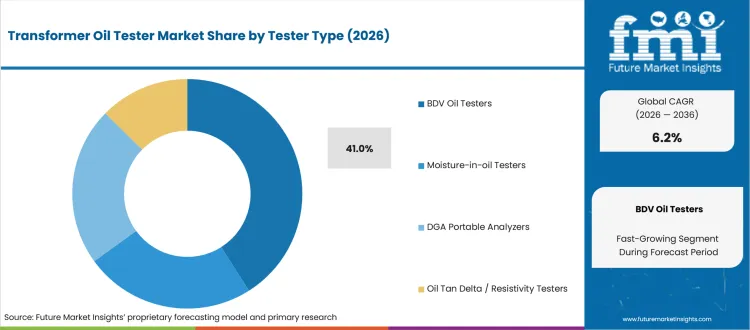
| BDV Oil Testers Share (2026) | 41.0% |
| Portability Focus | Portable Field Testers |
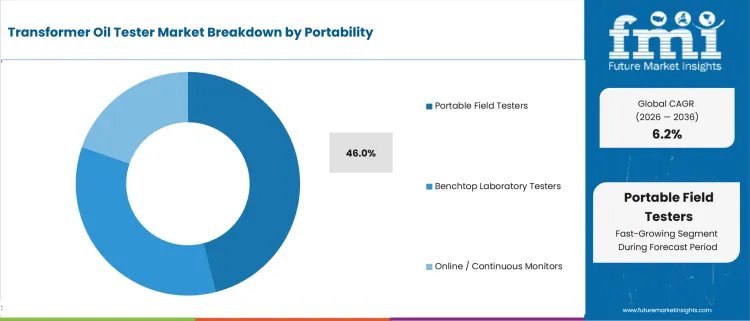
| Portable Field Testers Share (2026) | 46.0% |
| Application Focus | Breakdown Voltage Testing |
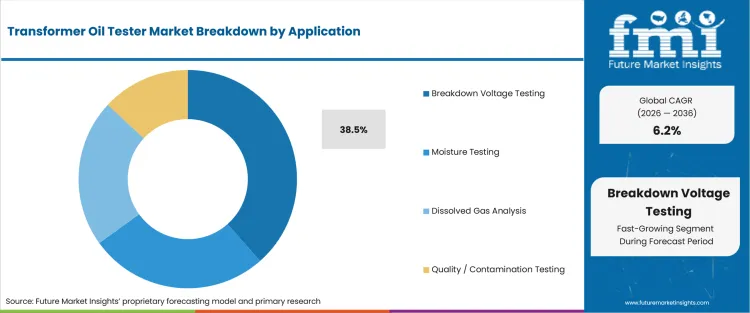
| Breakdown Voltage Testing Share (2026) | 38.5% |
| Fastest-growing Country | China |
| China CAGR by 2036 | 7.1% |
Summary of the Transformer Oil Tester Market
| Market Signal | Commercial Impact |
|---|---|
| Demand and Growth Drivers | Demand for transformer oil testers is increasing as utilities and industrial operators strengthen transformer condition monitoring, standards-based maintenance, and grid reliability programs.
|
| Product and Segment View | BDV oil testers, portable field instruments, and breakdown voltage testing remain the leading commercial segments as utilities prioritize routine transformer oil diagnostics.
|
| Geography and Growth Outlook | Asia continues to lead market expansion through large-scale transmission investment, while Europe supports demand through grid modernization and standards-driven commissioning activities.
|
| Competitive Landscape | Competition increasingly centers on standards compliance, diagnostic depth, calibration support, and lifecycle service capabilities across transformer maintenance programs.
|
| Analyst Perspective | Transformer oil testers are evolving into predictive asset management tools where standards-based diagnostics, calibration reliability, and actionable reporting increasingly influence supplier selection.
- Nikhil Kaitwade, Principal Consultant at Future Market Insights |
How is the transformer oil tester market segmented?
The Transformer Oil Tester industry is segmented by tester type, portability, application, end use, sales channel, and region.
The transformer oil tester market is segmented by tester type, portability, application, end use, sales channel, and region. Tester type covers BDV oil testers, moisture-in-oil testers, DGA portable analyzers, and oil tan delta or resistivity testers. Portability includes portable field testers, benchtop laboratory testers, and online or continuous monitors. Application spans breakdown voltage testing, moisture testing, dissolved gas analysis, and quality or contamination testing. End use covers utilities, transformer manufacturers, oil testing labs, and industrial plants. Sales channel includes direct OEM, electrical test distributors, and service or calibration routes. Regional coverage includes North America, Western Europe, East Asia, and South Asia and Pacific.
Why do BDV Oil Testers matter within the tester type category?
Maintenance teams need a quick view of oil dielectric strength before they decide whether a transformer can remain in service. BDV testers answer that first diagnostic question at a lower cost than gas analysis systems. The category is used by utilities and laboratories. Field contractors also need repeatable go-or-hold evidence during routine inspection.
- BDV Oil Testers are anticipated to hold 41.0% of tester type demand in 2026, driven by their role in first-line insulation screening. ASTM D1816 covers dielectric breakdown voltage testing for insulating liquids used in transformers. That method supports buyer confidence in repeatable oil acceptance checks.
- Utility maintenance teams using BDV testers can decide whether oil needs treatment before a broader transformer inspection is scheduled. This buyer value connects to transformer oil purification units due to poor dielectric results that often trigger filtration and dehydration or other oil handling decisions.
What supports demand for Portable Field Testers?
Substation crews often need test evidence before an outage window closes. Portable field units fit that work pattern owing to reduced dependence on external sample turnaround for basic oil checks. Buyers compare weight and battery support before choosing a field device. Safety interlocks and report output remain tied to calibration access.
- Portable Field Testers are expected to account for 46.0% of portability demand in 2026, supported by site-level decisions in substations and plants. Megger states that its OTS PB models are small and light for field use. That supports quicker maintenance triage outside laboratory settings.
- For maintenance supervisors, portable testers reduce uncertainty during short inspections by turning oil condition into a same-day action point. Buyers gain value once field results can be documented and reviewed. They can compare readings against previous tests without sending every sample to a laboratory.
How is Breakdown Voltage Testing positioned within the application category?
Oil condition decisions usually begin with evidence on whether the fluid can withstand electrical stress. Breakdown voltage testing remains central owing to its familiar standards-based role in fresh oil acceptance. The segment also helps buyers screen moisture and contamination risk before more detailed tests are ordered.
- Breakdown Voltage Testing is projected to hold 38.5% share in 2026, owing to its use in acceptance checks and in-service screening. IEC 60156:2025 specifies the method for determining insulating-liquid breakdown voltage at power frequency. This keeps BDV testing relevant across laboratories and field teams.
- Asset managers use breakdown voltage evidence to decide whether oil handling or retesting is justified. They also use it before ordering deeper analysis for higher-risk transformer assets in field service. The segment connects to the mineral-based transformer oil supply base due to mineral oil remaining common in oil-filled electrical equipment that needs periodic supervision.
What market factors influence demand from Utilities?
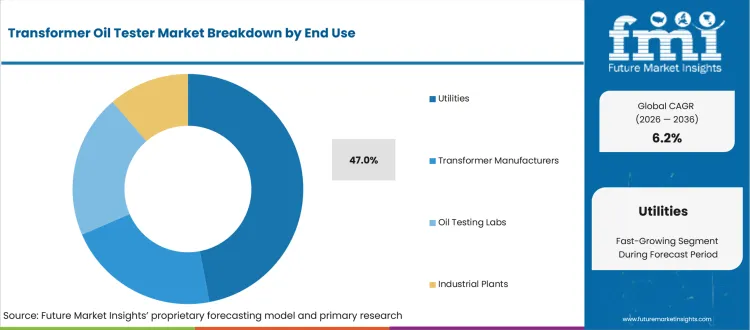
Utilities buy oil testers to protect transformer uptime and document maintenance choices across regulated asset fleets. Their buying decision is less about one instrument and more about dependable evidence. Calibration records and standards menus matter due to oil results influencing outage planning. Service response also affects capital replacement timing for assets that cannot return quickly after failure.
- Utilities are projected to account for 47.0% of end-use demand in 2026, reinforced by their need to protect transformer fleets from preventable faults. ASCE reported in March 2025 that transformer costs had risen 60% to 80% from January 2020. This makes asset-life extension more valuable.
- The executive case for utilities is budget protection across long replacement cycles. Reliable oil testing lets managers prioritize repairs and avoid unnecessary oil treatment. It also helps defend maintenance choices before a unit failure becomes a capital emergency.
How is Direct OEM positioned within the sales channel category?
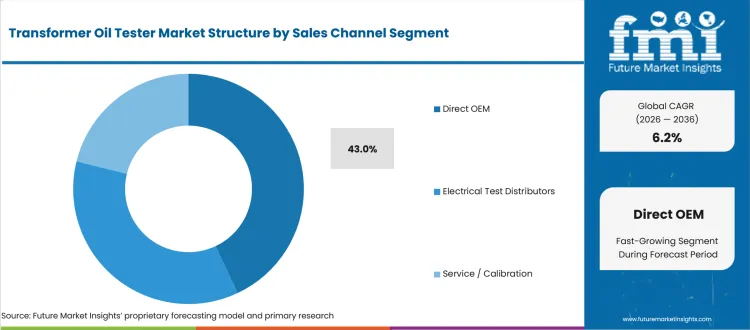
Large buyers want clear accountability after an oil tester is placed in service. Direct OEM routes are important due to calibration and firmware support. Standards updates and training also affect the value of readings over time. Distributor channels remain useful, but large accounts often want one responsible supplier for the test workflow.
- Direct OEM sales are projected to dominate with 43.0% share in 2026, attributable to buyer preference for factory-backed calibration and application support. Doble describes Myrkos 2 as a portable DGA analyzer using gas chromatography and headspace extraction. That product depth favors direct technical engagement.
- Procurement teams value direct OEM routes when tester performance must align with internal quality systems and standard procedures. The route reduces handoff risk between the supplier and service provider. It also gives the maintenance user a clearer escalation path.
What are the drivers, restraints, and opportunities in the transformer oil tester market?
Near-term purchases are being shaped by the grid reliability requirement, calibration constraint, and condition-monitoring expansion route outlined below.
- Driver: Grid reliability spending is driving tester purchases due to the need for commissioning checks and preventive maintenance evidence.
- Restraint: Calibration cost and technician skill requirements are slowing adoption of higher-value DGA and online monitoring systems.
- Opportunity: Condition-monitoring expansion is opening supplier access through portable DGA and online DGA. Service-backed reporting models also widen the addressable buyer base.
Grid operators are trying to keep transformer fleets available during a period of heavier network reinforcement. IEA reported in February 2025 that more than 1,600 GW of solar and wind projects in late-stage development were awaiting grid connections. This matters for oil testers due to grid queues increasing the cost of transformer downtime and raising the value of maintenance evidence.
Calibration and skills remain purchase barriers for buyers that move beyond BDV testing. Doble reported in April 2026 that Myrkos 2 extended calibration gas cylinder shelf life from 18 months to 30 months. That detail shows how suppliers can convert a restraint into value by reducing service burden for field diagnostics.
Condition-monitoring demand creates room for suppliers that connect oil data to broader asset decisions. Vaisala announced in April 2025 enhanced transformer monitoring technology focused on DGA and additional transformer condition parameters. The opportunity is meaningful for suppliers that can translate readings into clear maintenance actions, not only instrument outputs.
Which country CAGRs are profiled in the transformer oil tester market?
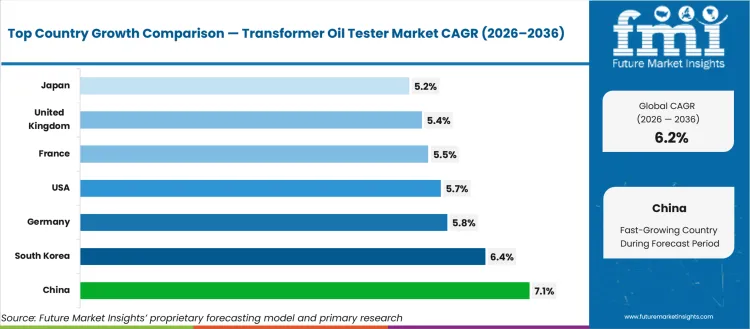
| Country | CAGR |
|---|---|
| United States | 5.7% |
| United Kingdom | 5.4% |
| Germany | 5.8% |
| France | 5.5% |
| Japan | 5.2% |
| China | 7.1% |
| South Korea | 6.4% |
| India | 6.8% |
How do country-level CAGRs compare in the transformer oil tester market?
Country CAGR differences reflect how transformer oil testing is purchased across asset fleets. In established utility markets, the case is tied to replacement delays and standards discipline. Service documentation also shapes supplier selection. In high-growth grid markets, the same equipment is closer to commissioning work and field maintenance expansion. China and India show visible growth from network additions. The United States and Europe show replacement and resilience logic. Japan and South Korea are shaped by reliability-led procurement. Buyers should compare service coverage and calibration access before reviewing country CAGR figures. Channel depth also shapes supplier fit.
- The United States is projected to record 5.7% CAGR by 2036, driven by replacement delays and outage-cost pressure. ASCE reported in March 2025 that large transformer lead times averaged 120 weeks. This profile differs from expansion-led markets due to tester purchases tied to keeping existing assets in service longer.
- The United Kingdom is expected to grow at 5.4% CAGR during the forecast period, supported by regulated network spending. Ofgem announced in December 2025 that GBP 10.3 billion of initial investment would strengthen electricity transmission. The country profile is procurement-led due to framework buying and service records that shape supplier access.
- Germany is forecast to advance at 5.8% CAGR over the assessment period, reinforced by transmission approval activity and documentation-led buying. Bundesnetzagentur reported in January 2026 that it approved roughly 2,000 km of power lines in 2025. This creates commissioning work and favors suppliers that support standard test routines.
- France is anticipated to post 5.5% CAGR through 2036, attributable to long-cycle transmission renewal and centralized grid planning. CRE stated in September 2025 that RTE’s network plan analyzed EUR 100 billion of investment to 2040. The market compares as a steady service-backed opportunity and not a price-led equipment race.
- Japan is likely to expand at 5.2% CAGR by 2036, shaped by reliability-focused network coordination and conservative qualification. OCCTO published its FY2025 annual report in January 2026 under Article 181 of its operational rules. Japan compares with other markets as a documentation and distributor-support market for trusted instruments.
- China is estimated to rise at 7.1% CAGR between 2026 and 2036, driven by large grid investment and domestic tester availability. SASAC reported in January 2026 that State Grid plans up to CNY 4 trillion in fixed-asset investment. Growth is more expansion-led than Europe due to new assets enlarging the testing pool.
- South Korea is projected to record 6.4% CAGR by 2036, supported by power infrastructure investment for industrial load security. KOTRA reported in May 2025 that KEPCO would spend about KRW 72.8 trillion by 2038. The country differs from India and China due to centralized utility procurement shaping supplier entry.
- India is expected to grow at 6.8% CAGR during the forecast period, propelled by transmission expansion and local field equipment supply. PIB reported in September 2024 that the transmission network would expand to 6.48 lakh ckm by 2032. India compares as a price-sensitive market where portable BDV tools gain wider reach.
Who are the notable companies in the transformer oil tester market?
Megger, Doble Engineering, BAUR, Morgan Schaffer, Vaisala, Koehler Instrument, SCOPE T&M, Motwane, Stanlay, KPM, and Rectifiers & Electronics are the notable companies shaping this market.
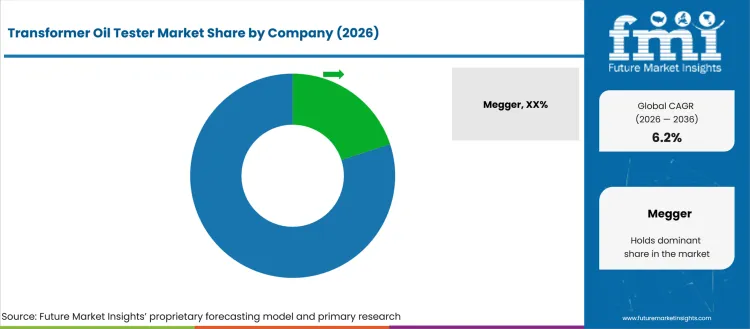
Supplier competition is structured by the test problem the buyer wants to solve. Megger, BAUR, and Koehler Instrument are more relevant when the task centers on dielectric strength and routine oil quality checks. Doble Engineering, Morgan Schaffer, and Vaisala gain preference when the buyer wants DGA and transformer condition monitoring. SCOPE T&M, Motwane, Stanlay, KPM, and Rectifiers & Electronics are better suited to price-sensitive field demand. The selection question is whether the buyer needs a routine BDV tester or laboratory unit. Some accounts need a monitoring system tied to broader test and measurement equipment workflows.
- Megger and BAUR focus on insulating oil test portfolios that fit utilities and laboratories needing standards-based BDV measurement. Their relevance is tied to product breadth and test routines. Service access also matters for buyers that need stable field or laboratory readings.
- Doble Engineering and Morgan Schaffer gain preference in DGA workflows due to gas analysis depth and transformer fault interpretation. Buyers choosing these suppliers are usually protecting high-value assets that justify more detailed diagnostics than a BDV test can provide.
- Vaisala is relevant to online monitoring buyers that need continuous DGA and condition parameters. The company’s April 2025 transformer monitoring update supports demand from asset owners that want early fault visibility without waiting for periodic sampling.
- Regional field suppliers such as SCOPE T&M, Motwane, Stanlay, KPM, and Rectifiers & Electronics are suited to utility tenders and industrial plants that need accessible BDV tools. Their channel position is more relevant in tenders that prioritize service access and local documentation.
Competitive Benchmarking: Transformer Oil Tester Market
| Company | Oil Test Portfolio Fit | DGA or Monitoring Fit | Service and Calibration Fit | Geographic Footprint |
|---|---|---|---|---|
| Megger | High | Medium | Strong | Global |
| Doble Engineering | High | High | Strong | Global |
| BAUR | High | Low | Strong | Europe and global distributors |
| Morgan Schaffer | Medium | High | Strong | North America and global |
| Vaisala | Medium | High | Strong | Global |
| Koehler Instrument | Medium | Low | Medium | Global distributors |
| SCOPE T&M | Medium | Low | Medium | India and export markets |
| Motwane | Medium | Low | Medium | India |
| Stanlay | Medium | Low | Regional | India |
| KPM | Medium | Low | Regional | India |
| Rectifiers & Electronics | Medium | Low | Regional | India |
Source: Future Market Insights competitive analysis, 2026. Ratings reflect relative portfolio relevance, workflow or project fit, service capability, and geographic reach.
Key Developments in the Transformer Oil Tester Market
- In April 2026, Doble Engineering updated Myrkos 2 field use features including a calibration gas cylinder shelf life increase from 18 months to 30 months. The development matters due to field DGA buyers evaluating service burden and uptime alongside analytical capability.
- In April 2025, Vaisala announced enhanced transformer monitoring technology for DGA and additional condition parameters. The development reflects a move toward automated transformer condition assessment, which supports suppliers that can connect gas readings with maintenance decisions.
- In November 2025, BAUR published updated DTA 100 C product documentation describing automatic electrical breakdown strength testing for insulating liquids. The update supports laboratory demand due to buyers needing standards-aligned routines and repeatable results for transformer insulation pressboards and fluid systems.
- In December 2024, Motwane released updated OTS-100A product literature for automatic oil insulating test sets. The action points to local field demand in India, where fully automatic BDV tools support preventive maintenance across utilities and industrial plants.
Key Players in the Transformer Oil Tester Market
Global Oil Test Instrument Specialists
- Megger
- BAUR
- Koehler Instrument
DGA and Monitoring Specialists
- Doble Engineering
- Morgan Schaffer
- Vaisala
Regional Field Equipment Suppliers
- SCOPE T&M
- Motwane
- Stanlay
- KPM
- Rectifiers & Electronics
Transformer Oil Tester Market - Report Scope
| Coverage field | Report scope |
|---|---|
| Market breakdown | Transformer Oil Tester Market Breakdown By Tester Type, Portability, Application, End Use, Sales Channel, and Region |
| Market Definition | Instruments used to test insulating oil in oil-filled transformers and related high-voltage electrical equipment. |
| Regions Covered | North America, Western Europe, East Asia, South Asia and Pacific |
| Countries Covered | United States, United Kingdom, Germany, France, Japan, China, South Korea, India and broader coverage |
| Key Companies Profiled | Megger, Doble Engineering, BAUR, Morgan Schaffer, Vaisala, Koehler Instrument, SCOPE T&M, Motwane, Stanlay, KPM, Rectifiers & Electronics |
| Forecast Period | 2026 to 2036 |
| Approach | Hybrid bottom-up and top-down methodology using equipment demand, tester pricing, transformer fleet signals, and channel validation |
Transformer Oil Tester Market - Research Methodology
| Method | Approach |
|---|---|
| Primary Research | FMI analysts reviewed inputs from utility maintenance teams, transformer manufacturers, oil testing laboratories, industrial plants, and electrical test distributors. Discussions covered testing frequency, calibration needs, field portability, standards menus, and account support expectations. |
| Desk Research | Desk research covered IEC and ASTM standards, grid investment sources, official energy network plans, company product information, and public electrical testing references. Product relevance was checked against BDV, moisture, DGA, tan delta, and resistivity testing roles. |
| Market Sizing and Forecasting | The model combined equipment replacement cycles, tester pricing bands, installed transformer maintenance intensity, country grid investment signals, and service-channel depth. Forecast assumptions were adjusted for utility spending, OEM inspection requirements, and field maintenance scale. |
| Data Validation | Forecasts were checked against transformer fleet signals, oil-filled equipment demand, standards evidence, and supplier portfolios. Duplicate external statistics were removed so each evidence point supported one claim within the article. |
Transformer Oil Tester Market by Segments
Transformer Oil Tester Market segmented by Tester Type:
- BDV Oil Testers
- Moisture-in-oil Testers
- DGA Portable Analyzers
- Oil Tan Delta / Resistivity Testers
Transformer Oil Tester Market segmented by Portability:
- Portable Field Testers
- Benchtop Laboratory Testers
- Online / Continuous Monitors
Transformer Oil Tester Market segmented by Application:
- Breakdown Voltage Testing
- Moisture Testing
- Dissolved Gas Analysis
- Quality / Contamination Testing
Transformer Oil Tester Market segmented by End Use:
- Utilities
- Transformer Manufacturers
- Oil Testing Labs
- Industrial Plants
Transformer Oil Tester Market segmented by Sales Channel:
- Direct OEM
- Electrical Test Distributors
- Service / Calibration
Transformer Oil Tester Market by Region:
- North America
- United States
- Canada
- Western Europe
- United Kingdom
- Germany
- France
- Nordic
- BENELUX
- Rest of Western Europe
- East Asia
- China
- Japan
- South Korea
- South Asia and Pacific
- India
- ASEAN
- Australia & New Zealand
- Rest of South Asia and Pacific
Research Sources and Bibliography
- International Electrotechnical Commission. (2024, February 1). IEC 60422:2024 mineral insulating oils in electrical equipment. IEC.
- International Energy Agency. (2025, February 25). Building the future transmission grid. IEA.
- International Energy Agency. (2025, February 25). Rising component prices and supply chain pressures are hindering the development of transmission grid infrastructure. IEA.
- American Society of Civil Engineers. (2025, March). 2025 report card for America’s infrastructure: Energy. ASCE.
- ASTM International. (2019). D1816 standard test method for dielectric breakdown voltage of insulating liquids using VDE electrodes. ASTM International.
- International Electrotechnical Commission. (2025, January 31). IEC 60156:2025 insulating liquids - determination of the breakdown voltage at power frequency - test method. IEC.
- Megger. (2026). Insulating oil test equipment for transformer fluid analysis. Megger.
- Megger. (2026). OTS PB and OTS AF series insulating oil test sets. Megger.
- Doble Engineering. (2026). Myrkos 2. Doble Engineering.
- Doble Engineering. (2026, April 7). Myrkos 2: The best portable DGA analyzer just got better. Doble Engineering.
- Office of Gas and Electricity Markets. (2025, December 4). Ofgem unlocks £28 billion investment to maintain a safe, secure and resilient energy grid and upgrade and expand capacity to meet growing demands. Ofgem.
- Bundesnetzagentur. (2026, January 2). Energy transition clears crucial hurdle - significant progress in electricity grid expansion in 2025. Bundesnetzagentur.
- Commission de Regulation de l’Energie. (2025, September 18). Public consultation on the ten-year network development plan 2025. CRE.
- Organization for Cross-regional Coordination of Transmission Operators, Japan. (2026, January 14). Annual report FY2025. OCCTO.
- State-owned Assets Supervision and Administration Commission of the State Council. (2026, January 22). State Grid plans 4 trillion yuan fixed assets investment in 15th Five-Year Plan. SASAC.
- Press Information Bureau. (2024, September 23). National Electricity Plan 2023 to 2032 for central and state transmission systems. Government of India.
- Korea Trade-Investment Promotion Agency. (2025, May 28). KEPCO to invest 72.8 tln won by 2038 to expand power supply infrastructure for advanced industries. KOTRA.
- Vaisala. (2025, April 7). Vaisala lowers transformer risks with enhanced monitoring technology. Vaisala.
- BAUR. (2025, November). DTA 100 C oil breakdown voltage tester. BAUR.
This bibliography is provided for reader reference and uses primary government, standards-body, official trade body, and company sources.
This Report Answers
- What is the expected global value of the Transformer Oil Tester Market in 2026 and 2036?
- What CAGR is forecast for transformer oil testers during the 2026 to 2036 period?
- Which tester type category holds a notable share in 2026?
- Why do utilities and laboratories buy transformer oil testing instruments?
- How do portable field testers shape maintenance workflows?
- Which countries are compared in the transformer oil tester forecast?
- Which companies compete across BDV testers, DGA analyzers, and oil monitoring systems?
- What products are included within the transformer oil tester definition?
- How does FMI size and forecast transformer oil tester demand across segments and countries?
- What buyer factors should procurement teams assess before selecting suppliers?
Frequently Asked Questions
Why should executives track the Transformer Oil Tester Market?
Executives should track this market because transformer oil condition directly affects asset uptime outage risk and capital replacement timing across power networks.
What business problem does the Transformer Oil Tester Market address?
It provides fast field evidence on oil dielectric health so maintenance teams can decide whether a transformer can remain safely in service.
What should procurement leaders evaluate before selecting suppliers?
Procurement leaders should evaluate standards compliance calibration support field portability reporting clarity and long term service availability.
What can limit return on investment for buyers?
Return on investment can be limited by poor calibration access inconsistent test results and lack of technician training for field interpretation.
How can suppliers build executive confidence?
Suppliers build confidence by offering standards aligned testing reliable calibration programs clear maintenance reporting and strong field support.
Preview the report firsthand - request a free sample
Get SampleGet the brochure for pricing and purchase details.
Get PDFTable of Content
- Key Takeaways
- Market Size and CAGR
- Top Growth Driver
- Fastest Growing Segment
- Leading Region
- Key Companies
- Emerging Opportunities
- Executive Summary
- Global Market Outlook
- Demand-side Trends
- Supply-side Trends
- Technology Roadmap Analysis
- Analysis and Recommendations
- Analyst Perspective (What is happening? Why now? What should investors know?)
- Key Questions Answered
- How large is the market?
- What is the CAGR?
- What are key trends?
- Which region dominates?
- Who are the leaders?
- Market Overview
- Market Coverage / Taxonomy
- Market Definition / Scope / Limitations
- Research Methodology
- Chapter Orientation
- Analytical Lens and Working Hypotheses
- Market Structure, Signals, and Trend Drivers
- Benchmarking and Cross-market Comparability
- Market Sizing, Forecasting, and Opportunity Mapping
- Research Design and Evidence Framework
- Desk Research Programme (Secondary Evidence)
- Expert Input and Fieldwork (Primary Evidence)
- Tooling, Models, and Reference Databases
- Data Engineering and Model Build
- Quality Assurance and Audit Trail
- Market Background
- Market Dynamics (Drivers, Restraints, Opportunity, Trends)
- Scenario Forecast (Optimistic, Likely, Conservative)
- Impact Analysis
- AI Impact
- Sustainability Impact
- Regulatory Impact
- Technology Impact
- Consumer / Buyer Analysis
- Purchase Drivers
- Adoption Barriers
- Buyer Journey
- Opportunity Map Analysis
- Product Life Cycle Analysis
- Supply Chain Analysis
- Investment Feasibility Matrix
- Value Chain Analysis
- PESTLE and Porter's Analysis
- Regulatory Landscape
- Regional Parent Market Outlook
- Production and Consumption Statistics
- Import and Export Statistics
- Global Market Analysis and Forecast, 2021 to 2036
- Historical Market Size Value (USD Million) & Volume (Unit) Analysis, 2021 to 2025
- Current and Future Market Size Value (USD Million) & Volume (Unit) Projections, 2026 to 2036
- Y-o-Y Growth Trend Analysis
- Absolute $ Opportunity Analysis
- Global Market Pricing Analysis, 2021 to 2036
- Global Market Analysis and Forecast, By Tester Type, 2021 to 2036
- Introduction / Key Findings
- Historical Market Size Value (USD Million) & Volume (Unit) Analysis By Tester Type, 2021 to 2025
- Current and Future Market Size Value (USD Million) & Volume (Unit) Analysis and Forecast By Tester Type, 2026 to 2036
- BDV Oil Testers
- Moisture-in-oil Testers
- DGA Portable Analyzers
- Oil Tan Delta / Resistivity Testers
- BDV Oil Testers
- Y-o-Y Growth Trend Analysis By Tester Type, 2021 to 2025
- Absolute $ Opportunity Analysis By Tester Type, 2026 to 2036
- Global Market Analysis and Forecast, By Portability, 2021 to 2036
- Introduction / Key Findings
- Historical Market Size Value (USD Million) & Volume (Unit) Analysis By Portability, 2021 to 2025
- Current and Future Market Size Value (USD Million) & Volume (Unit) Analysis and Forecast By Portability, 2026 to 2036
- Portable Field Testers
- Benchtop Laboratory Testers
- Online / Continuous Monitors
- Portable Field Testers
- Y-o-Y Growth Trend Analysis By Portability, 2021 to 2025
- Absolute $ Opportunity Analysis By Portability, 2026 to 2036
- Global Market Analysis and Forecast, By Application, 2021 to 2036
- Introduction / Key Findings
- Historical Market Size Value (USD Million) & Volume (Unit) Analysis By Application, 2021 to 2025
- Current and Future Market Size Value (USD Million) & Volume (Unit) Analysis and Forecast By Application, 2026 to 2036
- Breakdown Voltage Testing
- Moisture Testing
- Dissolved Gas Analysis
- Quality / Contamination Testing
- Breakdown Voltage Testing
- Y-o-Y Growth Trend Analysis By Application, 2021 to 2025
- Absolute $ Opportunity Analysis By Application, 2026 to 2036
- Global Market Analysis and Forecast, By End Use, 2021 to 2036
- Introduction / Key Findings
- Historical Market Size Value (USD Million) & Volume (Unit) Analysis By End Use, 2021 to 2025
- Current and Future Market Size Value (USD Million) & Volume (Unit) Analysis and Forecast By End Use, 2026 to 2036
- Utilities
- Transformer Manufacturers
- Oil Testing Labs
- Industrial Plants
- Utilities
- Y-o-Y Growth Trend Analysis By End Use, 2021 to 2025
- Absolute $ Opportunity Analysis By End Use, 2026 to 2036
- Global Market Analysis and Forecast, By Sales Channel, 2021 to 2036
- Introduction / Key Findings
- Historical Market Size Value (USD Million) & Volume (Unit) Analysis By Sales Channel, 2021 to 2025
- Current and Future Market Size Value (USD Million) & Volume (Unit) Analysis and Forecast By Sales Channel, 2026 to 2036
- Direct OEM
- Electrical Test Distributors
- Service / Calibration
- Direct OEM
- Y-o-Y Growth Trend Analysis By Sales Channel, 2021 to 2025
- Absolute $ Opportunity Analysis By Sales Channel, 2026 to 2036
- Global Market Analysis and Forecast, By Region, 2021 to 2036
- Introduction
- Historical Market Size Value (USD Million) & Volume (Unit) Analysis By Region, 2021 to 2025
- Current Market Size Value (USD Million) & Volume (Unit) Analysis and Forecast By Region, 2026 to 2036
- North America
- Latin America
- Western Europe
- Eastern Europe
- East Asia
- South Asia and Pacific
- Middle East & Africa
- Market Attractiveness Analysis By Region
- North America Market Analysis and Forecast, By Country, 2021 to 2036
- Historical Market Size Value (USD Million) & Volume (Unit) Trend Analysis By Market Taxonomy, 2021 to 2025
- Market Size Value (USD Million) & Volume (Unit) Forecast By Market Taxonomy, 2026 to 2036
- By Country
- USA
- Canada
- Mexico
- By Tester Type
- By Portability
- By Application
- By End Use
- By Sales Channel
- By Country
- Market Attractiveness Analysis
- By Country
- By Tester Type
- By Portability
- By Application
- By End Use
- By Sales Channel
- Key Takeaways
- Latin America Market Analysis and Forecast, By Country
- Historical Market Size Value (USD Million) & Volume (Unit) Trend Analysis By Market Taxonomy, 2021 to 2025
- Market Size Value (USD Million) & Volume (Unit) Forecast By Market Taxonomy, 2026 to 2036
- By Country
- Brazil
- Chile
- Rest of Latin America
- By Tester Type
- By Portability
- By Application
- By End Use
- By Sales Channel
- By Country
- Market Attractiveness Analysis
- By Country
- By Tester Type
- By Portability
- By Application
- By End Use
- By Sales Channel
- Key Takeaways
- Western Europe Market Analysis and Forecast, By Country
- Historical Market Size Value (USD Million) & Volume (Unit) Trend Analysis By Market Taxonomy, 2021 to 2025
- Market Size Value (USD Million) & Volume (Unit) Forecast By Market Taxonomy, 2026 to 2036
- By Country
- Germany
- UK
- Italy
- Spain
- France
- Nordic
- BENELUX
- Rest of Western Europe
- By Tester Type
- By Portability
- By Application
- By End Use
- By Sales Channel
- By Country
- Market Attractiveness Analysis
- By Country
- By Tester Type
- By Portability
- By Application
- By End Use
- By Sales Channel
- Key Takeaways
- Eastern Europe Market Analysis and Forecast, By Country
- Historical Market Size Value (USD Million) & Volume (Unit) Trend Analysis By Market Taxonomy, 2021 to 2025
- Market Size Value (USD Million) & Volume (Unit) Forecast By Market Taxonomy, 2026 to 2036
- By Country
- Russia
- Poland
- Hungary
- Balkan & Baltic
- Rest of Eastern Europe
- By Tester Type
- By Portability
- By Application
- By End Use
- By Sales Channel
- By Country
- Market Attractiveness Analysis
- By Country
- By Tester Type
- By Portability
- By Application
- By End Use
- By Sales Channel
- Key Takeaways
- East Asia Market Analysis and Forecast, By Country
- Historical Market Size Value (USD Million) & Volume (Unit) Trend Analysis By Market Taxonomy, 2021 to 2025
- Market Size Value (USD Million) & Volume (Unit) Forecast By Market Taxonomy, 2026 to 2036
- By Country
- China
- Japan
- South Korea
- By Tester Type
- By Portability
- By Application
- By End Use
- By Sales Channel
- By Country
- Market Attractiveness Analysis
- By Country
- By Tester Type
- By Portability
- By Application
- By End Use
- By Sales Channel
- Key Takeaways
- South Asia and Pacific Market Analysis and Forecast, By Country
- Historical Market Size Value (USD Million) & Volume (Unit) Trend Analysis By Market Taxonomy, 2021 to 2025
- Market Size Value (USD Million) & Volume (Unit) Forecast By Market Taxonomy, 2026 to 2036
- By Country
- India
- ASEAN
- Australia & New Zealand
- Rest of South Asia and Pacific
- By Tester Type
- By Portability
- By Application
- By End Use
- By Sales Channel
- By Country
- Market Attractiveness Analysis
- By Country
- By Tester Type
- By Portability
- By Application
- By End Use
- By Sales Channel
- Key Takeaways
- Middle East & Africa Market Analysis and Forecast, By Country
- Historical Market Size Value (USD Million) & Volume (Unit) Trend Analysis By Market Taxonomy, 2021 to 2025
- Market Size Value (USD Million) & Volume (Unit) Forecast By Market Taxonomy, 2026 to 2036
- By Country
- Kingdom of Saudi Arabia
- Other GCC Countries
- Türkiye
- South Africa
- Other African Union
- Rest of Middle East & Africa
- By Tester Type
- By Portability
- By Application
- By End Use
- By Sales Channel
- By Country
- Market Attractiveness Analysis
- By Country
- By Tester Type
- By Portability
- By Application
- By End Use
- By Sales Channel
- Key Takeaways
- Key Countries Market Analysis
- USA
- Pricing Analysis
- Market Share Analysis, 2025
- By Tester Type
- By Portability
- By Application
- By End Use
- By Sales Channel
- Canada
- Pricing Analysis
- Market Share Analysis, 2025
- By Tester Type
- By Portability
- By Application
- By End Use
- By Sales Channel
- Mexico
- Pricing Analysis
- Market Share Analysis, 2025
- By Tester Type
- By Portability
- By Application
- By End Use
- By Sales Channel
- Brazil
- Pricing Analysis
- Market Share Analysis, 2025
- By Tester Type
- By Portability
- By Application
- By End Use
- By Sales Channel
- Chile
- Pricing Analysis
- Market Share Analysis, 2025
- By Tester Type
- By Portability
- By Application
- By End Use
- By Sales Channel
- Germany
- Pricing Analysis
- Market Share Analysis, 2025
- By Tester Type
- By Portability
- By Application
- By End Use
- By Sales Channel
- UK
- Pricing Analysis
- Market Share Analysis, 2025
- By Tester Type
- By Portability
- By Application
- By End Use
- By Sales Channel
- Italy
- Pricing Analysis
- Market Share Analysis, 2025
- By Tester Type
- By Portability
- By Application
- By End Use
- By Sales Channel
- Spain
- Pricing Analysis
- Market Share Analysis, 2025
- By Tester Type
- By Portability
- By Application
- By End Use
- By Sales Channel
- France
- Pricing Analysis
- Market Share Analysis, 2025
- By Tester Type
- By Portability
- By Application
- By End Use
- By Sales Channel
- India
- Pricing Analysis
- Market Share Analysis, 2025
- By Tester Type
- By Portability
- By Application
- By End Use
- By Sales Channel
- ASEAN
- Pricing Analysis
- Market Share Analysis, 2025
- By Tester Type
- By Portability
- By Application
- By End Use
- By Sales Channel
- Australia & New Zealand
- Pricing Analysis
- Market Share Analysis, 2025
- By Tester Type
- By Portability
- By Application
- By End Use
- By Sales Channel
- China
- Pricing Analysis
- Market Share Analysis, 2025
- By Tester Type
- By Portability
- By Application
- By End Use
- By Sales Channel
- Japan
- Pricing Analysis
- Market Share Analysis, 2025
- By Tester Type
- By Portability
- By Application
- By End Use
- By Sales Channel
- South Korea
- Pricing Analysis
- Market Share Analysis, 2025
- By Tester Type
- By Portability
- By Application
- By End Use
- By Sales Channel
- Russia
- Pricing Analysis
- Market Share Analysis, 2025
- By Tester Type
- By Portability
- By Application
- By End Use
- By Sales Channel
- Poland
- Pricing Analysis
- Market Share Analysis, 2025
- By Tester Type
- By Portability
- By Application
- By End Use
- By Sales Channel
- Hungary
- Pricing Analysis
- Market Share Analysis, 2025
- By Tester Type
- By Portability
- By Application
- By End Use
- By Sales Channel
- Kingdom of Saudi Arabia
- Pricing Analysis
- Market Share Analysis, 2025
- By Tester Type
- By Portability
- By Application
- By End Use
- By Sales Channel
- Türkiye
- Pricing Analysis
- Market Share Analysis, 2025
- By Tester Type
- By Portability
- By Application
- By End Use
- By Sales Channel
- South Africa
- Pricing Analysis
- Market Share Analysis, 2025
- By Tester Type
- By Portability
- By Application
- By End Use
- By Sales Channel
- USA
- Market Structure Analysis
- Competition Dashboard
- Competition Benchmarking
- Market Share Analysis of Top Players
- By Region
- By Tester Type
- By Portability
- By Application
- By End Use
- By Sales Channel
- Emerging Startups
- Innovation Benchmarking
- Competition Analysis
- Competition Deep Dive
- Megger
- Overview
- Product Portfolio
- Profitability by Market Segments (Product/Region/Sales Channel)
- Sales Footprint
- Strategy Overview
- Marketing Strategy
- Product Strategy
- Channel Strategy
- BAUR
- Koehler Instrument
- Doble Engineering
- Morgan Schaffer
- Vaisala
- Megger
- Case Studies
- Success Stories
- Recent Developments
- Competition Deep Dive
- Assumptions & Acronyms Used


