
- Market Size (2026)
- USD 334.1 Mn
- Forecast (2036)
- USD 701.5 Mn
- CAGR (2026 to 2036)
- 7.7%
How big is Trauma Recovery Nutrition Market in 2026?
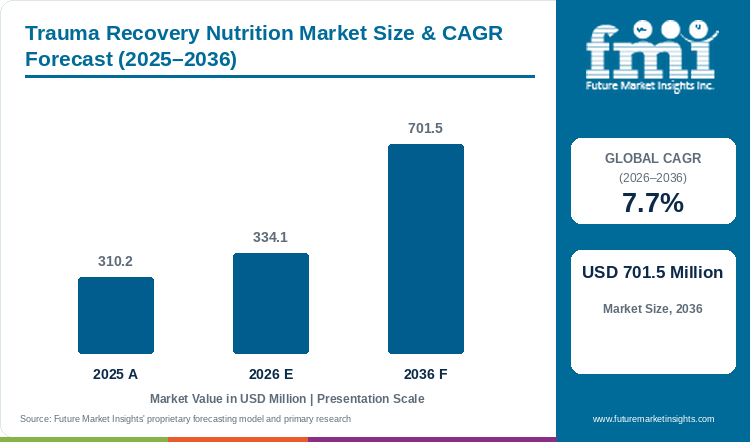
The trauma recovery nutrition market is valued at USD 334.1 Million in 2026 and is projected to reach USD 701.5 Million by 2036, growing at a 7.7% CAGR, as per FMI synthetic survey.
Demand for trauma recovery nutrition is projected to expand at 7.7% CAGR between 2026 and 2036. Industry value grows from USD 310.2 million in 2025 to USD 334.1 million in 2026 and is projected to reach USD 701.5 million by 2036. Enteral tube feeds, oral supplements, powders and protein modules are used across acute care and rehabilitation. In March 2025, Medtrition launched ProSource Cup with 20 grams of protein in a two-ounce serving. The product works orally as well as through a feeding tube, due to which it supports change in feeding route. Higher-density nutrition also allows clinicians to increase intake without adding similar feeding volume. FMI finds that documentation remains the final requirement as each product has to match the recorded route and medical need.
Regional demand is likely to be varied as South Korea is estimated to grow at 8.0% CAGR, whereas the UK is projected to expand at 7.5% CAGR through 2036. South Korea growth is attributed to current recommendations covering energy, protein, feeding tolerance and trauma care. In July 2026, the Korean Society for Parenteral and Enteral Nutrition published 59 recommendations for critically ill adults. NHS England reports that its trauma registry holds more than one million injured-patient records. South Korea market benefits from common feeding recommendations, while the UK market has organized trauma pathways from acute treatment into rehabilitation. However, formulary access and proper documentation may affect the continued product supply in both countries.
Key Takeaways of Trauma Recovery Nutrition Market
- Earlier enteral feeding and concentrated protein delivery support demand after severe injury limits normal oral intake.
- Based on formulation, high-protein high-energy is projected to account for 38.3% in 2026, driven by concentrated nutrient delivery.
- By injury type, orthopedic and fracture is estimated to hold 39.9% in 2026, supported by extended rehabilitation needs.
- In 2026, enteral tube feeds are expected to lead product form with 48.5% share, owing to measurable clinical delivery.
- South Korea is forecast at 8.0% CAGR, while the UK is projected at 7.5% CAGR through 2036 under distinct protocol systems.
- Notable companies in the Trauma Recovery Nutrition Market include Abbott, Nestle Health Science, Danone Nutricia, Fresenius Kabi, Baxter, B. Braun, Victus, and Medtrition.
Analyst Perspective
“Demand is moving towards nutrition selected immediately after stable feeding begins. Products continuing into rehabilitation will create the strongest adoption opportunity.”
- Nandini Roy Choudhury, Principal Consultant, Future Market Insights
How is the Trauma Recovery Nutrition Market segmented?
Trauma Recovery Nutrition Market is segmented by five primary commercial axes and region: formulation, injury type, product form, end user, sales channel, and region. In 2026, high-protein high-energy is projected at 38.3%, orthopedic and fracture at 39.9%, and enteral tube feeds at 48.5% of their respective parent categories.
Formulation covers high-protein high-energy, immunonutrition, glutamine & arginine modules, micronutrient repletion, and others.
Injury type covers orthopedic / fracture, traumatic brain injury, polytrauma, and others.
Product form covers enteral tube feeds, RTD ONS, powders, and others.
End user covers trauma centers, hospitals, rehab & homecare, and others.
Sales channel covers hospital pharmacy, retail pharmacy, online, institutional tender, and others.
Why does high-protein high-energy account for notable formulation demand?
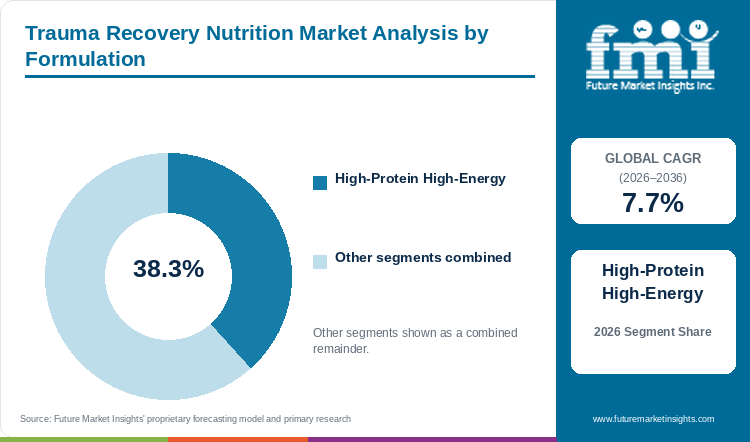
Based on formulation, high-protein high-energy is projected to account for 38.3% in 2026, driven by concentrated nutrient delivery.
High-protein high-energy formulas provide concentrated calories and protein when severe injury reduces normal food intake. A smaller feeding quantity can provide higher nutrition, due to which these formulas are frequently used where volume is restricted.
- High-protein high-energy is projected to account for 38.3% of formulation demand in 2026 and is likely to retain higher preference among trauma nutrition teams.
- In October 2025, Nutricia launched Fortimel PlantBased Protein in savory flavors, adding to its existing sweet and fruity options. Availability of varied flavors and low-volume nutrition supports its use across hospital and continued recovery.
What supports orthopedic and fracture as a preferred injury category?
By injury type, orthopedic and fracture is estimated to hold 39.9% in 2026, supported by longer rehabilitation needs.
Orthopedic and fracture recovery generally moves through surgery, tissue repair, mobility training and rehabilitation. Nutrition requirement continues after hospital treatment as many patients recover over a longer period. Trauma nutrition research published in May 2025 links metabolic stress with raised protein and energy requirement during recovery. Apart from that, normal food may remain lower than recovery requirement during rehabilitation. Orthopedic and fracture is estimated to hold 39.9% of injury-type demand in 2026, owing to longer nutrition use across recovery period.
- Orthopedic and fracture holds 39.9% because the recovery pathway can require nutrition support in several care settings.
- Current trauma nutrition research links metabolic stress with raised protein and energy requirements during recovery.
How are enteral tube feeds gaining use in product form?
In 2026, enteral tube feeds are expected to lead product form with 48.5% share, owing to measurable clinical delivery.
Enteral tube feeds are used when swallowing is unsafe or oral intake is not sufficient after traumatic injury. The feed can be given in measured quantity and delivered volume can also be recorded by care teams. Owing to these factors, enteral tube feeds are expected to account for 48.5% of product-form demand in 2026.
- Enteral tube feeds represent 48.5% share because they provide a measurable base regimen during acute care.
- Japan’s 2025 guideline strongly recommends early enteral nutrition within 48 hours for critically ill adults.
Why are trauma centers selected within the end-user category?
Trauma centers are forecast to represent 45.7% of end-user demand in 2026, supported by concentrated feeding-route decisions.
Trauma centers manage patients during the early and more critical stage of injury recovery. Feeding route, complete formula and additional protein are selected during this stage according to swallowing, gut function and injury condition. NHS England states that its trauma registry contains more than one million patient records. Presence of trauma surgeons, dietitians and critical-care staff supports repeated nutrition review.
- Trauma centers hold 45.7% because specialist teams control early nutrition routes and treatment review.
- NHS England’s National Major Trauma Registry currently covers more than one million injured-patient records.
Which market conditions keep hospital pharmacy relevant in sales channels?
Hospital pharmacy is projected to hold 40.6% of sales-channel demand in 2026, supported by formulary and ordering control.
Hospital pharmacies are involved in formulary selection, medical ordering and recurring supply of specialized nutrition products. Complete feeds and protein products used in trauma care generally passes through hospital ordering and medical review. In February 2026, CMS reported 23.8% improper payment rate for enteral nutrition and insufficient documentation accounted for 48.8% of these payments. This keeps product selection connected with formulary and medical-necessity records. Hospital pharmacy is projected to hold 40.6% of sales-channel demand in 2026.
- Hospital pharmacy holds 40.6% because clinical nutrition is commonly purchased through hospital controls.
- CMS lists documentation and medical necessity among the main causes of improper enteral nutrition payments.
What are the drivers, restraints, and opportunities in the Trauma Recovery Nutrition Market?
In the trauma recovery nutrition market, the key driver is earlier feeding, the key restraint is documentation, and the key opportunity is continued nutrition after discharge.
- Driver: Earlier enteral feeding expands product use once patients are stable enough for nutrition.
- Restraint: Documentation and evidence thresholds can limit specialty formulas or interrupt reimbursed supply.
- Opportunity: Rehabilitation and homecare pathways can extend measured protein and energy support after discharge.
Earlier Feeding Moves the Buying Point
Earlier enteral feeding is becoming a common part of trauma care after resuscitation is complete. Complete formulas are selected first, while protein products are added where the base feed does not meet the higher requirement. In March 2025, Froedtert and the Medical College of Wisconsin directed nutrition support within 24 to 48 hours after resuscitation. The guideline prefers enteral nutrition when gastrointestinal route is functioning. Movement of feeding decision closer to admission stage is boosting the trauma recovery nutrition demand.
Proof Requirements Limit Specialty Use
High documentation requirements are one of the primary factor limiting recurring enteral nutrition supply. Products used after discharge requires medical-necessity records, refill information and clear reason for specialty formula or pump use. CMS allows payment for not more than one month supply at one time under its stated requirement. Missing records can delay approval even where the patient is already using the product. This requirement may hamper the growth of specialized medical foods outside hospital.
Post-Acute Care Extends Product Use
Post-acute nutrition is opening new application area as injured patients move from hospital to rehabilitation and homecare. Many patients can eat partly but still require oral supplements or enteral products to complete protein and energy intake. In September 2026, Medical Nutrition International Industry awarded its grant to the BRIDGE-CRIT project connecting hospital and home nutrition care. Better handover can reduce the break between inpatient feeding and continued recovery nutrition. Nutrition after discharge is creating new avenues for suppliers offering products suitable for more than one care setting.
Which country CAGRs are profiled in the Trauma Recovery Nutrition Market?
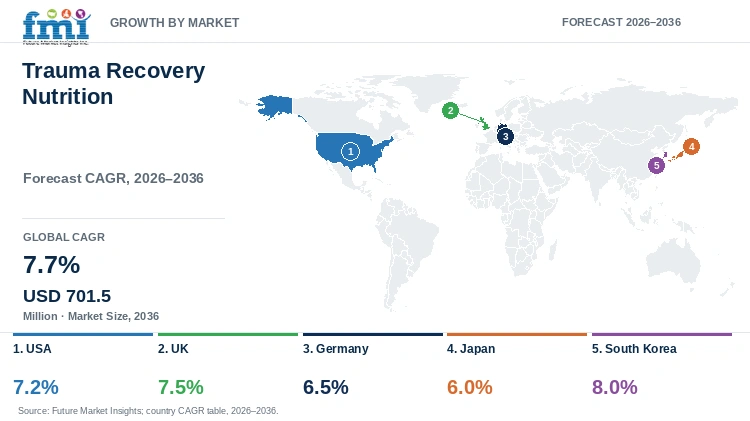
| Country | CAGR |
|---|---|
| USA | 7.2% |
| UK | 7.5% |
| Germany | 6.5% |
| Japan | 6.0% |
| South Korea | 8.0% |
How do country-level CAGRs compare in the trauma recovery nutrition market?
Trauma recovery nutrition demand differs from country to country owing to hospital nutrition protocols, reimbursement and availability of clinical nutrition products. Countries having early feeding guidance and organized trauma networks are expected to witness higher adoption. However, documentation, tolerance and route suitability may limiting the continued product use after discharge.
The USA trauma recovery nutrition market is supported by hospital formularies and covered home enteral supply, whereas the UK market benefits from coordinated trauma pathways. Germany is witnessing expansion of hospital and home nutrition products. Japan and South Korea are following current critical-care nutrition recommendations. Presence of different clinical and reimbursement systems is resulting in different country growth rates through 2036.
- USA demand moves through hospital formularies and documented Medicare coverage for recurring enteral supply.
- UK demand benefits from coordinated trauma pathways and a national registry that measures acute-care activity.
- Germany combines hospital nutrition with enteral products designed for home and outpatient use.
- Japan uses current critical-care guidance that supports early enteral feeding and higher protein provision.
- South Korea applies recent critical-care guidance to route selection and specialized nutrient decisions.
Full report country CAGRs cover: North America; Latin America; Western Europe; Eastern Europe; East Asia; South Asia and Pacific; Middle East and Africa.
Country-wise Analysis
- Trauma recovery nutrition demand in the USA is forecast to rise at 7.2% CAGR through 2036. Hospital formularies and covered home enteral supply are supporting the use of complete feeds beyond acute treatment. In February 2026, CMS reported 23.8% improper payment rate for enteral nutrition, of which insufficient documentation accounted for 48.8% during the reporting period. Enteral supply remains connected with documented ordering and recurring medical-equipment procedures. Products having clear administration instruction are expected to face higher preference in the USA market.
- The UK trauma recovery nutrition market is projected to expand at 7.5% CAGR between 2026 and 2036. NHS England operates a major trauma registry holding more than one million injured-patient records. Organized pathways allows nutrition assessment to continue from major trauma center into rehabilitation and community care. Wider screening supports earlier identification of patients who are not meeting nutrition requirement. However, local formulary and public procurement controls may limit the availability of every specialty product.
- Germany trauma recovery nutrition demand is predicted to advance at 6.5% CAGR through 2036. The country has presence of hospital nutrition suppliers along with products intended for home and outpatient enteral use. In September 2026, Fresenius launched NutriChef in Germany and other European markets. The product contains ingredients from 21 plants and more than 75% real-food ingredients. Availability of meal-inspired enteral formats is likely to improve product choice in Germany.
- Japan trauma recovery nutrition market is estimated to expand at 6.0% CAGR through 2036. Early feeding guidance has increased attention towards complete enteral formulas during the first stage of critical care. In September 2025, the Japanese Society of Intensive Care Medicine published guideline with 37 clinical questions and 24 recommendations. The guideline strongly recommends enteral nutrition within 48 hours for critically ill adults. Increasing use of early feeding along with protein modules will influence the demand across Japanese hospitals.
- South Korea is estimated to post 8.0% CAGR through 2036, attributed to detailed national guidance for intensive-care nutrition. Hospitals are receiving common direction for energy assessment, protein choice, feeding intolerance and trauma nutrition. In July 2026, the Korean Society for Parenteral and Enteral Nutrition published 59 recommendations based on 24 clinical questions. Use of current recommendations can reduce variation between specialist teams. This is likely to propel the demand for defined enteral and modular nutrition products in South Korea.
Who are the notable companies in the Trauma Recovery Nutrition Market?
Notable companies include Abbott, Nestle Health Science, Danone Nutricia, Fresenius Kabi, Baxter, B. Braun, Victus, and Medtrition.
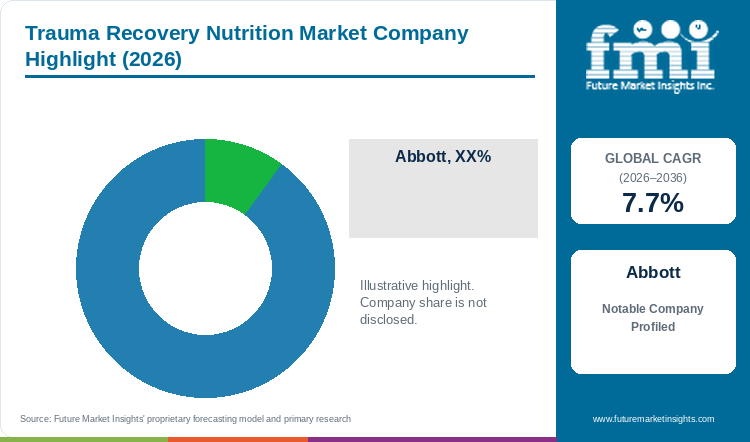
Trauma recovery nutrition market is moderately fragmented with presence of broad medical nutrition companies and focused recovery nutrition suppliers. Abbott, Nestle Health Science, Danone Nutricia and Fresenius Kabi offers complete feeds and oral products used across hospital and home settings. Baxter and B. Braun supports clinically administered nutrition and delivery systems. Victus and Medtrition, on the other side, provides wound-support and concentrated protein products. Companies are expanding product formats and regional supply in order to cater different feeding routes during recovery.
- Broad medical nutrition platforms: Abbott, Nestle Health Science, Danone Nutricia, and Fresenius Kabi provide complete feeds and oral formats.
- Acute-care systems: Baxter and B. Braun support clinically administered nutrition and hospital delivery infrastructure.
- Focused recovery specialists: Victus and Medtrition provide modular protein or wound-support products for defined nutrition gaps.
Competitive Benchmarking: Trauma Recovery Nutrition Market
| Company | Recovery-aligned portfolio | Enteral and oral breadth | Institutional support | Geographic reach |
|---|---|---|---|---|
| Abbott | High | High | High | High |
| Nestle Health Science | High | High | High | High |
| Danone Nutricia | Medium | High | High | High |
| Fresenius Kabi | High | High | High | High |
| Baxter | Medium | Low | High | High |
| B. Braun | Medium | High | High | High |
| Victus | High | Medium | Medium | Medium |
| Medtrition | High | Medium | High | High |
High indicates broad documented breadth, depth, current activity, or reach. Medium indicates a credible but narrower role. Low indicates a limited documented route. Ratings do not represent product quality or market share.
Key Developments in the Trauma Recovery Nutrition Market
- In September 2026, Fresenius launched NutriChef in several European markets. The product adds a real-food-based high-energy and high-protein enteral format.
- In October 2025, Danone Nutricia launched savory Fortimel PlantBased Protein formats. The product broadens high-protein oral nutrition choices for medically related malnutrition.
- In March 2025, Medtrition launched ProSource Cup and ProSource Cup Plant. Each product provides 20 grams of complete protein in a low-volume serving.
Key Players in the Trauma Recovery Nutrition Market
Broad Hospital Medical Nutrition Platforms
- Abbott
- Nestle Health Science
- Danone Nutricia
- Fresenius Kabi
Acute-Care Nutrition and Delivery Systems
- Baxter
- B. Braun
Modular Protein and Recovery Specialists
- Victus
- Medtrition
What does the Trauma Recovery Nutrition Market report cover?
The Future Market Insights report covers specialized nutrition products used during recovery from traumatic injury across five commercial axes and seven regions.
| Coverage field | Report scope |
|---|---|
| Market breakdown | Formulation; Injury Type; Product Form; End User; Sales Channel; Region |
| Quantitative units | USD million |
| Market definition | Revenue includes specialized clinical nutrition supporting energy and protein needs during traumatic-injury recovery. Ordinary foods, general wellness supplements, separately sold feeding hardware, and care services are excluded. |
| Regions covered | North America; Latin America; Western Europe; Eastern Europe; East Asia; South Asia and Pacific; Middle East and Africa |
| Countries covered | USA, UK, Germany, Japan, South Korea, and more than twenty-five additional countries |
| Key companies profiled | Abbott; Nestle Health Science; Danone Nutricia; Fresenius Kabi; Baxter; B. Braun; Victus; Medtrition |
| Forecast period | 2026 to 2036 |
| Approach | Secondary research, modeled market sizing, forecast analysis, triangulation, and validation. |
Trauma Recovery Nutrition Market - Research Methodology
| Method | Approach |
|---|---|
| Primary Research | The research study includes primary interviews with manufacturers, distributors, hospitals, trauma centers, end users, procurement teams and industry experts. Interviews covers product selection, pricing, adoption barriers, approval requirement and product support. Information from interviews is used for understanding how trauma nutrition moves across different care settings. |
| Desk Research | Desk research includes government publications, regulatory information, industry associations, clinical literature, company product pages and official announcements. Sources are checked according to publication date, market relevance and country coverage. Information outside the defined trauma recovery nutrition market is not included in the study. |
| Market Sizing and Forecasting | Market sizing combines historical market value, segment structure, product pricing, adoption level, company participation and country demand. Forecast considers clinical practice, reimbursement, product availability and purchasing cycle from 2026 to 2036. Changes in feeding route and continuation after discharge are also considered while preparing market estimates. |
| Data Validation | Market estimates are validated through public data, company developments, industry activity and primary interviews. Products outside market definition are removed in order to avoid overlapping revenue. Final values are checked with segment structure and country demand before preparing forecast. |
Trauma Recovery Nutrition Market by Segments
Trauma Recovery Nutrition Market segmented by Formulation:
- High-Protein High-Energy
- Immunonutrition
- Glutamine & Arginine Modules
- Micronutrient Repletion
- Others
Trauma Recovery Nutrition Market segmented by Injury Type:
- Orthopedic / Fracture
- Traumatic Brain Injury
- Polytrauma
- Others
Trauma Recovery Nutrition Market segmented by Product Form:
- Enteral Tube Feeds
- RTD ONS
- Powders
- Others
Trauma Recovery Nutrition Market segmented by End User:
- Trauma Centers
- Hospitals
- Rehab & Homecare
- Others
Trauma Recovery Nutrition Market segmented by Sales Channel:
- Hospital Pharmacy
- Retail Pharmacy
- Online
- Institutional Tender
- Others
Trauma Recovery Nutrition Market by Region
- North America
- United States
- Canada
- Latin America
- Brazil
- Mexico
- Argentina
- Chile
- Western Europe
- Germany
- France
- United Kingdom
- Italy
- Spain
- Benelux
- Nordics
- Eastern Europe
- Poland
- Czech Republic
- Romania
- Hungary
- East Asia
- China
- Japan
- South Korea
- South Asia and Pacific
- India
- ASEAN
- Australia and New Zealand
- Middle East and Africa
- GCC Countries
- South Africa
- Türkiye
- Israel
Research Sources and Bibliography
- [1] Mörkl, S., et al. (2025, May 12). Nutritional support in trauma and critically ill patients. Wiener Medizinische Wochenschrift.
- [2] Centers for Medicare & Medicaid Services. (2026, February 11). Enteral nutrition: Medicare provider compliance tips.
- [3] Medtrition, Inc. (2025, March 25). ProSource Cup press release.
- [4] Japanese Society of Intensive Care Medicine. (2025, September 30). The Japanese Critical Care Nutrition Guideline 2024.
- [5] NHS England. (2026). National major trauma registry. Retrieved September 30, 2026.
- [6] Froedtert & the Medical College of Wisconsin. (2025, March 22). Trauma patient nutritional therapy guideline.
- [7] Centers for Medicare & Medicaid Services. (2026). LCD: Enteral nutrition (L38955).
- [8] Medical Nutrition International Industry. (2026, September 8). Belgian BRIDGE-CRIT project wins the 2026 MNI Grant.
- [9] Fresenius SE & Co. KGaA. (2026, September 7). Fresenius expands Medical Nutrition Portfolio with new real-food-based enteral nutrition concept.
- [10] Korean Society for Parenteral and Enteral Nutrition. (2026, July 31). Nutritional support for critically ill patients, part II. Annals of Clinical Nutrition and Metabolism, 18(2), 65 to 116.
- [11] Nutricia. (2025, October 1). Nutricia’s new savory plant-based medical nutrition proven to improve patient adherence.
This bibliography is provided for reader reference. The full report contains the complete reference list and detailed citations.
This Report Answers
- What is the Trauma Recovery Nutrition Market size in 2026?
- What value is forecast for the market in 2036?
- Which formulation holds a notable market share in 2026?
- Which product form holds a notable market share in 2026?
- Which countries have notable market growth outlooks through 2036?
- Which companies are notable in trauma recovery nutrition today?
Table of Content
- Key Takeaways
- Market Size and CAGR
- Top Growth Driver
- Fastest Growing Segment
- Leading Region
- Key Companies
- Emerging Opportunities
- Executive Summary
- Global Market Outlook
- Demand-side Trends
- Supply-side Trends
- Technology Roadmap Analysis
- Analysis and Recommendations
- Analyst Perspective (What is happening? Why now? What should investors know?)
- Key Questions Answered
- How large is the market?
- What is the CAGR?
- What are key trends?
- Which region dominates?
- Who are the leaders?
Read More...
- Market Overview
- Market Coverage / Taxonomy
- Market Definition / Scope / Limitations
- Research Methodology
- Chapter Orientation
- Analytical Lens and Working Hypotheses
- Market Structure, Signals, and Trend Drivers
- Benchmarking and Cross-market Comparability
- Market Sizing, Forecasting, and Opportunity Mapping
- Research Design and Evidence Framework
- Desk Research Programme (Secondary Evidence)
- Expert Input and Fieldwork (Primary Evidence)
- Tooling, Models, and Reference Databases
- Data Engineering and Model Build
- Quality Assurance and Audit Trail
- Market Background
- Market Dynamics (Drivers, Restraints, Opportunity, Trends)
- Scenario Forecast (Optimistic, Likely, Conservative)
- Impact Analysis
- AI Impact
- Sustainability Impact
- Regulatory Impact
- Technology Impact
- Consumer / Buyer Analysis
- Purchase Drivers
- Adoption Barriers
- Buyer Journey
- Opportunity Map Analysis
- Product Life Cycle Analysis
- Supply Chain Analysis
- Investment Feasibility Matrix
- Value Chain Analysis
- PESTLE and Porter's Analysis
- Regulatory Landscape
- Regional Parent Market Outlook
- Production and Consumption Statistics
- Import and Export Statistics
- Global Market Analysis and Forecast, 2021 to 2036
- Historical Market Size Value (USD Million) Analysis, 2021 to 2025
- Current and Future Market Size Value (USD Million) Projections, 2026 to 2036
- Y-o-Y Growth Trend Analysis
- Absolute $ Opportunity Analysis
- Global Market Pricing Analysis, 2021 to 2036
- Global Market Analysis and Forecast, By Formulation, 2021 to 2036
- Introduction / Key Findings
- Historical Market Size Value (USD Million) Analysis By Formulation, 2021 to 2025
- Current and Future Market Size Value (USD Million) Analysis and Forecast By Formulation, 2026 to 2036
- High-Protein High-Energy
- Immunonutrition
- Glutamine & Arginine Modules
- Micronutrient Repletion
- Others
- Y-o-Y Growth Trend Analysis By Formulation, 2021 to 2025
- Absolute $ Opportunity Analysis By Formulation, 2026 to 2036
- Global Market Analysis and Forecast, By Injury Type, 2021 to 2036
- Introduction / Key Findings
- Historical Market Size Value (USD Million) Analysis By Injury Type, 2021 to 2025
- Current and Future Market Size Value (USD Million) Analysis and Forecast By Injury Type, 2026 to 2036
- Orthopedic / Fracture
- Traumatic Brain Injury
- Polytrauma
- Others
- Y-o-Y Growth Trend Analysis By Injury Type, 2021 to 2025
- Absolute $ Opportunity Analysis By Injury Type, 2026 to 2036
- Global Market Analysis and Forecast, By Product Form, 2021 to 2036
- Introduction / Key Findings
- Historical Market Size Value (USD Million) Analysis By Product Form, 2021 to 2025
- Current and Future Market Size Value (USD Million) Analysis and Forecast By Product Form, 2026 to 2036
- Enteral Tube Feeds
- RTD ONS
- Powders
- Others
- Y-o-Y Growth Trend Analysis By Product Form, 2021 to 2025
- Absolute $ Opportunity Analysis By Product Form, 2026 to 2036
- Global Market Analysis and Forecast, By End User, 2021 to 2036
- Introduction / Key Findings
- Historical Market Size Value (USD Million) Analysis By End User, 2021 to 2025
- Current and Future Market Size Value (USD Million) Analysis and Forecast By End User, 2026 to 2036
- Trauma Centers
- Hospitals
- Rehab & Homecare
- Others
- Y-o-Y Growth Trend Analysis By End User, 2021 to 2025
- Absolute $ Opportunity Analysis By End User, 2026 to 2036
- Global Market Analysis and Forecast, By Sales Channel, 2021 to 2036
- Introduction / Key Findings
- Historical Market Size Value (USD Million) Analysis By Sales Channel, 2021 to 2025
- Current and Future Market Size Value (USD Million) Analysis and Forecast By Sales Channel, 2026 to 2036
- Hospital Pharmacy
- Retail Pharmacy
- Online
- Institutional Tender
- Others
- Y-o-Y Growth Trend Analysis By Sales Channel, 2021 to 2025
- Absolute $ Opportunity Analysis By Sales Channel, 2026 to 2036
- Global Market Analysis and Forecast, By Region, 2021 to 2036
- Introduction
- Historical Market Size Value (USD Million) Analysis By Region, 2021 to 2025
- Current Market Size Value (USD Million) Analysis and Forecast By Region, 2026 to 2036
- North America
- Latin America
- Western Europe
- Eastern Europe
- East Asia
- South Asia and Pacific
- Middle East and Africa
- Market Attractiveness Analysis By Region
- North America Market Analysis and Forecast, By Country, 2021 to 2036
- Historical Market Size Value (USD Million) Trend Analysis By Market Taxonomy, 2021 to 2025
- Market Size Value (USD Million) Forecast By Market Taxonomy, 2026 to 2036
- By Country
- United States
- Canada
- By Formulation
- By Injury Type
- By Product Form
- By End User
- By Sales Channel
- By Country
- Market Attractiveness Analysis
- By Country
- By Formulation
- By Injury Type
- By Product Form
- By End User
- By Sales Channel
- Key Takeaways
- Latin America Market Analysis and Forecast, By Country
- Historical Market Size Value (USD Million) Trend Analysis By Market Taxonomy, 2021 to 2025
- Market Size Value (USD Million) Forecast By Market Taxonomy, 2026 to 2036
- By Country
- Brazil
- Mexico
- Argentina
- Chile
- By Formulation
- By Injury Type
- By Product Form
- By End User
- By Sales Channel
- By Country
- Market Attractiveness Analysis
- By Country
- By Formulation
- By Injury Type
- By Product Form
- By End User
- By Sales Channel
- Key Takeaways
- Western Europe Market Analysis and Forecast, By Country
- Historical Market Size Value (USD Million) Trend Analysis By Market Taxonomy, 2021 to 2025
- Market Size Value (USD Million) Forecast By Market Taxonomy, 2026 to 2036
- By Country
- Germany
- France
- United Kingdom
- Italy
- Spain
- Benelux
- Nordics
- By Formulation
- By Injury Type
- By Product Form
- By End User
- By Sales Channel
- By Country
- Market Attractiveness Analysis
- By Country
- By Formulation
- By Injury Type
- By Product Form
- By End User
- By Sales Channel
- Key Takeaways
- Eastern Europe Market Analysis and Forecast, By Country
- Historical Market Size Value (USD Million) Trend Analysis By Market Taxonomy, 2021 to 2025
- Market Size Value (USD Million) Forecast By Market Taxonomy, 2026 to 2036
- By Country
- Poland
- Czech Republic
- Romania
- Hungary
- By Formulation
- By Injury Type
- By Product Form
- By End User
- By Sales Channel
- By Country
- Market Attractiveness Analysis
- By Country
- By Formulation
- By Injury Type
- By Product Form
- By End User
- By Sales Channel
- Key Takeaways
- East Asia Market Analysis and Forecast, By Country
- Historical Market Size Value (USD Million) Trend Analysis By Market Taxonomy, 2021 to 2025
- Market Size Value (USD Million) Forecast By Market Taxonomy, 2026 to 2036
- By Country
- China
- Japan
- South Korea
- By Formulation
- By Injury Type
- By Product Form
- By End User
- By Sales Channel
- By Country
- Market Attractiveness Analysis
- By Country
- By Formulation
- By Injury Type
- By Product Form
- By End User
- By Sales Channel
- Key Takeaways
- South Asia and Pacific Market Analysis and Forecast, By Country
- Historical Market Size Value (USD Million) Trend Analysis By Market Taxonomy, 2021 to 2025
- Market Size Value (USD Million) Forecast By Market Taxonomy, 2026 to 2036
- By Country
- India
- ASEAN
- Australia and New Zealand
- By Formulation
- By Injury Type
- By Product Form
- By End User
- By Sales Channel
- By Country
- Market Attractiveness Analysis
- By Country
- By Formulation
- By Injury Type
- By Product Form
- By End User
- By Sales Channel
- Key Takeaways
- Middle East and Africa Market Analysis and Forecast, By Country
- Historical Market Size Value (USD Million) Trend Analysis By Market Taxonomy, 2021 to 2025
- Market Size Value (USD Million) Forecast By Market Taxonomy, 2026 to 2036
- By Country
- GCC Countries
- South Africa
- Türkiye
- Israel
- By Formulation
- By Injury Type
- By Product Form
- By End User
- By Sales Channel
- By Country
- Market Attractiveness Analysis
- By Country
- By Formulation
- By Injury Type
- By Product Form
- By End User
- By Sales Channel
- Key Takeaways
- Key Countries Market Analysis
- United States
- Pricing Analysis
- Market Share Analysis, 2025
- By Formulation
- By Injury Type
- By Product Form
- By End User
- By Sales Channel
- Canada
- Pricing Analysis
- Market Share Analysis, 2025
- By Formulation
- By Injury Type
- By Product Form
- By End User
- By Sales Channel
- Mexico
- Pricing Analysis
- Market Share Analysis, 2025
- By Formulation
- By Injury Type
- By Product Form
- By End User
- By Sales Channel
- Brazil
- Pricing Analysis
- Market Share Analysis, 2025
- By Formulation
- By Injury Type
- By Product Form
- By End User
- By Sales Channel
- Chile
- Pricing Analysis
- Market Share Analysis, 2025
- By Formulation
- By Injury Type
- By Product Form
- By End User
- By Sales Channel
- Germany
- Pricing Analysis
- Market Share Analysis, 2025
- By Formulation
- By Injury Type
- By Product Form
- By End User
- By Sales Channel
- United Kingdom
- Pricing Analysis
- Market Share Analysis, 2025
- By Formulation
- By Injury Type
- By Product Form
- By End User
- By Sales Channel
- Italy
- Pricing Analysis
- Market Share Analysis, 2025
- By Formulation
- By Injury Type
- By Product Form
- By End User
- By Sales Channel
- Spain
- Pricing Analysis
- Market Share Analysis, 2025
- By Formulation
- By Injury Type
- By Product Form
- By End User
- By Sales Channel
- France
- Pricing Analysis
- Market Share Analysis, 2025
- By Formulation
- By Injury Type
- By Product Form
- By End User
- By Sales Channel
- India
- Pricing Analysis
- Market Share Analysis, 2025
- By Formulation
- By Injury Type
- By Product Form
- By End User
- By Sales Channel
- ASEAN
- Pricing Analysis
- Market Share Analysis, 2025
- By Formulation
- By Injury Type
- By Product Form
- By End User
- By Sales Channel
- Australia and New Zealand
- Pricing Analysis
- Market Share Analysis, 2025
- By Formulation
- By Injury Type
- By Product Form
- By End User
- By Sales Channel
- China
- Pricing Analysis
- Market Share Analysis, 2025
- By Formulation
- By Injury Type
- By Product Form
- By End User
- By Sales Channel
- Japan
- Pricing Analysis
- Market Share Analysis, 2025
- By Formulation
- By Injury Type
- By Product Form
- By End User
- By Sales Channel
- South Korea
- Pricing Analysis
- Market Share Analysis, 2025
- By Formulation
- By Injury Type
- By Product Form
- By End User
- By Sales Channel
- Poland
- Pricing Analysis
- Market Share Analysis, 2025
- By Formulation
- By Injury Type
- By Product Form
- By End User
- By Sales Channel
- Hungary
- Pricing Analysis
- Market Share Analysis, 2025
- By Formulation
- By Injury Type
- By Product Form
- By End User
- By Sales Channel
- Türkiye
- Pricing Analysis
- Market Share Analysis, 2025
- By Formulation
- By Injury Type
- By Product Form
- By End User
- By Sales Channel
- South Africa
- Pricing Analysis
- Market Share Analysis, 2025
- By Formulation
- By Injury Type
- By Product Form
- By End User
- By Sales Channel
- United States
- Market Structure Analysis
- Competition Dashboard
- Competition Benchmarking
- Market Share Analysis of Top Players
- By Regional
- By Formulation
- By Injury Type
- By Product Form
- By End User
- By Sales Channel
- Emerging Startups
- Innovation Benchmarking
- Competition Analysis
- Competition Deep Dive
- Abbott
- Overview
- Product Portfolio
- Profitability by Market Segments
- Sales Footprint
- Strategy Overview
- Marketing Strategy
- Product Strategy
- Channel Strategy
- Nestle Health Science
- Danone Nutricia
- Fresenius Kabi
- Baxter
- B. Braun
- Victus
- Medtrition
- Abbott
- Case Studies
- Success Stories
- Recent Developments
- Competition Deep Dive
- Assumptions & Acronyms Used
List of Tables
- Table 1: Global Market Value (USD Million) Forecast by Region, 2021 to 2036
- Table 2: Global Market Value (USD Million) Forecast by Formulation, 2021 to 2036
- Table 3: Global Market Value (USD Million) Forecast by Injury Type, 2021 to 2036
- Table 4: Global Market Value (USD Million) Forecast by Product Form, 2021 to 2036
- Table 5: Global Market Value (USD Million) Forecast by End User, 2021 to 2036
- Table 6: Global Market Value (USD Million) Forecast by Sales Channel, 2021 to 2036
- Table 7: North America Market Value (USD Million) Forecast by Country, 2021 to 2036
- Table 8: North America Market Value (USD Million) Forecast by Formulation, 2021 to 2036
- Table 9: North America Market Value (USD Million) Forecast by Injury Type, 2021 to 2036
- Table 10: North America Market Value (USD Million) Forecast by Product Form, 2021 to 2036
- Table 11: North America Market Value (USD Million) Forecast by End User, 2021 to 2036
- Table 12: North America Market Value (USD Million) Forecast by Sales Channel, 2021 to 2036
- Table 13: Latin America Market Value (USD Million) Forecast by Country, 2021 to 2036
- Table 14: Latin America Market Value (USD Million) Forecast by Formulation, 2021 to 2036
- Table 15: Latin America Market Value (USD Million) Forecast by Injury Type, 2021 to 2036
- Table 16: Latin America Market Value (USD Million) Forecast by Product Form, 2021 to 2036
- Table 17: Latin America Market Value (USD Million) Forecast by End User, 2021 to 2036
- Table 18: Latin America Market Value (USD Million) Forecast by Sales Channel, 2021 to 2036
- Table 19: Western Europe Market Value (USD Million) Forecast by Country, 2021 to 2036
- Table 20: Western Europe Market Value (USD Million) Forecast by Formulation, 2021 to 2036
- Table 21: Western Europe Market Value (USD Million) Forecast by Injury Type, 2021 to 2036
- Table 22: Western Europe Market Value (USD Million) Forecast by Product Form, 2021 to 2036
- Table 23: Western Europe Market Value (USD Million) Forecast by End User, 2021 to 2036
- Table 24: Western Europe Market Value (USD Million) Forecast by Sales Channel, 2021 to 2036
- Table 25: Eastern Europe Market Value (USD Million) Forecast by Country, 2021 to 2036
- Table 26: Eastern Europe Market Value (USD Million) Forecast by Formulation, 2021 to 2036
- Table 27: Eastern Europe Market Value (USD Million) Forecast by Injury Type, 2021 to 2036
- Table 28: Eastern Europe Market Value (USD Million) Forecast by Product Form, 2021 to 2036
- Table 29: Eastern Europe Market Value (USD Million) Forecast by End User, 2021 to 2036
- Table 30: Eastern Europe Market Value (USD Million) Forecast by Sales Channel, 2021 to 2036
- Table 31: East Asia Market Value (USD Million) Forecast by Country, 2021 to 2036
- Table 32: East Asia Market Value (USD Million) Forecast by Formulation, 2021 to 2036
- Table 33: East Asia Market Value (USD Million) Forecast by Injury Type, 2021 to 2036
- Table 34: East Asia Market Value (USD Million) Forecast by Product Form, 2021 to 2036
- Table 35: East Asia Market Value (USD Million) Forecast by End User, 2021 to 2036
- Table 36: East Asia Market Value (USD Million) Forecast by Sales Channel, 2021 to 2036
- Table 37: South Asia and Pacific Market Value (USD Million) Forecast by Country, 2021 to 2036
- Table 38: South Asia and Pacific Market Value (USD Million) Forecast by Formulation, 2021 to 2036
- Table 39: South Asia and Pacific Market Value (USD Million) Forecast by Injury Type, 2021 to 2036
- Table 40: South Asia and Pacific Market Value (USD Million) Forecast by Product Form, 2021 to 2036
- Table 41: South Asia and Pacific Market Value (USD Million) Forecast by End User, 2021 to 2036
- Table 42: South Asia and Pacific Market Value (USD Million) Forecast by Sales Channel, 2021 to 2036
- Table 43: Middle East and Africa Market Value (USD Million) Forecast by Country, 2021 to 2036
- Table 44: Middle East and Africa Market Value (USD Million) Forecast by Formulation, 2021 to 2036
- Table 45: Middle East and Africa Market Value (USD Million) Forecast by Injury Type, 2021 to 2036
- Table 46: Middle East and Africa Market Value (USD Million) Forecast by Product Form, 2021 to 2036
- Table 47: Middle East and Africa Market Value (USD Million) Forecast by End User, 2021 to 2036
- Table 48: Middle East and Africa Market Value (USD Million) Forecast by Sales Channel, 2021 to 2036
List of Figures
- Figure 1: Global Market Pricing Analysis
- Figure 2: Global Market Value (USD Million) Forecast 2021-2036
- Figure 3: Global Market Value Share and BPS Analysis by Formulation, 2026 and 2036
- Figure 4: Global Market Y-o-Y Growth Comparison by Formulation, 2026-2036
- Figure 5: Global Market Attractiveness Analysis by Formulation
- Figure 6: Global Market Value Share and BPS Analysis by Injury Type, 2026 and 2036
- Figure 7: Global Market Y-o-Y Growth Comparison by Injury Type, 2026-2036
- Figure 8: Global Market Attractiveness Analysis by Injury Type
- Figure 9: Global Market Value Share and BPS Analysis by Product Form, 2026 and 2036
- Figure 10: Global Market Y-o-Y Growth Comparison by Product Form, 2026-2036
- Figure 11: Global Market Attractiveness Analysis by Product Form
- Figure 12: Global Market Value Share and BPS Analysis by End User, 2026 and 2036
- Figure 13: Global Market Y-o-Y Growth Comparison by End User, 2026-2036
- Figure 14: Global Market Attractiveness Analysis by End User
- Figure 15: Global Market Value Share and BPS Analysis by Sales Channel, 2026 and 2036
- Figure 16: Global Market Y-o-Y Growth Comparison by Sales Channel, 2026-2036
- Figure 17: Global Market Attractiveness Analysis by Sales Channel
- Figure 18: Global Market Value (USD Million) Share and BPS Analysis by Region, 2026 and 2036
- Figure 19: Global Market Y-o-Y Growth Comparison by Region, 2026-2036
- Figure 20: Global Market Attractiveness Analysis by Region
- Figure 21: North America Market Incremental Dollar Opportunity, 2026-2036
- Figure 22: Latin America Market Incremental Dollar Opportunity, 2026-2036
- Figure 23: Western Europe Market Incremental Dollar Opportunity, 2026-2036
- Figure 24: Eastern Europe Market Incremental Dollar Opportunity, 2026-2036
- Figure 25: East Asia Market Incremental Dollar Opportunity, 2026-2036
- Figure 26: South Asia and Pacific Market Incremental Dollar Opportunity, 2026-2036
- Figure 27: Middle East and Africa Market Incremental Dollar Opportunity, 2026-2036
- Figure 28: North America Market Value Share and BPS Analysis by Country, 2026 and 2036
- Figure 29: North America Market Value Share and BPS Analysis by Formulation, 2026 and 2036
- Figure 30: North America Market Y-o-Y Growth Comparison by Formulation, 2026-2036
- Figure 31: North America Market Attractiveness Analysis by Formulation
- Figure 32: North America Market Value Share and BPS Analysis by Injury Type, 2026 and 2036
- Figure 33: North America Market Y-o-Y Growth Comparison by Injury Type, 2026-2036
- Figure 34: North America Market Attractiveness Analysis by Injury Type
- Figure 35: North America Market Value Share and BPS Analysis by Product Form, 2026 and 2036
- Figure 36: North America Market Y-o-Y Growth Comparison by Product Form, 2026-2036
- Figure 37: North America Market Attractiveness Analysis by Product Form
- Figure 38: North America Market Value Share and BPS Analysis by End User, 2026 and 2036
- Figure 39: North America Market Y-o-Y Growth Comparison by End User, 2026-2036
- Figure 40: North America Market Attractiveness Analysis by End User
- Figure 41: North America Market Value Share and BPS Analysis by Sales Channel, 2026 and 2036
- Figure 42: North America Market Y-o-Y Growth Comparison by Sales Channel, 2026-2036
- Figure 43: North America Market Attractiveness Analysis by Sales Channel
- Figure 44: Latin America Market Value Share and BPS Analysis by Country, 2026 and 2036
- Figure 45: Latin America Market Value Share and BPS Analysis by Formulation, 2026 and 2036
- Figure 46: Latin America Market Y-o-Y Growth Comparison by Formulation, 2026-2036
- Figure 47: Latin America Market Attractiveness Analysis by Formulation
- Figure 48: Latin America Market Value Share and BPS Analysis by Injury Type, 2026 and 2036
- Figure 49: Latin America Market Y-o-Y Growth Comparison by Injury Type, 2026-2036
- Figure 50: Latin America Market Attractiveness Analysis by Injury Type
- Figure 51: Latin America Market Value Share and BPS Analysis by Product Form, 2026 and 2036
- Figure 52: Latin America Market Y-o-Y Growth Comparison by Product Form, 2026-2036
- Figure 53: Latin America Market Attractiveness Analysis by Product Form
- Figure 54: Latin America Market Value Share and BPS Analysis by End User, 2026 and 2036
- Figure 55: Latin America Market Y-o-Y Growth Comparison by End User, 2026-2036
- Figure 56: Latin America Market Attractiveness Analysis by End User
- Figure 57: Latin America Market Value Share and BPS Analysis by Sales Channel, 2026 and 2036
- Figure 58: Latin America Market Y-o-Y Growth Comparison by Sales Channel, 2026-2036
- Figure 59: Latin America Market Attractiveness Analysis by Sales Channel
- Figure 60: Western Europe Market Value Share and BPS Analysis by Country, 2026 and 2036
- Figure 61: Western Europe Market Value Share and BPS Analysis by Formulation, 2026 and 2036
- Figure 62: Western Europe Market Y-o-Y Growth Comparison by Formulation, 2026-2036
- Figure 63: Western Europe Market Attractiveness Analysis by Formulation
- Figure 64: Western Europe Market Value Share and BPS Analysis by Injury Type, 2026 and 2036
- Figure 65: Western Europe Market Y-o-Y Growth Comparison by Injury Type, 2026-2036
- Figure 66: Western Europe Market Attractiveness Analysis by Injury Type
- Figure 67: Western Europe Market Value Share and BPS Analysis by Product Form, 2026 and 2036
- Figure 68: Western Europe Market Y-o-Y Growth Comparison by Product Form, 2026-2036
- Figure 69: Western Europe Market Attractiveness Analysis by Product Form
- Figure 70: Western Europe Market Value Share and BPS Analysis by End User, 2026 and 2036
- Figure 71: Western Europe Market Y-o-Y Growth Comparison by End User, 2026-2036
- Figure 72: Western Europe Market Attractiveness Analysis by End User
- Figure 73: Western Europe Market Value Share and BPS Analysis by Sales Channel, 2026 and 2036
- Figure 74: Western Europe Market Y-o-Y Growth Comparison by Sales Channel, 2026-2036
- Figure 75: Western Europe Market Attractiveness Analysis by Sales Channel
- Figure 76: Eastern Europe Market Value Share and BPS Analysis by Country, 2026 and 2036
- Figure 77: Eastern Europe Market Value Share and BPS Analysis by Formulation, 2026 and 2036
- Figure 78: Eastern Europe Market Y-o-Y Growth Comparison by Formulation, 2026-2036
- Figure 79: Eastern Europe Market Attractiveness Analysis by Formulation
- Figure 80: Eastern Europe Market Value Share and BPS Analysis by Injury Type, 2026 and 2036
- Figure 81: Eastern Europe Market Y-o-Y Growth Comparison by Injury Type, 2026-2036
- Figure 82: Eastern Europe Market Attractiveness Analysis by Injury Type
- Figure 83: Eastern Europe Market Value Share and BPS Analysis by Product Form, 2026 and 2036
- Figure 84: Eastern Europe Market Y-o-Y Growth Comparison by Product Form, 2026-2036
- Figure 85: Eastern Europe Market Attractiveness Analysis by Product Form
- Figure 86: Eastern Europe Market Value Share and BPS Analysis by End User, 2026 and 2036
- Figure 87: Eastern Europe Market Y-o-Y Growth Comparison by End User, 2026-2036
- Figure 88: Eastern Europe Market Attractiveness Analysis by End User
- Figure 89: Eastern Europe Market Value Share and BPS Analysis by Sales Channel, 2026 and 2036
- Figure 90: Eastern Europe Market Y-o-Y Growth Comparison by Sales Channel, 2026-2036
- Figure 91: Eastern Europe Market Attractiveness Analysis by Sales Channel
- Figure 92: East Asia Market Value Share and BPS Analysis by Country, 2026 and 2036
- Figure 93: East Asia Market Value Share and BPS Analysis by Formulation, 2026 and 2036
- Figure 94: East Asia Market Y-o-Y Growth Comparison by Formulation, 2026-2036
- Figure 95: East Asia Market Attractiveness Analysis by Formulation
- Figure 96: East Asia Market Value Share and BPS Analysis by Injury Type, 2026 and 2036
- Figure 97: East Asia Market Y-o-Y Growth Comparison by Injury Type, 2026-2036
- Figure 98: East Asia Market Attractiveness Analysis by Injury Type
- Figure 99: East Asia Market Value Share and BPS Analysis by Product Form, 2026 and 2036
- Figure 100: East Asia Market Y-o-Y Growth Comparison by Product Form, 2026-2036
- Figure 101: East Asia Market Attractiveness Analysis by Product Form
- Figure 102: East Asia Market Value Share and BPS Analysis by End User, 2026 and 2036
- Figure 103: East Asia Market Y-o-Y Growth Comparison by End User, 2026-2036
- Figure 104: East Asia Market Attractiveness Analysis by End User
- Figure 105: East Asia Market Value Share and BPS Analysis by Sales Channel, 2026 and 2036
- Figure 106: East Asia Market Y-o-Y Growth Comparison by Sales Channel, 2026-2036
- Figure 107: East Asia Market Attractiveness Analysis by Sales Channel
- Figure 108: South Asia and Pacific Market Value Share and BPS Analysis by Country, 2026 and 2036
- Figure 109: South Asia and Pacific Market Value Share and BPS Analysis by Formulation, 2026 and 2036
- Figure 110: South Asia and Pacific Market Y-o-Y Growth Comparison by Formulation, 2026-2036
- Figure 111: South Asia and Pacific Market Attractiveness Analysis by Formulation
- Figure 112: South Asia and Pacific Market Value Share and BPS Analysis by Injury Type, 2026 and 2036
- Figure 113: South Asia and Pacific Market Y-o-Y Growth Comparison by Injury Type, 2026-2036
- Figure 114: South Asia and Pacific Market Attractiveness Analysis by Injury Type
- Figure 115: South Asia and Pacific Market Value Share and BPS Analysis by Product Form, 2026 and 2036
- Figure 116: South Asia and Pacific Market Y-o-Y Growth Comparison by Product Form, 2026-2036
- Figure 117: South Asia and Pacific Market Attractiveness Analysis by Product Form
- Figure 118: South Asia and Pacific Market Value Share and BPS Analysis by End User, 2026 and 2036
- Figure 119: South Asia and Pacific Market Y-o-Y Growth Comparison by End User, 2026-2036
- Figure 120: South Asia and Pacific Market Attractiveness Analysis by End User
- Figure 121: South Asia and Pacific Market Value Share and BPS Analysis by Sales Channel, 2026 and 2036
- Figure 122: South Asia and Pacific Market Y-o-Y Growth Comparison by Sales Channel, 2026-2036
- Figure 123: South Asia and Pacific Market Attractiveness Analysis by Sales Channel
- Figure 124: Middle East and Africa Market Value Share and BPS Analysis by Country, 2026 and 2036
- Figure 125: Middle East and Africa Market Value Share and BPS Analysis by Formulation, 2026 and 2036
- Figure 126: Middle East and Africa Market Y-o-Y Growth Comparison by Formulation, 2026-2036
- Figure 127: Middle East and Africa Market Attractiveness Analysis by Formulation
- Figure 128: Middle East and Africa Market Value Share and BPS Analysis by Injury Type, 2026 and 2036
- Figure 129: Middle East and Africa Market Y-o-Y Growth Comparison by Injury Type, 2026-2036
- Figure 130: Middle East and Africa Market Attractiveness Analysis by Injury Type
- Figure 131: Middle East and Africa Market Value Share and BPS Analysis by Product Form, 2026 and 2036
- Figure 132: Middle East and Africa Market Y-o-Y Growth Comparison by Product Form, 2026-2036
- Figure 133: Middle East and Africa Market Attractiveness Analysis by Product Form
- Figure 134: Middle East and Africa Market Value Share and BPS Analysis by End User, 2026 and 2036
- Figure 135: Middle East and Africa Market Y-o-Y Growth Comparison by End User, 2026-2036
- Figure 136: Middle East and Africa Market Attractiveness Analysis by End User
- Figure 137: Middle East and Africa Market Value Share and BPS Analysis by Sales Channel, 2026 and 2036
- Figure 138: Middle East and Africa Market Y-o-Y Growth Comparison by Sales Channel, 2026-2036
- Figure 139: Middle East and Africa Market Attractiveness Analysis by Sales Channel
- Figure 140: Global Market - Tier Structure Analysis
- Figure 141: Global Market - Company Share Analysis
Frequently Asked Questions
How large is the trauma recovery nutrition market in 2026?
Future Market Insights estimates that the Trauma Recovery Nutrition Market will be valued at USD 334.1 million in 2026. The market is projected to reach USD 701.5 million by 2036.
What is the market CAGR from 2026 through 2036?
As per FMI, the Trauma Recovery Nutrition Market is projected to grow at 7.7% CAGR from 2026 to 2036. Growth is supported by earlier enteral feeding and higher-protein recovery formats.
Which formulation has a notable trauma recovery nutrition share?
High-protein high-energy is estimated to account for 38.3% of formulation demand in 2026. The segment benefits from concentrated protein and calorie delivery in limited feeding volumes.
Which product form has a notable market share in 2026?
Enteral tube feeds are projected to hold 48.5% of product form demand in 2026. Demand is supported by measurable delivery when oral intake remains unsafe or inadequate.
Which country has a notable expansion outlook through 2036?
South Korea is projected to register 8.0% CAGR from 2026 to 2036. Growth is supported by recent national guidance for intensive-care nutrition.
Which companies are notable in trauma recovery nutrition today?
Key participants include Abbott, Nestle Health Science, Danone Nutricia, Fresenius Kabi, Baxter, B. Braun, Victus, and Medtrition. These companies compete through portfolio breadth, clinical delivery systems, and focused recovery products.
Preview the report firsthand - request a free sample
Get SampleGet the brochure for pricing and purchase details.
Get PDF
