The tunnel tray market is forecast to expand from USD 97 million in 2025 to USD 146.5 million by 2035, advancing at a CAGR of 4.2%. Examining growth in half-decade blocks provides a clearer picture of how the market trajectory unfolds across short intervals. Between 2025 and 2030, demand is expected to be driven largely by infrastructure investments, urban expansion, and modernization of tunnel networks across transportation and utilities. This period marks the foundation phase where adoption accelerates, setting the stage for future scalability. Weighted growth during this interval is steady, reflecting consistent application across industrial and construction sectors.
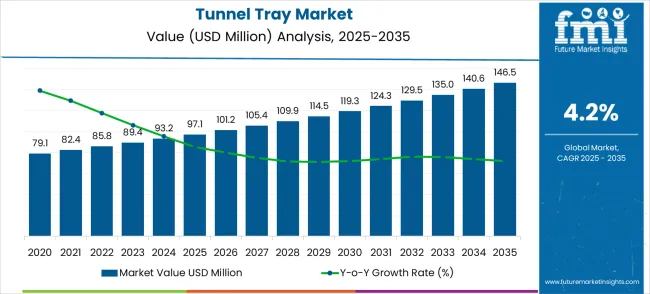
From 2030 to 2035, the growth momentum builds upon the established base, with technological improvements in tray materials and installation processes adding efficiency and cost advantages. The weighted growth in this half-decade is slightly stronger, supported by replacement cycles in existing infrastructure and increased focus on safety standards in underground projects. Across the ten-year span, the compound effect of these two half-decade intervals balances early-stage adoption with later-stage consolidation, resulting in a stable long-term trajectory. This distribution highlights that while initial gains arise from project expansions, later growth is influenced by both innovation and lifecycle upgrades, ensuring a sustained market pathway.
The tunnel tray market is structured across power distribution networks (36%), transportation and rail infrastructure (25%), industrial facilities (18%), commercial construction projects (12%), and specialty utilities such as underground data cable management (9%). Power distribution networks lead usage as tunnel trays provide safe routing and structural support for high-voltage cables. Transportation and rail projects adopt tunnel trays to organize and protect signaling and traction power cables. Industrial plants rely on them for durability in high-load environments, while commercial buildings integrate them for efficient cabling layouts. Specialty utilities, including underground telecom and data centers, benefit from enhanced safety and organized cable pathways.
Current advancements include fire-retardant coatings, corrosion-resistant materials, and modular tray systems to improve safety and flexibility. Manufacturers are introducing lightweight yet high-strength designs that reduce installation time. Expansion is linked to urban infrastructure upgrades, renewable power projects, and smart grid development. Collaborations between construction firms and tray producers enable customized solutions for long-term reliability, efficiency, and compliance with electrical standards, shaping consistent global growth.
| Metric | Value |
|---|---|
| Estimated Value in (2025E) | USD 97.1 million |
| Forecast Value in (2035F) | USD 146.5 million |
| Forecast CAGR (2025 to 2035) | 4.2% |
Market expansion is being supported by the increasing complexity of industrial separation processes and the corresponding need for efficient mass transfer equipment that can optimize separation performance while minimizing energy consumption and operational costs. Modern chemical processing facilities require sophisticated distillation and absorption systems that can handle diverse feedstocks, achieve high-purity products, and maintain consistent operational reliability across varying process conditions. Tunnel trays provide the necessary mass transfer efficiency, operational flexibility, and maintenance convenience to ensure optimal process performance in demanding industrial applications.
The growing emphasis on process optimization and energy efficiency is driving demand for advanced tunnel tray solutions that can reduce energy consumption while improving separation performance and product quality. Industrial facilities are implementing comprehensive process improvement initiatives that focus on maximizing operational efficiency, reducing environmental impact, and enhancing product specifications through advanced equipment selection. Regulatory requirements and industry standards are establishing stringent efficiency and environmental compliance protocols that require specialized tray technologies with validated performance characteristics and comprehensive environmental benefits.
The market is segmented by material type, end-use industry, and region. By material type, the market is divided into stainless steel materials, aluminum materials, and others. Based on end-use industry, the market is categorized into glycol recycling, liquid fertilizer processing, natural gas drying, and others. Regionally, the market is divided into North America, Europe, East Asia, South Asia & Pacific, Latin America, and Middle East & Africa.
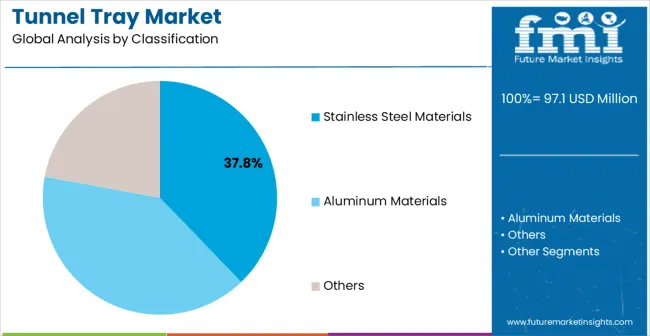
Stainless steel materials are projected to account for 37.8% of the tunnel tray market in 2025. This leading share is supported by the superior corrosion resistance and mechanical properties of stainless steel materials in demanding industrial processing environments. Stainless steel tunnel trays provide excellent chemical compatibility, high temperature resistance, and long-term durability that make them ideal for aggressive chemical processing applications including petrochemical refining, pharmaceutical manufacturing, and specialty chemical production. The segment benefits from established manufacturing processes, comprehensive material specifications, and extensive qualification databases that facilitate adoption across diverse industrial applications requiring superior corrosion resistance and mechanical reliability.
Stainless steel tunnel tray technology continues advancing through development of specialized alloys, improved manufacturing techniques, and enhanced surface treatments that provide superior performance characteristics for demanding applications. The segment growth reflects increasing adoption of stainless steel solutions in expanding chemical processing facilities and growing pharmaceutical manufacturing operations that require superior chemical compatibility and long-term reliability. Manufacturers are developing next-generation stainless steel tunnel trays with optimized surface textures, enhanced mass transfer characteristics, and integrated monitoring capabilities that support advanced process control and performance optimization in critical manufacturing processes.
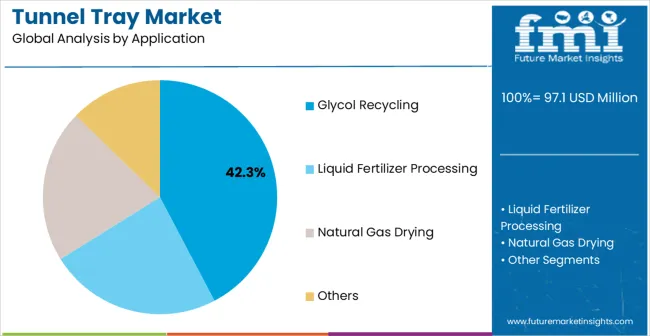
Glycol recycling applications are expected to represent 42.3% of tunnel tray demand in 2025. This dominant share reflects the extensive use of tunnel trays in glycol recovery systems, dehydration processes, and purification operations that require efficient separation and product recovery capabilities. Modern glycol recycling facilities depend on advanced distillation systems incorporating tunnel trays for optimal separation performance, energy efficiency, and product quality achievement across diverse process conditions and feedstock variations. The segment benefits from ongoing industrial expansion, increasing emphasis on resource recovery, and growing demand for high-purity glycol products across automotive, pharmaceutical, and industrial applications.
Glycol recycling industry transformation toward more efficient recovery processes and higher purity specifications is driving significant tunnel tray demand as operators implement advanced separation technologies and process optimization strategies. The segment expansion reflects increasing emphasis on resource conservation, operational efficiency, and product quality that depend on superior mass transfer performance and comprehensive process control capabilities. Advanced glycol recycling applications are incorporating real-time monitoring systems, automated process control, and comprehensive quality management that require sophisticated tunnel tray technologies with enhanced performance characteristics and operational reliability features.
The tunnel tray market is advancing steadily due to increasing industrial processing capacity and growing emphasis on separation efficiency optimization. The market faces challenges including high initial investment costs, complex design requirements for specific applications, and need for specialized maintenance expertise. Technological advancement efforts and process optimization programs continue to influence product development and market expansion patterns across diverse industrial applications.
The growing implementation of sophisticated computational fluid dynamics and comprehensive process modeling in tunnel tray design is enabling optimized mass transfer performance, enhanced operational efficiency, and predictive maintenance capabilities that improve overall system effectiveness. Advanced modeling technologies provide detailed flow analysis, heat and mass transfer optimization, and comprehensive performance prediction that support efficient tray selection and process design optimization. These technological advances enable process engineers to achieve higher levels of separation efficiency and operational reliability while reducing energy consumption and maintenance requirements through improved design approaches.
Tunnel tray manufacturers are developing modular system designs and customizable configurations that enable flexible installation, easy maintenance, and cost-effective implementation across diverse process requirements and facility constraints. Modular tray systems provide enhanced flexibility for retrofit applications while supporting efficient scaling for changing operational needs and process modifications. This trend supports broader market adoption by reducing installation complexity and providing upgrade pathways that accommodate evolving process requirements and emerging technology applications.
| Country | CAGR (2025-2035) |
|---|---|
| China | 5.7% |
| India | 5.3% |
| Germany | 4.8% |
| Brazil | 4.4% |
| United States | 4.0% |
| United Kingdom | 3.6% |
| Japan | 3.2% |
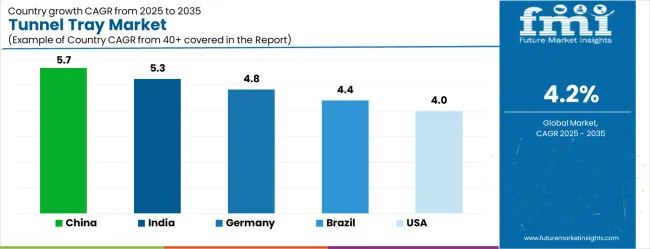
The tunnel tray market demonstrates varied growth patterns across key countries, with China leading at a 5.7% CAGR through 2035, driven by expanding chemical processing capacity, government industrial development initiatives, and growing petrochemical manufacturing capabilities. India follows at 5.3%, supported by increasing chemical industry investments, expanding fertilizer production, and growing industrial processing infrastructure. Germany records 4.8% growth, emphasizing precision engineering, advanced process technologies, and comprehensive chemical industry development. Brazil shows steady growth at 4.4%, expanding petrochemical processing capabilities and industrial infrastructure modernization. The United States maintains 4.0% growth, focusing on process optimization and advanced chemical manufacturing. The United Kingdom demonstrates 3.6% expansion, supported by chemical industry modernization and process efficiency initiatives. Japan records 3.2% growth, leveraging technological excellence and precision manufacturing capabilities.
The report covers an in-depth analysis of 40+ countries; seven top-performing countries are highlighted below.
The tunnel tray market in China is projected to expand at the highest growth rate with a CAGR of 5.7% through 2035, driven by massive chemical processing industry expansion, government support for industrial development, and growing petrochemical manufacturing capabilities across diverse regional markets. The country's comprehensive industrial development strategy includes significant investments in chemical processing facilities, refining capacity, and specialty chemical production that require advanced separation technologies including tunnel trays. Major chemical companies and petrochemical manufacturers are establishing comprehensive production capabilities that support domestic demand growth and export market development.
The tunnel trays market in India is projected to grow at a CAGR of 5.3%, supported by expanding chemical industry investments, growing fertilizer production capabilities, and increasing industrial processing infrastructure development across diverse manufacturing sectors. The country's emphasis on industrial growth and manufacturing expansion is driving demand for tunnel tray solutions that support chemical processing, petrochemical refining, and specialty manufacturing operations requiring efficient separation technologies. Government programs promoting industrial development are creating favorable conditions for process equipment adoption and technology advancement. Major international companies are establishing manufacturing facilities that require comprehensive process equipment systems and technical support services.
Demand for tunnel trays in Germany is projected to expand at a CAGR of 4.8%, supported by the country's leadership in precision engineering, advanced process technologies, and comprehensive chemical industry development capabilities. German manufacturers are implementing sophisticated tunnel tray solutions that meet stringent performance standards while supporting complex chemical processing operations and specialty manufacturing applications. The country's extensive chemical and petrochemical industries are driving significant tunnel tray demand for distillation, absorption, and separation processes requiring superior performance and reliability. Advanced manufacturing partnerships are facilitating technology development and knowledge sharing across process equipment suppliers and chemical manufacturers.
The tunnel trays market in Brazil is projected to expand at a CAGR of 4.4%, driven by expanding petrochemical processing capabilities, growing chemical industry investments, and increasing emphasis on industrial infrastructure modernization across diverse manufacturing sectors. Brazilian chemical and petrochemical companies are investing in tunnel tray solutions to enhance separation efficiency and meet international quality standards while supporting domestic market requirements and export opportunities. Government programs supporting industrial development are facilitating access to advanced process technologies and technical expertise. Regional manufacturing centers are developing specialized capabilities that support tunnel tray applications across chemical processing, petrochemical refining, and specialty manufacturing industries.
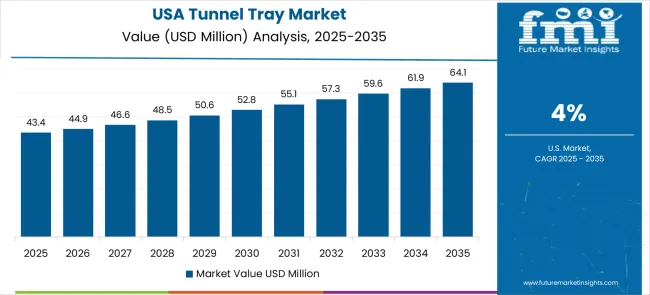
Demand for tunnel trays in the United States is projected to grow at a CAGR of 4.0%, driven by chemical industry modernization, process optimization initiatives, and ongoing technology advancement programs across petrochemical and specialty chemical manufacturing sectors. American manufacturers are implementing advanced tunnel tray solutions to maintain global competitiveness while supporting efficient chemical processing and manufacturing operations. The petrochemical industry is driving significant tunnel tray demand for refining applications, chemical separation processes, and specialty product manufacturing requiring advanced separation technologies. Government initiatives supporting domestic chemical manufacturing are creating opportunities for advanced process equipment adoption and technology development.
Demand for tunnel trays in the United Kingdom is projected to grow at a CAGR of 3.6%, supported by chemical industry modernization, process efficiency initiatives, and increasing emphasis on sustainable manufacturing practices across diverse industrial sectors. British chemical manufacturers are investing in tunnel tray solutions to support process optimization, environmental compliance, and operational efficiency improvements while maintaining competitive manufacturing capabilities. The country's established chemical processing infrastructure is facilitating tunnel tray adoption through comprehensive equipment replacement programs and process improvement initiatives. Government initiatives supporting industrial sustainability are creating favorable conditions for efficient process equipment adoption and technology advancement.
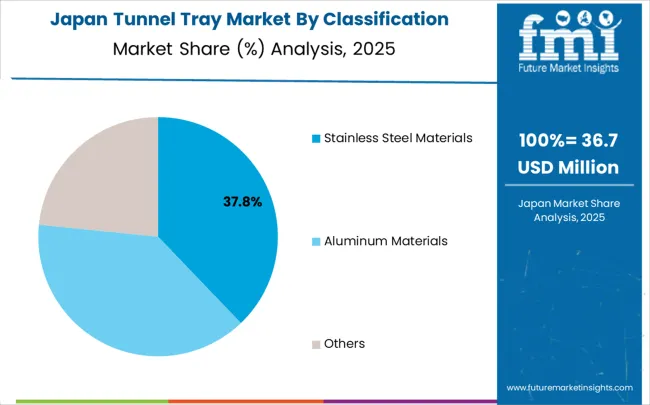
The tunnel trays industry in Japan is projected to expand at a CAGR of 3.2%, supported by advanced manufacturing capabilities, precision engineering expertise, and emphasis on process optimization excellence across chemical processing and specialty manufacturing applications. Japanese manufacturers are implementing sophisticated tunnel tray solutions that demonstrate superior performance characteristics while supporting diverse industrial applications requiring precision separation and high-quality product specifications.
The country's chemical and petrochemical industries are driving demand for advanced tunnel tray technologies that support precision manufacturing processes and stringent quality control requirements. Collaborative research programs between industry and academic institutions are developing innovative separation technologies that maintain Japan's competitive advantage in global chemical technology markets.
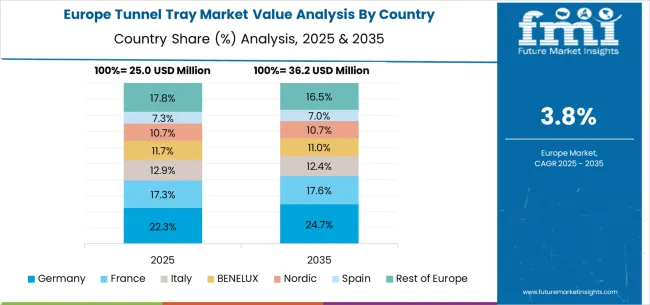
The tunnel tray market in Europe is projected to grow from USD 26.3 million in 2025 to USD 39.6 million by 2035, registering a CAGR of 4.2% over the forecast period. Germany is expected to maintain its leadership with 33.7% market share in 2025, projected to grow to 34.2% by 2035, supported by its extensive chemical processing infrastructure and advanced manufacturing capabilities. France follows with 19.8% market share in 2025, expected to reach 20.1% by 2035, driven by petrochemical industry development and specialty chemical manufacturing activities.
The Rest of Europe region is projected to maintain stable share at 17.6% throughout the forecast period, attributed to emerging chemical processing initiatives in Eastern European countries and expanding industrial infrastructure. United Kingdom contributes 15.4% in 2025, projected to reach 15.2% by 2035, supported by chemical industry modernization and process optimization programs. Italy maintains 13.5% share in 2025, expected to grow to 14.5% by 2035, while other European countries demonstrate steady growth patterns reflecting regional industrial development and process technology advancement initiatives.
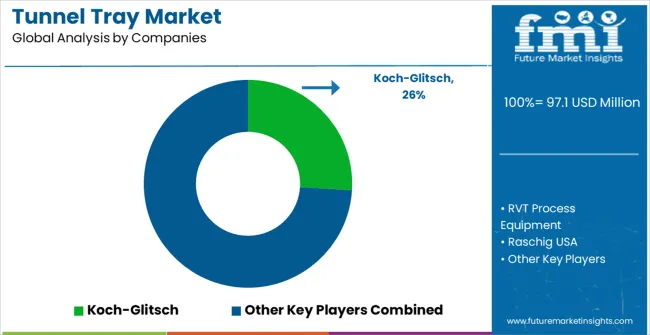
The tunnel tray market is characterized by competition among specialized process equipment manufacturers, chemical engineering companies, and industrial separation technology providers. Companies are investing in advanced design optimization, comprehensive testing capabilities, modular manufacturing approaches, and technical support services to deliver efficient, reliable, and cost-effective tunnel tray solutions. Strategic partnerships, technological innovation, and application expertise development are central to strengthening product portfolios and market presence.
Koch-Glitsch (Koch Engineered Solutions, USA-based, offers comprehensive tunnel tray solutions with focus on chemical processing applications, advanced design optimization, and proven performance capabilities across diverse industrial sectors. RVT Process Equipment, Netherlands, provides specialized tunnel tray systems emphasizing custom engineering, modular designs, and comprehensive technical support for demanding applications. Raschig USA delivers advanced separation technologies with focus on process optimization, environmental compliance, and operational efficiency improvements.
MTE Group specializes in custom tunnel tray solutions with emphasis on pharmaceutical and specialty chemical applications requiring superior performance and regulatory compliance. Other key players including AMT International Inc, and Kuber Precision Tech LLP contribute specialized expertise and diverse technical capabilities across global and regional markets.
Tunnel trays represent specialized mass transfer equipment essential for distillation, absorption, and stripping operations in chemical processing industries. With the market growing from $97.1M to $146.5M at 4.2% CAGR, driven by process intensification demands, energy efficiency requirements, and expanding applications in glycol recycling and natural gas processing, this niche industrial equipment sector requires coordinated stakeholder action to address custom engineering challenges, material optimization, and process integration complexities.
How Governments Could Support Process Equipment Manufacturing Excellence?
Advanced Manufacturing Incentives: Provide targeted support for domestic process equipment manufacturing capabilities, recognizing tunnel tray fabrication as critical infrastructure for petrochemical, natural gas, and specialty chemical industries essential to industrial competitiveness.
Technical Skills Development: Fund specialized training programs in precision metalworking, chemical process equipment design, and mass transfer engineering to address the acute shortage of skilled fabricators and process engineers in this highly technical field.
Research Infrastructure Investment: Support national laboratories and university research centers focused on mass transfer optimization, computational fluid dynamics modeling, and advanced materials testing for process equipment applications.
Export Promotion Programs: Develop trade missions and technical exchange programs that showcase domestic tunnel tray manufacturing capabilities to international markets, particularly in emerging economies expanding chemical processing capacity.
Environmental Technology Incentives: Provide tax credits and grants for tunnel tray applications in environmental remediation, carbon capture, and waste treatment systems that support broader sustainability objectives.
How Process Industry Associations Could Strengthen Technical Standards?
Performance Testing Protocols: Establish standardized methods for evaluating tunnel tray efficiency, pressure drop, and fouling resistance that enable objective comparisons across suppliers and facilitate process optimization.
Material Specification Standards: Develop comprehensive guidelines for stainless steel grades, aluminum alloys, and specialized coatings used in tunnel tray construction, ensuring compatibility with specific process chemistries and operating conditions.
Design Optimization Guidelines: Create industry best practices for tray spacing, hole patterns, and flow distribution that optimize mass transfer while minimizing pressure drop and maintenance requirements.
Safety & Maintenance Standards: Establish protocols for tunnel tray inspection, cleaning, and replacement that ensure safe operation while maximizing equipment life in corrosive and high-temperature environments.
Process Integration Best Practices: Develop guidelines for tunnel tray selection and sizing in different applications (distillation towers, absorbers, strippers) to optimize overall process performance and energy efficiency.
How Equipment Manufacturers Could Enhance Market Position?
Computational Design Capabilities: Invest in advanced CFD modeling and simulation tools that enable custom tunnel tray design optimization for specific process conditions, reducing trial-and-error approaches and improving first-time-right performance.
Advanced Materials Integration: Develop proprietary alloys, surface treatments, and composite materials that extend tunnel tray life in aggressive process environments while maintaining mass transfer efficiency.
Modular Manufacturing Systems: Create flexible fabrication capabilities that can efficiently produce custom tunnel tray configurations while maintaining quality consistency across small-batch, engineered-to-order production.
Process Integration Services: Expand beyond component supply to provide complete mass transfer system design, installation supervision, and performance optimization services that create customer dependency and recurring revenue.
Digital Performance Monitoring: Integrate sensors and monitoring systems that track tunnel tray performance in real-time, enabling predictive maintenance and process optimization for customers.
How Process Engineering Companies Could Optimize System Performance?
Integrated Process Design: Incorporate tunnel tray selection and optimization into overall process design rather than treating as standalone components, maximizing system-wide efficiency and performance.
Performance Modeling Excellence: Develop sophisticated models that predict tunnel tray performance under varying process conditions, enabling accurate sizing and selection for optimal operation across operating ranges.
Retrofit Optimization Programs: Create systematic approaches for upgrading existing distillation and absorption systems with optimized tunnel trays to improve efficiency without major equipment replacement.
Cross-Industry Application Transfer: Apply tunnel tray innovations across different process industries, transferring successful solutions from petrochemical applications to food processing, pharmaceuticals, or environmental systems.
Commissioning & Startup Excellence: Develop specialized procedures for tunnel tray system commissioning that ensure optimal initial performance and provide baseline data for ongoing optimization.
How End-User Process Industries Could Maximize Equipment Value?
Predictive Maintenance Implementation: Develop condition monitoring and inspection protocols that optimize tunnel tray replacement timing, balancing performance degradation against maintenance costs and production disruptions.
Process Optimization Integration: Continuously monitor and optimize operating conditions (flow rates, temperatures, compositions) to maximize tunnel tray performance and extend equipment life.
Cross-Plant Knowledge Sharing: Establish internal networks for sharing tunnel tray performance data, maintenance best practices, and optimization strategies across multiple facilities and applications.
Supplier Partnership Development: Engage in long-term technical partnerships with tunnel tray suppliers including joint performance monitoring, improvement initiatives, and technology development programs.
Performance Benchmarking: Track tunnel tray performance against industry standards and alternative technologies to inform future equipment decisions and justify optimization investments.
How Financial Enablers Could Support Market Development?
Process Equipment Financing: Develop specialized financing programs that recognize tunnel tray systems as productivity-enhancing capital equipment with long operational lives and measurable performance benefits.
Technology Innovation Investment: Finance R&D initiatives focused on advanced materials, manufacturing processes, and design optimization tools that can significantly improve tunnel tray performance or reduce costs.
Manufacturing Capability Investment: Support investments in precision fabrication equipment, quality control systems, and testing facilities that enable competitive tunnel tray production.
Market Expansion Capital: Back companies expanding tunnel tray applications into emerging markets and new process industries where mass transfer optimization is becoming increasingly important.
Consolidation & Scale Opportunities: Support strategic combinations among specialized process equipment manufacturers to create suppliers with sufficient technical depth and global reach to serve major process industry customers.
How Technology Providers Could Enable Innovation?
Advanced Simulation Software: Develop specialized CFD and mass transfer modeling tools optimized for tunnel tray design that enable engineers to predict performance and optimize configurations before fabrication.
Materials Testing Services: Provide specialized testing capabilities for evaluating new materials and coatings under simulated process conditions, accelerating development of improved tunnel tray designs.
Manufacturing Technology: Supply precision fabrication equipment, automated welding systems, and quality control tools that enable consistent production of complex tunnel tray geometries.
Performance Monitoring Systems: Develop sensor technologies and data analytics platforms that enable real-time monitoring of tunnel tray performance and condition assessment.
Design Optimization Platforms: Create integrated design tools that combine process simulation with mechanical design capabilities, enabling engineers to optimize tunnel tray performance within overall process constraints.
The tunnel tray market's continued growth requires addressing the fundamental challenge of delivering custom-engineered solutions that optimize mass transfer performance while managing the costs and complexities of small-batch, high-precision manufacturing for diverse process industry applications.
| Item | Value |
|---|---|
| Quantitative Units (2025) | USD 97 million |
| Material Type | Stainless Steel Materials, Aluminum Materials, and Others |
| End-Use Industry | Glycol Recycling, Liquid Fertilizer Processing, Natural Gas Drying, and Others |
| Regions Covered | North America, Europe, East Asia, South Asia & Pacific, Latin America, Middle East & Africa |
| Countries Covered | United States, Canada, United Kingdom, Germany, France, China, Japan, South Korea, India, Brazil, Australia and 40+ countries |
| Key Companies Profiled | Koch-Glitsch, RVT Process Equipment, Raschig USA, MTE Group, AMT International Inc |
| Additional Attributes | Dollar sales by material type and end-use industry segments, regional demand trends across North America, Europe, and Asia-Pacific, competitive landscape with established process equipment manufacturers and specialized separation technology providers, buyer preferences for stainless steel versus aluminum material solutions, integration with chemical processing systems and industrial separation operations, innovations in computational fluid dynamics modeling and process optimization technologies |
The global tunnel tray market is estimated to be valued at USD 97.1 million in 2025.
The market size for the tunnel tray market is projected to reach USD 146.5 million by 2035.
The tunnel tray market is expected to grow at a 4.2% CAGR between 2025 and 2035.
The key product types in tunnel tray market are stainless steel materials, aluminum materials and others.
In terms of application, glycol recycling segment to command 42.3% share in the tunnel tray market in 2025.


Our Research Products

The "Full Research Suite" delivers actionable market intel, deep dives on markets or technologies, so clients act faster, cut risk, and unlock growth.

The Leaderboard benchmarks and ranks top vendors, classifying them as Established Leaders, Leading Challengers, or Disruptors & Challengers.

Locates where complements amplify value and substitutes erode it, forecasting net impact by horizon

We deliver granular, decision-grade intel: market sizing, 5-year forecasts, pricing, adoption, usage, revenue, and operational KPIs—plus competitor tracking, regulation, and value chains—across 60 countries broadly.

Spot the shifts before they hit your P&L. We track inflection points, adoption curves, pricing moves, and ecosystem plays to show where demand is heading, why it is changing, and what to do next across high-growth markets and disruptive tech

Real-time reads of user behavior. We track shifting priorities, perceptions of today’s and next-gen services, and provider experience, then pace how fast tech moves from trial to adoption, blending buyer, consumer, and channel inputs with social signals (#WhySwitch, #UX).

Partner with our analyst team to build a custom report designed around your business priorities. From analysing market trends to assessing competitors or crafting bespoke datasets, we tailor insights to your needs.
Supplier Intelligence
Discovery & Profiling
Capacity & Footprint
Performance & Risk
Compliance & Governance
Commercial Readiness
Who Supplies Whom
Scorecards & Shortlists
Playbooks & Docs
Category Intelligence
Definition & Scope
Demand & Use Cases
Cost Drivers
Market Structure
Supply Chain Map
Trade & Policy
Operating Norms
Deliverables
Buyer Intelligence
Account Basics
Spend & Scope
Procurement Model
Vendor Requirements
Terms & Policies
Entry Strategy
Pain Points & Triggers
Outputs
Pricing Analysis
Benchmarks
Trends
Should-Cost
Indexation
Landed Cost
Commercial Terms
Deliverables
Brand Analysis
Positioning & Value Prop
Share & Presence
Customer Evidence
Go-to-Market
Digital & Reputation
Compliance & Trust
KPIs & Gaps
Outputs
Full Research Suite comprises of:
Market outlook & trends analysis
Interviews & case studies
Strategic recommendations
Vendor profiles & capabilities analysis
5-year forecasts
8 regions and 60+ country-level data splits
Market segment data splits
12 months of continuous data updates
DELIVERED AS:
PDF EXCEL ONLINE
Tray Market Forecast and Outlook 2025 to 2035
Tray Sealing Machines Market Size and Share Forecast Outlook 2025 to 2035
Tray Dispensers Market Size and Share Forecast Outlook 2025 to 2035
Tunneling Equipment Market Size and Share Forecast Outlook 2025 to 2035
Tray and Sleeve Packing Machines Market Size and Share Forecast Outlook 2025 to 2035
Tray Former Machines Market Size and Share Forecast Outlook 2025 to 2035
Tray Sealer Machines Market Size and Share Forecast Outlook 2025 to 2035
Tunnel Visibility Monitors Market Analysis - Size, Share, and Forecast Outlook 2025 to 2035
Tunnel Monitoring System Market Growth - Trends & Forecast 2025 to 2035
Industry Share & Competitive Positioning in Tray Sealer Machines
Market Share Distribution Among Tray Former Machines Manufacturers
Tray Liners Market
Tray Packing Machine Market
Tunnel Oven Market
Tray Loader Market
ESD Trays Market Size and Share Forecast Outlook 2025 to 2035
Lab Trays Market Size and Share Forecast Outlook 2025 to 2035
Food Tray Market Size and Share Forecast Outlook 2025 to 2035
Meat Trays Market Analysis - Size and Share Forecast Outlook 2025 to 2035
Meal Tray Sealing Machines Market Size and Share Forecast Outlook 2025 to 2035

Thank you!
You will receive an email from our Business Development Manager. Please be sure to check your SPAM/JUNK folder too.
Chat With
MaRIA