Reports

- Global Locations -

Headquarters

Future Market Insights, Inc.

Christiana Corporate, 200
Continental Drive, Suite 401,
Newark, Delaware - 19713,
United States

T: +1-845-579-5705

Americas

Future Market Insights, Inc.

616 Corporate Way, Suite 2-9018,
Valley Cottage, NY 10989, United States

T: +1-347-918-3531

MEA

Future Market Insights

1602-6 Jumeirah Bay X2 Tower, Plot No: JLT-PH2-X2A,
Jumeirah Lakes Towers, Dubai,
United Arab Emirates

Europe

Future Market Insights

3rd Floor, 207 Regent Street,
W1B 3HH London
United Kingdom

T: + 44 (0) 20 8123 9659
D: +44 (0) 20 3287 4268

Asia Pacific

Future Market Insights

IndiaLand Global Tech Park, Unit UG-1, Behind Grand HighStreet, Phase 1, Hinjawadi, MH, Pune – 411057, India

Urinary Bag Market Outlook (2023 to 2033)

The global urinary bag market is poised to surpass US$ 1,899.3 million by 2023, surging at a remarkable CAGR of 4.4% through 2033 to reach US$ 2,911.7 million.

The urinary bag market has experienced significant growth in recent years due to the increasing prevalence of urinary incontinence and urinary retention disorders. With growing environmental concerns, there is a rising emphasis on developing sustainable urinary bag solutions. Furthermore, manufacturers are increasingly exploring eco-friendly materials, recycling initiatives, and waste reduction strategies to address these sustainability concerns.

What is the Impact of Consolidation Efforts on Urinary Bag Sales?

  • Market Consolidation: Key players in the urinary bag industry are focusing on mergers and acquisitions to explore lucrative opportunities and consolidate their market presence.
  • Regulatory Compliance: Leading manufacturers are prioritizing product commercialization by regulatory guidelines to ensure compliance and meet quality standards.

Acquisition by BD: On December 29, 2017, BD completed the acquisition of Bard, aiming to create a medical technology company that improves disease treatment and healthcare processes.

  • Extended Offerings: Opportunities for urinary bag producers lie in offering users many effective and convenient solutions while receiving regulatory support.
  • Expansion into Developing Markets: Key manufacturers can target developing nations as attractive investment markets for expanding their product portfolios and distribution networks.

Hollister's Distribution Center: In 2018, Hollister Incorporated opened a new distribution center in the Netherlands, enhancing its distribution capabilities.

  • Opportunities in Developing Countries: Rising healthcare spending and increasing awareness among physicians and patients in countries like China, Russia, and India create significant opportunities for global market players.
  • Urinary Incontinence Prevalence: According to William Beaumont Hospital, urinary incontinence affects over 17% of Thailand's geriatric population and 13% in the Philippines, India, and South Korea.
  • Market Growth Drivers: The global market is expected to witness growth due to increased market consolidation activities, including product launches, mergers and acquisitions, and product agreements.

How Market Players are Gaining from Rising Cases of Chronic Ailments?

Urinary incontinence issues are very common in people over 40 years of age, according to a study released by the National Association for Continence in 2017. The condition leads to a low quality of life and an increased risk of morbidity. Various apps and marketing campaigns are being used by market players to raise awareness about urinary bags.

  • Expanding Target Market: The increasing prevalence of chronic ailments, such as diabetes, urinary incontinence, and neurological disorders, has expanded the target market for market players. With a large pool of potential customers in need of urinary management solutions, players in the market have a growing customer base to serve.
  • Diverse Product Offerings: Market players have developed a wide range of urinary bags to cater to the specific needs of patients with different chronic ailments. These include bags with various capacities, materials, and features, such as anti-reflux valves and odor control mechanisms. Moreover, offering a diverse product portfolio allows market players to meet the unique requirements of patients, enhancing their market competitiveness.
  • Technological Innovations: Market players are investing in research and development to introduce innovative technologies in urinary bags. This includes advancements such as wireless monitoring systems, smart sensors, and self-catheterization devices. Additionally, technological innovations not only improve the functionality and usability of urinary bags but also contribute to better disease management and patient outcomes.
  • Collaborations with Healthcare Professionals: Key players are collaborating with healthcare professionals, including physicians, nurses, and urologists, to gain insights into patient needs and develop tailored urinary bag solutions. These collaborations enable key players to design products that are effective, user-friendly, and aligned with the preferences and recommendations of healthcare professionals.
  • Patient Education and Awareness: Market players are actively involved in patient education and awareness programs to increase knowledge about urinary management and the benefits of using urinary bags. By providing information on the importance of proper management and the role of urinary bags in improving quality of life, market players create a great demand for their products.
  • Geographic Expansion: Rising cases of chronic ailments are not limited to specific regions. Key players are expanding their geographical presence to tap into new markets with a high prevalence of chronic diseases. This includes targeting emerging economies with growing healthcare infrastructure and rising healthcare expenditure.
Attributes Details
Urinary Bag Market Size (2023) US$ 1,899.3 million
Urinary Bag Market Projected Size (2033) US$ 2,911.7 million
Urinary Bag Market Value-based CAGR (2023 to 2033) 4.4%

Don't pay for what you don't need

Customize your report by selecting specific countries or regions and save 30%!

2023 to 2033 Urinary Bag Market Outlook In Comparison to 2018 to 2022 Historical Sales

The global urinary bag market expanded at a moderate CAGR of over 4.1% between 2018 and 2022. Continual growth in healthcare expenditure, particularly in developing economies, improves access to healthcare services and urinary management solutions. Increased investment in healthcare infrastructure is likely to drive the demand for urinary bags.

Ongoing advancements in urinary bag technology, including the incorporation of innovative features and materials, enhance product performance, patient comfort, and infection prevention. These advancements greatly contribute to increased adoption and market growth.

Leading companies are actively participating in partnerships, collaborations, and mergers and acquisitions to expand their product portfolio. Furthermore, the availability of advanced urinary bag products has also increased with the number of visits for cancer treatments in hospitals. Such factors are expected to create opportunities for the expansion of the urinary bag market over the forecast period, which is projected to expand at a CAGR of 4.4% from 2023 to 2033.

Comparative View of the Market

Urinary Bag Market:

Attributes Urinary Bag Market
CAGR (2023 to 2033) 4.4%
Market Value (2033) US$ 2,911.7 million
Opportunity As many patients opt for in-home care, there is a rising demand for urinary bags that are suitable for home use. Market players can seize this opportunity by developing urinary bags specifically designed for easy and convenient use in home healthcare settings.
Key Trends A key trend in the urinary bag market is the increasing demand for compact and portable urinary bags, driven by the desire for improved mobility and convenience, particularly for individuals who are active or on the move.

Urinary Antibacterial and Antiseptic Pharmaceuticals Market:

Attributes Urinary Antibacterial and Antiseptic Pharmaceuticals Market
CAGR (2023 to 2033) 4.2%
Market Value (2033) US$ 70 billion
Opportunity The integration of advanced drug delivery technologies. The development and incorporation of innovative drug delivery systems can enhance the effectiveness and convenience of urinary antibacterial and antiseptic treatments.
Key Trends Growing focus on combination therapies, where combination therapies involve the simultaneous use of multiple antibacterial or antiseptic agents to target different pathogens or mechanisms of action.

Urinary Collection Device Market:

Attributes Urinary Collection Device Market
CAGR (2023 to 2033) 5.1%
Market Value (2033) US$ 4.5 billion
Opportunity As the demand for patient comfort and ease of use continues to rise, there is a growing need for urinary collection devices that minimize discomfort, simplify the collection process, and enhance the overall patient experience.
Key Trends The integration of digital and connected technologies is transforming the urinary collection device landscape, leading to the emergence of smart and connected urine collection devices.
Sabyasachi Ghosh
Sabyasachi Ghosh

Principal Consultant

Talk to Analyst

Find your sweet spots for generating winning opportunities in this market.

Country-wise Insights

What Makes the United States of America the Core Market for Urinary Bags?

The market in the United States of America accounts for more than 90% of North America market, where the market for urinary bags in North America was predicted to amass revenue of 34.5% in 2022.

The healthcare system of the United States of America is well-known for its infrastructure and spending and the same can be attributed to the country’s value share of 31.8% in 2022.

Applications in cancer care centers and hospitals are influenced by regulations and insurance policies, which in turn accelerates the growth of the market in the country.

Government and regulatory authorities in the United States of America are implementing several cost-containment plans to ease the burden on the healthcare sector.

The United States of America government is actively taking initiatives to encourage various research activities for the development and treatment of urinary diseases. Telefex completed two large-scale acquisitions: NeoTract, Inc. (NeoTract) and Vascular Solutions, Inc. (Vascular Solutions).

Why is the Demand for Urinary Bags Increasing in Germany?

Germany held a share of 9.5% in 2022 and is expected to advance at a steady pace in the coming years.

Germany is one of the world’s leading production hubs for pharmaceutical and healthcare products. Manufacturers in the country have created a competitive environment by developing products and leveraging cutting-edge research for functionality improvements.

The manufacturers are constantly investing in operation expansions that enable companies to optimize research and development, resulting in a promising product pipeline. Moreover, the prioritization of areas with high patient needs and working toward the development of innovative products is likely to generate substantial returns.

Which Role is Product Innovation Playing in the United Kingdom?

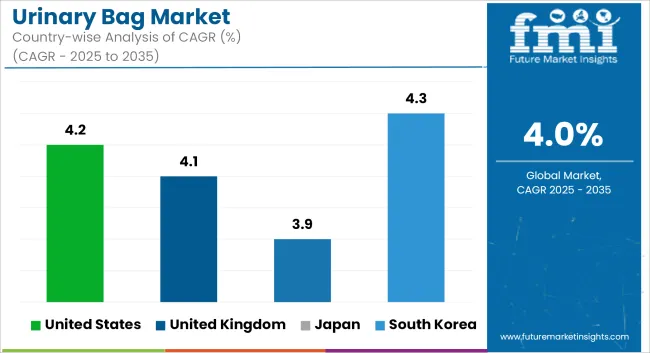
The United Kingdom market is expected to secure a 4.4% CAGR from 2023 to 2033. The United Kingdom’s healthcare system is largely funded by the government. It is considered one of the most successful healthcare systems in the world.

According to FMI’s analysis, the United Kingdom is identified as the leading market among the countries of Europe. Furthermore, rising research efforts, increasing pipeline drugs, and the presence of several key players create a huge opportunity for urinary bag producers in the country.

What Factors Make China a Notable Market for Urinary Bags?

The market in China is projected to expand at a CAGR of 4.4% during the forecast period. China is the second-large pharmaceutical market in the world. It is significantly growing based on two main factors such as large-scale capital investment and rapid productivity growth. These two factors have projected the country as an appealing destination for foreign investments and large domestic savings.

The country has been transforming from being a low economy to a market-oriented country since the 1970s. With the growth in medical tourism, the sales prospects of urinary bags are likely to remain positive for the foreseeable future.

How is the Increasing Focus on Research Surge Demand for Urinary Bags in India?

India accounts for more than 50% of the South Asia urinary bag industry. In recent years, pharmaceutical companies in India have hugely invested in research operations. The demand for urinary bags is likely to grow, with significant impetus from the ongoing covid-19 pandemic.

As per FMI, the market for urinary bags in India is poised to expand at a rate of 6.9% from 2023 to 2033. Public-private partnerships have become a leading business in India due to factors such as the presence of government-funded pharmaceutical and medical institutions with advanced facilities for clinical trials. Moreover, manufacturers in India are expanding their businesses by exporting their products to various other countries, which proves to be beneficial for India’s market.

Category-wise Insights

Why the Demand for Drainage Bags is a Key Revenue Driver?

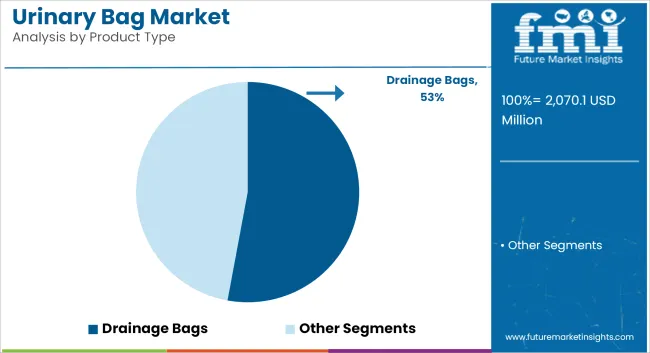
Based on urinary bag products, drainage bags are leading the market and held a market share of over 52.24% in 2022.

Various surgical interventions, such as urological surgeries, abdominal surgeries, and pelvic surgeries, often require temporary or permanent urinary drainage. The increasing number of surgical procedures performed globally contributes to the demand for drainage bags.

There is a growing trend toward home healthcare and long-term care for individuals with chronic illnesses or disabilities. These settings often require urinary drainage bags for patients who prefer to receive care at home, further driving the demand for these products.

Why is the Demand for 1000 ml Capacity Urinary Bags on the Rise?

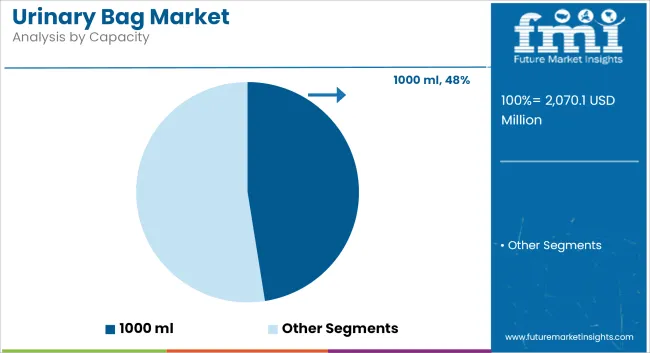
Based on capacity, 1000 ml capacity urine bags are preferred since it allows for easy movement of patients with sufficient quantity. This helps the patient to move freely without significant addition of weight. As a result, the demand for 1000 ml capacity urine bags held a 35.09% value share in 2022, according to FMI.

The larger capacity of 1000 ml capacity urine bags can help reduce the feeling of fullness and discomfort experienced by patients with high urine output. It allows for efficient urine collection, preventing overflow or leakage, and providing improved comfort throughout the day or night.

Why are Disposable Urinary Bags Preferred over Reusable Options?

Disposable urinary bags accounted for more than 75.9% of the global market share in 2022. These products offer satisfaction to users with a low risk of infectious diseases.

Users also choose disposable urinary drainage bags owing to ease of use. In the case of reusable bags, careful cleaning and disinfection according to FDA guidelines are critical to prevent infection transfer from one patient to the next. Since the risk of infection transmission is low with disposable urinary drainage bags, healthcare professionals tend to prefer them over normal urinary bags, swaying the share of the sub-segment.

How Do the Urinary Bags for Adults Fare?

Adult urinary bags accounted for more than 92.1% of the global market share in 2022. Overactive bladders and urinary urgency are most common in people over 40 years of age, according to a study released by the National Association for Continence in 2017.

The adult segment is anticipated to grow significantly during the forecast period, reflecting notable growth than pediatric products.

What is the Market Share of Hospitals in the Urinary Bag Industry?

Urinary bag consumption by hospitals amassed a revenue share of 40.2% in 2022 as hospitals are highly preferred for patient care for ulcerative colitis and inflammatory bowel disease (IBD), especially among geriatrics. These diseases are common in developed economies, with high penetration in urban areas.

The COVID-19 epidemic has increased hospital admission rates all over the world, which in turn has bolstered urinary bag requirements.

How Intense is the Competition in the Urinary Bag Market?

The urinary bag market is consolidated in nature, with the presence of leading players operating in this space. The focus is primarily on research & development activities mainly for urinary retention, urine incontinence, and urological or gynecological surgeries.

Market players are also engaged in the expansion of global and regional presence through acquisitions, expansions, product launches, and improvement of distribution channels.

Get the data you need at a Fraction of the cost

Personalize your report by choosing insights you need
and save 40%!

Key Players Working in the Urinary Bag Market

  • Medline Industries, Inc.
  • Cardinal Health, Inc.
  • Hollister Incorporated
  • Teleflex Incorporated
  • Cook Medical
  • Moore Medical LLC
  • Mckesson Medical-Surgical Inc.
  • Arcus Medical LLc
  • Urocare
  • Covidien
  • Coloplast A/S
  • B. Braun
  • Romsons
  • Poly Medicure Limited
  • G.Surgiwear Ltd
  • Kiefel Medical
  • Jolfamar
  • UROMED
  • Wujiang Evergreen Ex/Im Co. Ltd
  • Leboo Healthcare Products Limited
  • C. R. Bard, Inc.

Developments in the market:

  • In August 2020, Volymi announced the launch of new smart catheter bags for patients with limited mobility capabilities. The bag incorporates an alert system that uses external sensors, which can be linked to a smartphone app.
  • In June 2019, Spinal Singularity developed a connected catheter device with supply chain support from Trelleborg, aimed toward applications for patients suffering from neurogenic bladders and chronic urinary retention.
  • BD completed the acquisition of Bard to create a medical technology company. It is uniquely positioned to improve both the treatment of disease for patients and the process of care for healthcare providers.

Key Segmentation

By Product Type:

  • Drainage Bags
  • Leg Bags
  • Large Capacity Bags
  • Belly Bags

By Capacity:

  • Less than 500 ml
  • 500 ml
  • 1000 ml
  • 2000 ml
  • 4000 ml

By Usage:

  • Reusable Urinary Bags
  • Disposable Urinary Bags

By Patient Age:

  • Pediatric
  • Adult

By End User:

  • Hospitals
  • Clinics
  • Ambulatory Surgical Centers
  • Long Term Care Centers
  • Home Care

By Region:

  • North America
  • Latin America
  • Europe
  • South Asia
  • East Asia
  • Oceania
  • The Middle East and Africa

Frequently Asked Questions

Which region holds high lucrativeness in urinary bag market?

Asia Pacific is projected to emerge as a lucrative market for urinary bags.

What is the growth potential of the urinary bag market?

The growth potential of the urinary bag market is 4.4% through 2033.

What limits the growth potential of the market?

The high cost of adoption is likely to limit market growth.

What is North America's expected share in 2023?

North America is likely to generate 15% revenue in 2023.

How big will the market be in 2033?

The market will generate revenue of US$ 2,911.7 million in 2033.

Table of Content

1. Executive Summary

    1.1. Global Market Outlook

    1.2. Demand-side Trends

    1.3. Supply-side Trends

    1.4. Technology Roadmap Analysis

    1.5. Analysis and Recommendations

2. Market Overview

    2.1. Market Coverage / Taxonomy

    2.2. Market Definition / Scope / Limitations

3. Market Background

    3.1. Market Dynamics

        3.1.1. Drivers

        3.1.2. Restraints

        3.1.3. Opportunity

        3.1.4. Trends

    3.2. Scenario Forecast

        3.2.1. Demand in Optimistic Scenario

        3.2.2. Demand in Likely Scenario

        3.2.3. Demand in Conservative Scenario

    3.3. Opportunity Map Analysis

    3.4. Product Life Cycle Analysis

    3.5. Supply Chain Analysis

        3.5.1. Supply Side Participants and their Roles

            3.5.1.1. Producers

            3.5.1.2. Mid-Level Participants (Traders/ Agents/ Brokers)

            3.5.1.3. Wholesalers and Distributors

        3.5.2. Value Added and Value Created at Node in the Supply Chain

        3.5.3. List of Raw Material Suppliers

        3.5.4. List of Existing and Potential Buyer’s

    3.6. Investment Feasibility Matrix

    3.7. Value Chain Analysis

        3.7.1. Profit Margin Analysis

        3.7.2. Wholesalers and Distributors

        3.7.3. Retailers

    3.8. PESTLE and Porter’s Analysis

    3.9. Regulatory Landscape

        3.9.1. By Key Regions

        3.9.2. By Key Countries

    3.10. Regional Parent Market Outlook

    3.11. Production and Consumption Statistics

    3.12. Import and Export Statistics

4. Global Market Analysis 2018 to 2022 and Forecast, 2023 to 2033

    4.1. Historical Market Size Value (US$ Million) & Volume (Units) Analysis, 2018 to 2022

    4.2. Current and Future Market Size Value (US$ Million) & Volume (Units) Projections, 2023 to 2033

        4.2.1. Y-o-Y Growth Trend Analysis

        4.2.2. Absolute $ Opportunity Analysis

5. Global Market Analysis 2018 to 2022 and Forecast 2023 to 2033, By Product

    5.1. Introduction / Key Findings

    5.2. Historical Market Size Value (US$ Million) & Volume (Units) Analysis By Product, 2018 to 2022

    5.3. Current and Future Market Size Value (US$ Million) & Volume (Units) Analysis and Forecast By Product, 2023 to 2033

        5.3.1. Large Bags

        5.3.2. Leg Bags

    5.4. Y-o-Y Growth Trend Analysis By Product, 2018 to 2022

    5.5. Absolute $ Opportunity Analysis By Product, 2023 to 2033

6. Global Market Analysis 2018 to 2022 and Forecast 2023 to 2033, By Usage

    6.1. Introduction / Key Findings

    6.2. Historical Market Size Value (US$ Million) & Volume (Units) Analysis By Usage, 2018 to 2022

    6.3. Current and Future Market Size Value (US$ Million) & Volume (Units) Analysis and Forecast By Usage, 2023 to 2033

        6.3.1. Reusable

        6.3.2. Disposable

    6.4. Y-o-Y Growth Trend Analysis By Usage, 2018 to 2022

    6.5. Absolute $ Opportunity Analysis By Usage, 2023 to 2033

7. Global Market Analysis 2018 to 2022 and Forecast 2023 to 2033, By Capacity

    7.1. Introduction / Key Findings

    7.2. Historical Market Size Value (US$ Million) & Volume (Units) Analysis By Capacity, 2018 to 2022

    7.3. Current and Future Market Size Value (US$ Million) & Volume (Units) Analysis and Forecast By Capacity, 2023 to 2033

        7.3.1. Upto 500 ml

        7.3.2. 500-1000 ml

        7.3.3. Above 1000 ml

    7.4. Y-o-Y Growth Trend Analysis By Capacity, 2018 to 2022

    7.5. Absolute $ Opportunity Analysis By Capacity, 2023 to 2033

8. Global Market Analysis 2018 to 2022 and Forecast 2023 to 2033, By End User

    8.1. Introduction / Key Findings

    8.2. Historical Market Size Value (US$ Million) & Volume (Units) Analysis By End User, 2018 to 2022

    8.3. Current and Future Market Size Value (US$ Million) & Volume (Units) Analysis and Forecast By End User, 2023 to 2033

        8.3.1. Hospitals and Clinics

        8.3.2. Others

    8.4. Y-o-Y Growth Trend Analysis By End User, 2018 to 2022

    8.5. Absolute $ Opportunity Analysis By End User, 2023 to 2033

9. Global Market Analysis 2018 to 2022 and Forecast 2023 to 2033, By Region

    9.1. Introduction

    9.2. Historical Market Size Value (US$ Million) & Volume (Units) Analysis By Region, 2018 to 2022

    9.3. Current Market Size Value (US$ Million) & Volume (Units) Analysis and Forecast By Region, 2023 to 2033

        9.3.1. North America

        9.3.2. Latin America

        9.3.3. Europe

        9.3.4. Asia Pacific

        9.3.5. MEA

    9.4. Market Attractiveness Analysis By Region

10. North America Market Analysis 2018 to 2022 and Forecast 2023 to 2033, By Country

    10.1. Historical Market Size Value (US$ Million) & Volume (Units) Trend Analysis By Market Taxonomy, 2018 to 2022

    10.2. Market Size Value (US$ Million) & Volume (Units) Forecast By Market Taxonomy, 2023 to 2033

        10.2.1. By Country

            10.2.1.1. USA

            10.2.1.2. Canada

        10.2.2. By Product

        10.2.3. By Usage

        10.2.4. By Capacity

        10.2.5. By End User

    10.3. Market Attractiveness Analysis

        10.3.1. By Country

        10.3.2. By Product

        10.3.3. By Usage

        10.3.4. By Capacity

        10.3.5. By End User

    10.4. Key Takeaways

11. Latin America Market Analysis 2018 to 2022 and Forecast 2023 to 2033, By Country

    11.1. Historical Market Size Value (US$ Million) & Volume (Units) Trend Analysis By Market Taxonomy, 2018 to 2022

    11.2. Market Size Value (US$ Million) & Volume (Units) Forecast By Market Taxonomy, 2023 to 2033

        11.2.1. By Country

            11.2.1.1. Brazil

            11.2.1.2. Mexico

            11.2.1.3. Rest of Latin America

        11.2.2. By Product

        11.2.3. By Usage

        11.2.4. By Capacity

        11.2.5. By End User

    11.3. Market Attractiveness Analysis

        11.3.1. By Country

        11.3.2. By Product

        11.3.3. By Usage

        11.3.4. By Capacity

        11.3.5. By End User

    11.4. Key Takeaways

12. Europe Market Analysis 2018 to 2022 and Forecast 2023 to 2033, By Country

    12.1. Historical Market Size Value (US$ Million) & Volume (Units) Trend Analysis By Market Taxonomy, 2018 to 2022

    12.2. Market Size Value (US$ Million) & Volume (Units) Forecast By Market Taxonomy, 2023 to 2033

        12.2.1. By Country

            12.2.1.1. Germany

            12.2.1.2. UK

            12.2.1.3. France

            12.2.1.4. Spain

            12.2.1.5. Italy

            12.2.1.6. Rest of Europe

        12.2.2. By Product

        12.2.3. By Usage

        12.2.4. By Capacity

        12.2.5. By End User

    12.3. Market Attractiveness Analysis

        12.3.1. By Country

        12.3.2. By Product

        12.3.3. By Usage

        12.3.4. By Capacity

        12.3.5. By End User

    12.4. Key Takeaways

13. Asia Pacific Market Analysis 2018 to 2022 and Forecast 2023 to 2033, By Country

    13.1. Historical Market Size Value (US$ Million) & Volume (Units) Trend Analysis By Market Taxonomy, 2018 to 2022

    13.2. Market Size Value (US$ Million) & Volume (Units) Forecast By Market Taxonomy, 2023 to 2033

        13.2.1. By Country

            13.2.1.1. China

            13.2.1.2. Japan

            13.2.1.3. South Korea

            13.2.1.4. Singapore

            13.2.1.5. Thailand

            13.2.1.6. Indonesia

            13.2.1.7. Australia

            13.2.1.8. New Zealand

            13.2.1.9. Rest of Asia Pacific

        13.2.2. By Product

        13.2.3. By Usage

        13.2.4. By Capacity

        13.2.5. By End User

    13.3. Market Attractiveness Analysis

        13.3.1. By Country

        13.3.2. By Product

        13.3.3. By Usage

        13.3.4. By Capacity

        13.3.5. By End User

    13.4. Key Takeaways

14. MEA Market Analysis 2018 to 2022 and Forecast 2023 to 2033, By Country

    14.1. Historical Market Size Value (US$ Million) & Volume (Units) Trend Analysis By Market Taxonomy, 2018 to 2022

    14.2. Market Size Value (US$ Million) & Volume (Units) Forecast By Market Taxonomy, 2023 to 2033

        14.2.1. By Country

            14.2.1.1. GCC Countries

            14.2.1.2. South Africa

            14.2.1.3. Israel

            14.2.1.4. Rest of MEA

        14.2.2. By Product

        14.2.3. By Usage

        14.2.4. By Capacity

        14.2.5. By End User

    14.3. Market Attractiveness Analysis

        14.3.1. By Country

        14.3.2. By Product

        14.3.3. By Usage

        14.3.4. By Capacity

        14.3.5. By End User

    14.4. Key Takeaways

15. Key Countries Market Analysis

    15.1. USA

        15.1.1. Pricing Analysis

        15.1.2. Market Share Analysis, 2022

            15.1.2.1. By Product

            15.1.2.2. By Usage

            15.1.2.3. By Capacity

            15.1.2.4. By End User

    15.2. Canada

        15.2.1. Pricing Analysis

        15.2.2. Market Share Analysis, 2022

            15.2.2.1. By Product

            15.2.2.2. By Usage

            15.2.2.3. By Capacity

            15.2.2.4. By End User

    15.3. Brazil

        15.3.1. Pricing Analysis

        15.3.2. Market Share Analysis, 2022

            15.3.2.1. By Product

            15.3.2.2. By Usage

            15.3.2.3. By Capacity

            15.3.2.4. By End User

    15.4. Mexico

        15.4.1. Pricing Analysis

        15.4.2. Market Share Analysis, 2022

            15.4.2.1. By Product

            15.4.2.2. By Usage

            15.4.2.3. By Capacity

            15.4.2.4. By End User

    15.5. Germany

        15.5.1. Pricing Analysis

        15.5.2. Market Share Analysis, 2022

            15.5.2.1. By Product

            15.5.2.2. By Usage

            15.5.2.3. By Capacity

            15.5.2.4. By End User

    15.6. UK

        15.6.1. Pricing Analysis

        15.6.2. Market Share Analysis, 2022

            15.6.2.1. By Product

            15.6.2.2. By Usage

            15.6.2.3. By Capacity

            15.6.2.4. By End User

    15.7. France

        15.7.1. Pricing Analysis

        15.7.2. Market Share Analysis, 2022

            15.7.2.1. By Product

            15.7.2.2. By Usage

            15.7.2.3. By Capacity

            15.7.2.4. By End User

    15.8. Spain

        15.8.1. Pricing Analysis

        15.8.2. Market Share Analysis, 2022

            15.8.2.1. By Product

            15.8.2.2. By Usage

            15.8.2.3. By Capacity

            15.8.2.4. By End User

    15.9. Italy

        15.9.1. Pricing Analysis

        15.9.2. Market Share Analysis, 2022

            15.9.2.1. By Product

            15.9.2.2. By Usage

            15.9.2.3. By Capacity

            15.9.2.4. By End User

    15.10. China

        15.10.1. Pricing Analysis

        15.10.2. Market Share Analysis, 2022

            15.10.2.1. By Product

            15.10.2.2. By Usage

            15.10.2.3. By Capacity

            15.10.2.4. By End User

    15.11. Japan

        15.11.1. Pricing Analysis

        15.11.2. Market Share Analysis, 2022

            15.11.2.1. By Product

            15.11.2.2. By Usage

            15.11.2.3. By Capacity

            15.11.2.4. By End User

    15.12. South Korea

        15.12.1. Pricing Analysis

        15.12.2. Market Share Analysis, 2022

            15.12.2.1. By Product

            15.12.2.2. By Usage

            15.12.2.3. By Capacity

            15.12.2.4. By End User

    15.13. Singapore

        15.13.1. Pricing Analysis

        15.13.2. Market Share Analysis, 2022

            15.13.2.1. By Product

            15.13.2.2. By Usage

            15.13.2.3. By Capacity

            15.13.2.4. By End User

    15.14. Thailand

        15.14.1. Pricing Analysis

        15.14.2. Market Share Analysis, 2022

            15.14.2.1. By Product

            15.14.2.2. By Usage

            15.14.2.3. By Capacity

            15.14.2.4. By End User

    15.15. Indonesia

        15.15.1. Pricing Analysis

        15.15.2. Market Share Analysis, 2022

            15.15.2.1. By Product

            15.15.2.2. By Usage

            15.15.2.3. By Capacity

            15.15.2.4. By End User

    15.16. Australia

        15.16.1. Pricing Analysis

        15.16.2. Market Share Analysis, 2022

            15.16.2.1. By Product

            15.16.2.2. By Usage

            15.16.2.3. By Capacity

            15.16.2.4. By End User

    15.17. New Zealand

        15.17.1. Pricing Analysis

        15.17.2. Market Share Analysis, 2022

            15.17.2.1. By Product

            15.17.2.2. By Usage

            15.17.2.3. By Capacity

            15.17.2.4. By End User

    15.18. GCC Countries

        15.18.1. Pricing Analysis

        15.18.2. Market Share Analysis, 2022

            15.18.2.1. By Product

            15.18.2.2. By Usage

            15.18.2.3. By Capacity

            15.18.2.4. By End User

    15.19. South Africa

        15.19.1. Pricing Analysis

        15.19.2. Market Share Analysis, 2022

            15.19.2.1. By Product

            15.19.2.2. By Usage

            15.19.2.3. By Capacity

            15.19.2.4. By End User

    15.20. Israel

        15.20.1. Pricing Analysis

        15.20.2. Market Share Analysis, 2022

            15.20.2.1. By Product

            15.20.2.2. By Usage

            15.20.2.3. By Capacity

            15.20.2.4. By End User

16. Market Structure Analysis

    16.1. Competition Dashboard

    16.2. Competition Benchmarking

    16.3. Market Share Analysis of Top Players

        16.3.1. By Regional

        16.3.2. By Product

        16.3.3. By Usage

        16.3.4. By Capacity

        16.3.5. By End User

17. Competition Analysis

    17.1. Competition Deep Dive

        17.1.1. Medline Industries, Inc.

            17.1.1.1. Overview

            17.1.1.2. Product Portfolio

            17.1.1.3. Profitability by Market Segments

            17.1.1.4. Sales Footprint

            17.1.1.5. Strategy Overview

                17.1.1.5.1. Marketing Strategy

                17.1.1.5.2. Product Strategy

                17.1.1.5.3. Channel Strategy

        17.1.2. Cardinal Health, Inc.

            17.1.2.1. Overview

            17.1.2.2. Product Portfolio

            17.1.2.3. Profitability by Market Segments

            17.1.2.4. Sales Footprint

            17.1.2.5. Strategy Overview

                17.1.2.5.1. Marketing Strategy

                17.1.2.5.2. Product Strategy

                17.1.2.5.3. Channel Strategy

        17.1.3. Hollister Incorporated

            17.1.3.1. Overview

            17.1.3.2. Product Portfolio

            17.1.3.3. Profitability by Market Segments

            17.1.3.4. Sales Footprint

            17.1.3.5. Strategy Overview

                17.1.3.5.1. Marketing Strategy

                17.1.3.5.2. Product Strategy

                17.1.3.5.3. Channel Strategy

        17.1.4. Teleflex Incorporated

            17.1.4.1. Overview

            17.1.4.2. Product Portfolio

            17.1.4.3. Profitability by Market Segments

            17.1.4.4. Sales Footprint

            17.1.4.5. Strategy Overview

                17.1.4.5.1. Marketing Strategy

                17.1.4.5.2. Product Strategy

                17.1.4.5.3. Channel Strategy

        17.1.5. Cook Medical

            17.1.5.1. Overview

            17.1.5.2. Product Portfolio

            17.1.5.3. Profitability by Market Segments

            17.1.5.4. Sales Footprint

            17.1.5.5. Strategy Overview

                17.1.5.5.1. Marketing Strategy

                17.1.5.5.2. Product Strategy

                17.1.5.5.3. Channel Strategy

        17.1.6. Moore Medical LLc

            17.1.6.1. Overview

            17.1.6.2. Product Portfolio

            17.1.6.3. Profitability by Market Segments

            17.1.6.4. Sales Footprint

            17.1.6.5. Strategy Overview

                17.1.6.5.1. Marketing Strategy

                17.1.6.5.2. Product Strategy

                17.1.6.5.3. Channel Strategy

        17.1.7. Mckesson Medical-Surgical Inc.

            17.1.7.1. Overview

            17.1.7.2. Product Portfolio

            17.1.7.3. Profitability by Market Segments

            17.1.7.4. Sales Footprint

            17.1.7.5. Strategy Overview

                17.1.7.5.1. Marketing Strategy

                17.1.7.5.2. Product Strategy

                17.1.7.5.3. Channel Strategy

        17.1.8. Arcus Medical LLc

            17.1.8.1. Overview

            17.1.8.2. Product Portfolio

            17.1.8.3. Profitability by Market Segments

            17.1.8.4. Sales Footprint

            17.1.8.5. Strategy Overview

                17.1.8.5.1. Marketing Strategy

                17.1.8.5.2. Product Strategy

                17.1.8.5.3. Channel Strategy

        17.1.9. Urocare

            17.1.9.1. Overview

            17.1.9.2. Product Portfolio

            17.1.9.3. Profitability by Market Segments

            17.1.9.4. Sales Footprint

            17.1.9.5. Strategy Overview

                17.1.9.5.1. Marketing Strategy

                17.1.9.5.2. Product Strategy

                17.1.9.5.3. Channel Strategy

        17.1.10. Covidien

            17.1.10.1. Overview

            17.1.10.2. Product Portfolio

            17.1.10.3. Profitability by Market Segments

            17.1.10.4. Sales Footprint

            17.1.10.5. Strategy Overview

                17.1.10.5.1. Marketing Strategy

                17.1.10.5.2. Product Strategy

                17.1.10.5.3. Channel Strategy

        17.1.11. Coloplast A/S

            17.1.11.1. Overview

            17.1.11.2. Product Portfolio

            17.1.11.3. Profitability by Market Segments

            17.1.11.4. Sales Footprint

            17.1.11.5. Strategy Overview

                17.1.11.5.1. Marketing Strategy

                17.1.11.5.2. Product Strategy

                17.1.11.5.3. Channel Strategy

        17.1.12. B. Braun

            17.1.12.1. Overview

            17.1.12.2. Product Portfolio

            17.1.12.3. Profitability by Market Segments

            17.1.12.4. Sales Footprint

            17.1.12.5. Strategy Overview

                17.1.12.5.1. Marketing Strategy

                17.1.12.5.2. Product Strategy

                17.1.12.5.3. Channel Strategy

        17.1.13. Romsons

            17.1.13.1. Overview

            17.1.13.2. Product Portfolio

            17.1.13.3. Profitability by Market Segments

            17.1.13.4. Sales Footprint

            17.1.13.5. Strategy Overview

                17.1.13.5.1. Marketing Strategy

                17.1.13.5.2. Product Strategy

                17.1.13.5.3. Channel Strategy

        17.1.14. Poly Medicure Limited

            17.1.14.1. Overview

            17.1.14.2. Product Portfolio

            17.1.14.3. Profitability by Market Segments

            17.1.14.4. Sales Footprint

            17.1.14.5. Strategy Overview

                17.1.14.5.1. Marketing Strategy

                17.1.14.5.2. Product Strategy

                17.1.14.5.3. Channel Strategy

        17.1.15. G.Surgiwear Ltd

            17.1.15.1. Overview

            17.1.15.2. Product Portfolio

            17.1.15.3. Profitability by Market Segments

            17.1.15.4. Sales Footprint

            17.1.15.5. Strategy Overview

                17.1.15.5.1. Marketing Strategy

                17.1.15.5.2. Product Strategy

                17.1.15.5.3. Channel Strategy

        17.1.16. Kiefel Medical

            17.1.16.1. Overview

            17.1.16.2. Product Portfolio

            17.1.16.3. Profitability by Market Segments

            17.1.16.4. Sales Footprint

            17.1.16.5. Strategy Overview

                17.1.16.5.1. Marketing Strategy

                17.1.16.5.2. Product Strategy

                17.1.16.5.3. Channel Strategy

        17.1.17. Jolfamar

            17.1.17.1. Overview

            17.1.17.2. Product Portfolio

            17.1.17.3. Profitability by Market Segments

            17.1.17.4. Sales Footprint

            17.1.17.5. Strategy Overview

                17.1.17.5.1. Marketing Strategy

                17.1.17.5.2. Product Strategy

                17.1.17.5.3. Channel Strategy

        17.1.18. UROMED

            17.1.18.1. Overview

            17.1.18.2. Product Portfolio

            17.1.18.3. Profitability by Market Segments

            17.1.18.4. Sales Footprint

            17.1.18.5. Strategy Overview

                17.1.18.5.1. Marketing Strategy

                17.1.18.5.2. Product Strategy

                17.1.18.5.3. Channel Strategy

        17.1.19. Wujiang Evergreen Ex/Im Co. Ltd

            17.1.19.1. Overview

            17.1.19.2. Product Portfolio

            17.1.19.3. Profitability by Market Segments

            17.1.19.4. Sales Footprint

            17.1.19.5. Strategy Overview

                17.1.19.5.1. Marketing Strategy

                17.1.19.5.2. Product Strategy

                17.1.19.5.3. Channel Strategy

        17.1.20. Leboo Healthcare Products Limited

            17.1.20.1. Overview

            17.1.20.2. Product Portfolio

            17.1.20.3. Profitability by Market Segments

            17.1.20.4. Sales Footprint

            17.1.20.5. Strategy Overview

                17.1.20.5.1. Marketing Strategy

                17.1.20.5.2. Product Strategy

                17.1.20.5.3. Channel Strategy

18. Assumptions & Acronyms Used

19. Research Methodology

Don't pay for what you don't need

Customize your report by selecting specific countries or regions and save 30%!

List of Tables

Table 1: Global Market Value (US$ Million) Forecast by Region, 2018 to 2033

Table 2: Global Market Volume (Units) Forecast by Region, 2018 to 2033

Table 3: Global Market Value (US$ Million) Forecast by Product, 2018 to 2033

Table 4: Global Market Volume (Units) Forecast by Product, 2018 to 2033

Table 5: Global Market Value (US$ Million) Forecast by Usage, 2018 to 2033

Table 6: Global Market Volume (Units) Forecast by Usage, 2018 to 2033

Table 7: Global Market Value (US$ Million) Forecast by Capacity, 2018 to 2033

Table 8: Global Market Volume (Units) Forecast by Capacity, 2018 to 2033

Table 9: Global Market Value (US$ Million) Forecast by End User, 2018 to 2033

Table 10: Global Market Volume (Units) Forecast by End User, 2018 to 2033

Table 11: North America Market Value (US$ Million) Forecast by Country, 2018 to 2033

Table 12: North America Market Volume (Units) Forecast by Country, 2018 to 2033

Table 13: North America Market Value (US$ Million) Forecast by Product, 2018 to 2033

Table 14: North America Market Volume (Units) Forecast by Product, 2018 to 2033

Table 15: North America Market Value (US$ Million) Forecast by Usage, 2018 to 2033

Table 16: North America Market Volume (Units) Forecast by Usage, 2018 to 2033

Table 17: North America Market Value (US$ Million) Forecast by Capacity, 2018 to 2033

Table 18: North America Market Volume (Units) Forecast by Capacity, 2018 to 2033

Table 19: North America Market Value (US$ Million) Forecast by End User, 2018 to 2033

Table 20: North America Market Volume (Units) Forecast by End User, 2018 to 2033

Table 21: Latin America Market Value (US$ Million) Forecast by Country, 2018 to 2033

Table 22: Latin America Market Volume (Units) Forecast by Country, 2018 to 2033

Table 23: Latin America Market Value (US$ Million) Forecast by Product, 2018 to 2033

Table 24: Latin America Market Volume (Units) Forecast by Product, 2018 to 2033

Table 25: Latin America Market Value (US$ Million) Forecast by Usage, 2018 to 2033

Table 26: Latin America Market Volume (Units) Forecast by Usage, 2018 to 2033

Table 27: Latin America Market Value (US$ Million) Forecast by Capacity, 2018 to 2033

Table 28: Latin America Market Volume (Units) Forecast by Capacity, 2018 to 2033

Table 29: Latin America Market Value (US$ Million) Forecast by End User, 2018 to 2033

Table 30: Latin America Market Volume (Units) Forecast by End User, 2018 to 2033

Table 31: Europe Market Value (US$ Million) Forecast by Country, 2018 to 2033

Table 32: Europe Market Volume (Units) Forecast by Country, 2018 to 2033

Table 33: Europe Market Value (US$ Million) Forecast by Product, 2018 to 2033

Table 34: Europe Market Volume (Units) Forecast by Product, 2018 to 2033

Table 35: Europe Market Value (US$ Million) Forecast by Usage, 2018 to 2033

Table 36: Europe Market Volume (Units) Forecast by Usage, 2018 to 2033

Table 37: Europe Market Value (US$ Million) Forecast by Capacity, 2018 to 2033

Table 38: Europe Market Volume (Units) Forecast by Capacity, 2018 to 2033

Table 39: Europe Market Value (US$ Million) Forecast by End User, 2018 to 2033

Table 40: Europe Market Volume (Units) Forecast by End User, 2018 to 2033

Table 41: Asia Pacific Market Value (US$ Million) Forecast by Country, 2018 to 2033

Table 42: Asia Pacific Market Volume (Units) Forecast by Country, 2018 to 2033

Table 43: Asia Pacific Market Value (US$ Million) Forecast by Product, 2018 to 2033

Table 44: Asia Pacific Market Volume (Units) Forecast by Product, 2018 to 2033

Table 45: Asia Pacific Market Value (US$ Million) Forecast by Usage, 2018 to 2033

Table 46: Asia Pacific Market Volume (Units) Forecast by Usage, 2018 to 2033

Table 47: Asia Pacific Market Value (US$ Million) Forecast by Capacity, 2018 to 2033

Table 48: Asia Pacific Market Volume (Units) Forecast by Capacity, 2018 to 2033

Table 49: Asia Pacific Market Value (US$ Million) Forecast by End User, 2018 to 2033

Table 50: Asia Pacific Market Volume (Units) Forecast by End User, 2018 to 2033

Table 51: MEA Market Value (US$ Million) Forecast by Country, 2018 to 2033

Table 52: MEA Market Volume (Units) Forecast by Country, 2018 to 2033

Table 53: MEA Market Value (US$ Million) Forecast by Product, 2018 to 2033

Table 54: MEA Market Volume (Units) Forecast by Product, 2018 to 2033

Table 55: MEA Market Value (US$ Million) Forecast by Usage, 2018 to 2033

Table 56: MEA Market Volume (Units) Forecast by Usage, 2018 to 2033

Table 57: MEA Market Value (US$ Million) Forecast by Capacity, 2018 to 2033

Table 58: MEA Market Volume (Units) Forecast by Capacity, 2018 to 2033

Table 59: MEA Market Value (US$ Million) Forecast by End User, 2018 to 2033

Table 60: MEA Market Volume (Units) Forecast by End User, 2018 to 2033
Sabyasachi Ghosh
Sabyasachi Ghosh

Principal Consultant

Talk to Analyst

Find your sweet spots for generating winning opportunities in this market.

List of Charts

Figure 1: Global Market Value (US$ Million) by Product, 2023 to 2033

Figure 2: Global Market Value (US$ Million) by Usage, 2023 to 2033

Figure 3: Global Market Value (US$ Million) by Capacity, 2023 to 2033

Figure 4: Global Market Value (US$ Million) by End User, 2023 to 2033

Figure 5: Global Market Value (US$ Million) by Region, 2023 to 2033

Figure 6: Global Market Value (US$ Million) Analysis by Region, 2018 to 2033

Figure 7: Global Market Volume (Units) Analysis by Region, 2018 to 2033

Figure 8: Global Market Value Share (%) and BPS Analysis by Region, 2023 to 2033

Figure 9: Global Market Y-o-Y Growth (%) Projections by Region, 2023 to 2033

Figure 10: Global Market Value (US$ Million) Analysis by Product, 2018 to 2033

Figure 11: Global Market Volume (Units) Analysis by Product, 2018 to 2033

Figure 12: Global Market Value Share (%) and BPS Analysis by Product, 2023 to 2033

Figure 13: Global Market Y-o-Y Growth (%) Projections by Product, 2023 to 2033

Figure 14: Global Market Value (US$ Million) Analysis by Usage, 2018 to 2033

Figure 15: Global Market Volume (Units) Analysis by Usage, 2018 to 2033

Figure 16: Global Market Value Share (%) and BPS Analysis by Usage, 2023 to 2033

Figure 17: Global Market Y-o-Y Growth (%) Projections by Usage, 2023 to 2033

Figure 18: Global Market Value (US$ Million) Analysis by Capacity, 2018 to 2033

Figure 19: Global Market Volume (Units) Analysis by Capacity, 2018 to 2033

Figure 20: Global Market Value Share (%) and BPS Analysis by Capacity, 2023 to 2033

Figure 21: Global Market Y-o-Y Growth (%) Projections by Capacity, 2023 to 2033

Figure 22: Global Market Value (US$ Million) Analysis by End User, 2018 to 2033

Figure 23: Global Market Volume (Units) Analysis by End User, 2018 to 2033

Figure 24: Global Market Value Share (%) and BPS Analysis by End User, 2023 to 2033

Figure 25: Global Market Y-o-Y Growth (%) Projections by End User, 2023 to 2033

Figure 26: Global Market Attractiveness by Product, 2023 to 2033

Figure 27: Global Market Attractiveness by Usage, 2023 to 2033

Figure 28: Global Market Attractiveness by Capacity, 2023 to 2033

Figure 29: Global Market Attractiveness by End User, 2023 to 2033

Figure 30: Global Market Attractiveness by Region, 2023 to 2033

Figure 31: North America Market Value (US$ Million) by Product, 2023 to 2033

Figure 32: North America Market Value (US$ Million) by Usage, 2023 to 2033

Figure 33: North America Market Value (US$ Million) by Capacity, 2023 to 2033

Figure 34: North America Market Value (US$ Million) by End User, 2023 to 2033

Figure 35: North America Market Value (US$ Million) by Country, 2023 to 2033

Figure 36: North America Market Value (US$ Million) Analysis by Country, 2018 to 2033

Figure 37: North America Market Volume (Units) Analysis by Country, 2018 to 2033

Figure 38: North America Market Value Share (%) and BPS Analysis by Country, 2023 to 2033

Figure 39: North America Market Y-o-Y Growth (%) Projections by Country, 2023 to 2033

Figure 40: North America Market Value (US$ Million) Analysis by Product, 2018 to 2033

Figure 41: North America Market Volume (Units) Analysis by Product, 2018 to 2033

Figure 42: North America Market Value Share (%) and BPS Analysis by Product, 2023 to 2033

Figure 43: North America Market Y-o-Y Growth (%) Projections by Product, 2023 to 2033

Figure 44: North America Market Value (US$ Million) Analysis by Usage, 2018 to 2033

Figure 45: North America Market Volume (Units) Analysis by Usage, 2018 to 2033

Figure 46: North America Market Value Share (%) and BPS Analysis by Usage, 2023 to 2033

Figure 47: North America Market Y-o-Y Growth (%) Projections by Usage, 2023 to 2033

Figure 48: North America Market Value (US$ Million) Analysis by Capacity, 2018 to 2033

Figure 49: North America Market Volume (Units) Analysis by Capacity, 2018 to 2033

Figure 50: North America Market Value Share (%) and BPS Analysis by Capacity, 2023 to 2033

Figure 51: North America Market Y-o-Y Growth (%) Projections by Capacity, 2023 to 2033

Figure 52: North America Market Value (US$ Million) Analysis by End User, 2018 to 2033

Figure 53: North America Market Volume (Units) Analysis by End User, 2018 to 2033

Figure 54: North America Market Value Share (%) and BPS Analysis by End User, 2023 to 2033

Figure 55: North America Market Y-o-Y Growth (%) Projections by End User, 2023 to 2033

Figure 56: North America Market Attractiveness by Product, 2023 to 2033

Figure 57: North America Market Attractiveness by Usage, 2023 to 2033

Figure 58: North America Market Attractiveness by Capacity, 2023 to 2033

Figure 59: North America Market Attractiveness by End User, 2023 to 2033

Figure 60: North America Market Attractiveness by Country, 2023 to 2033

Figure 61: Latin America Market Value (US$ Million) by Product, 2023 to 2033

Figure 62: Latin America Market Value (US$ Million) by Usage, 2023 to 2033

Figure 63: Latin America Market Value (US$ Million) by Capacity, 2023 to 2033

Figure 64: Latin America Market Value (US$ Million) by End User, 2023 to 2033

Figure 65: Latin America Market Value (US$ Million) by Country, 2023 to 2033

Figure 66: Latin America Market Value (US$ Million) Analysis by Country, 2018 to 2033

Figure 67: Latin America Market Volume (Units) Analysis by Country, 2018 to 2033

Figure 68: Latin America Market Value Share (%) and BPS Analysis by Country, 2023 to 2033

Figure 69: Latin America Market Y-o-Y Growth (%) Projections by Country, 2023 to 2033

Figure 70: Latin America Market Value (US$ Million) Analysis by Product, 2018 to 2033

Figure 71: Latin America Market Volume (Units) Analysis by Product, 2018 to 2033

Figure 72: Latin America Market Value Share (%) and BPS Analysis by Product, 2023 to 2033

Figure 73: Latin America Market Y-o-Y Growth (%) Projections by Product, 2023 to 2033

Figure 74: Latin America Market Value (US$ Million) Analysis by Usage, 2018 to 2033

Figure 75: Latin America Market Volume (Units) Analysis by Usage, 2018 to 2033

Figure 76: Latin America Market Value Share (%) and BPS Analysis by Usage, 2023 to 2033

Figure 77: Latin America Market Y-o-Y Growth (%) Projections by Usage, 2023 to 2033

Figure 78: Latin America Market Value (US$ Million) Analysis by Capacity, 2018 to 2033

Figure 79: Latin America Market Volume (Units) Analysis by Capacity, 2018 to 2033

Figure 80: Latin America Market Value Share (%) and BPS Analysis by Capacity, 2023 to 2033

Figure 81: Latin America Market Y-o-Y Growth (%) Projections by Capacity, 2023 to 2033

Figure 82: Latin America Market Value (US$ Million) Analysis by End User, 2018 to 2033

Figure 83: Latin America Market Volume (Units) Analysis by End User, 2018 to 2033

Figure 84: Latin America Market Value Share (%) and BPS Analysis by End User, 2023 to 2033

Figure 85: Latin America Market Y-o-Y Growth (%) Projections by End User, 2023 to 2033

Figure 86: Latin America Market Attractiveness by Product, 2023 to 2033

Figure 87: Latin America Market Attractiveness by Usage, 2023 to 2033

Figure 88: Latin America Market Attractiveness by Capacity, 2023 to 2033

Figure 89: Latin America Market Attractiveness by End User, 2023 to 2033

Figure 90: Latin America Market Attractiveness by Country, 2023 to 2033

Figure 91: Europe Market Value (US$ Million) by Product, 2023 to 2033

Figure 92: Europe Market Value (US$ Million) by Usage, 2023 to 2033

Figure 93: Europe Market Value (US$ Million) by Capacity, 2023 to 2033

Figure 94: Europe Market Value (US$ Million) by End User, 2023 to 2033

Figure 95: Europe Market Value (US$ Million) by Country, 2023 to 2033

Figure 96: Europe Market Value (US$ Million) Analysis by Country, 2018 to 2033

Figure 97: Europe Market Volume (Units) Analysis by Country, 2018 to 2033

Figure 98: Europe Market Value Share (%) and BPS Analysis by Country, 2023 to 2033

Figure 99: Europe Market Y-o-Y Growth (%) Projections by Country, 2023 to 2033

Figure 100: Europe Market Value (US$ Million) Analysis by Product, 2018 to 2033

Figure 101: Europe Market Volume (Units) Analysis by Product, 2018 to 2033

Figure 102: Europe Market Value Share (%) and BPS Analysis by Product, 2023 to 2033

Figure 103: Europe Market Y-o-Y Growth (%) Projections by Product, 2023 to 2033

Figure 104: Europe Market Value (US$ Million) Analysis by Usage, 2018 to 2033

Figure 105: Europe Market Volume (Units) Analysis by Usage, 2018 to 2033

Figure 106: Europe Market Value Share (%) and BPS Analysis by Usage, 2023 to 2033

Figure 107: Europe Market Y-o-Y Growth (%) Projections by Usage, 2023 to 2033

Figure 108: Europe Market Value (US$ Million) Analysis by Capacity, 2018 to 2033

Figure 109: Europe Market Volume (Units) Analysis by Capacity, 2018 to 2033

Figure 110: Europe Market Value Share (%) and BPS Analysis by Capacity, 2023 to 2033

Figure 111: Europe Market Y-o-Y Growth (%) Projections by Capacity, 2023 to 2033

Figure 112: Europe Market Value (US$ Million) Analysis by End User, 2018 to 2033

Figure 113: Europe Market Volume (Units) Analysis by End User, 2018 to 2033

Figure 114: Europe Market Value Share (%) and BPS Analysis by End User, 2023 to 2033

Figure 115: Europe Market Y-o-Y Growth (%) Projections by End User, 2023 to 2033

Figure 116: Europe Market Attractiveness by Product, 2023 to 2033

Figure 117: Europe Market Attractiveness by Usage, 2023 to 2033

Figure 118: Europe Market Attractiveness by Capacity, 2023 to 2033

Figure 119: Europe Market Attractiveness by End User, 2023 to 2033

Figure 120: Europe Market Attractiveness by Country, 2023 to 2033

Figure 121: Asia Pacific Market Value (US$ Million) by Product, 2023 to 2033

Figure 122: Asia Pacific Market Value (US$ Million) by Usage, 2023 to 2033

Figure 123: Asia Pacific Market Value (US$ Million) by Capacity, 2023 to 2033

Figure 124: Asia Pacific Market Value (US$ Million) by End User, 2023 to 2033

Figure 125: Asia Pacific Market Value (US$ Million) by Country, 2023 to 2033

Figure 126: Asia Pacific Market Value (US$ Million) Analysis by Country, 2018 to 2033

Figure 127: Asia Pacific Market Volume (Units) Analysis by Country, 2018 to 2033

Figure 128: Asia Pacific Market Value Share (%) and BPS Analysis by Country, 2023 to 2033

Figure 129: Asia Pacific Market Y-o-Y Growth (%) Projections by Country, 2023 to 2033

Figure 130: Asia Pacific Market Value (US$ Million) Analysis by Product, 2018 to 2033

Figure 131: Asia Pacific Market Volume (Units) Analysis by Product, 2018 to 2033

Figure 132: Asia Pacific Market Value Share (%) and BPS Analysis by Product, 2023 to 2033

Figure 133: Asia Pacific Market Y-o-Y Growth (%) Projections by Product, 2023 to 2033

Figure 134: Asia Pacific Market Value (US$ Million) Analysis by Usage, 2018 to 2033

Figure 135: Asia Pacific Market Volume (Units) Analysis by Usage, 2018 to 2033

Figure 136: Asia Pacific Market Value Share (%) and BPS Analysis by Usage, 2023 to 2033

Figure 137: Asia Pacific Market Y-o-Y Growth (%) Projections by Usage, 2023 to 2033

Figure 138: Asia Pacific Market Value (US$ Million) Analysis by Capacity, 2018 to 2033

Figure 139: Asia Pacific Market Volume (Units) Analysis by Capacity, 2018 to 2033

Figure 140: Asia Pacific Market Value Share (%) and BPS Analysis by Capacity, 2023 to 2033

Figure 141: Asia Pacific Market Y-o-Y Growth (%) Projections by Capacity, 2023 to 2033

Figure 142: Asia Pacific Market Value (US$ Million) Analysis by End User, 2018 to 2033

Figure 143: Asia Pacific Market Volume (Units) Analysis by End User, 2018 to 2033

Figure 144: Asia Pacific Market Value Share (%) and BPS Analysis by End User, 2023 to 2033

Figure 145: Asia Pacific Market Y-o-Y Growth (%) Projections by End User, 2023 to 2033

Figure 146: Asia Pacific Market Attractiveness by Product, 2023 to 2033

Figure 147: Asia Pacific Market Attractiveness by Usage, 2023 to 2033

Figure 148: Asia Pacific Market Attractiveness by Capacity, 2023 to 2033

Figure 149: Asia Pacific Market Attractiveness by End User, 2023 to 2033

Figure 150: Asia Pacific Market Attractiveness by Country, 2023 to 2033

Figure 151: MEA Market Value (US$ Million) by Product, 2023 to 2033

Figure 152: MEA Market Value (US$ Million) by Usage, 2023 to 2033

Figure 153: MEA Market Value (US$ Million) by Capacity, 2023 to 2033

Figure 154: MEA Market Value (US$ Million) by End User, 2023 to 2033

Figure 155: MEA Market Value (US$ Million) by Country, 2023 to 2033

Figure 156: MEA Market Value (US$ Million) Analysis by Country, 2018 to 2033

Figure 157: MEA Market Volume (Units) Analysis by Country, 2018 to 2033

Figure 158: MEA Market Value Share (%) and BPS Analysis by Country, 2023 to 2033

Figure 159: MEA Market Y-o-Y Growth (%) Projections by Country, 2023 to 2033

Figure 160: MEA Market Value (US$ Million) Analysis by Product, 2018 to 2033

Figure 161: MEA Market Volume (Units) Analysis by Product, 2018 to 2033

Figure 162: MEA Market Value Share (%) and BPS Analysis by Product, 2023 to 2033

Figure 163: MEA Market Y-o-Y Growth (%) Projections by Product, 2023 to 2033

Figure 164: MEA Market Value (US$ Million) Analysis by Usage, 2018 to 2033

Figure 165: MEA Market Volume (Units) Analysis by Usage, 2018 to 2033

Figure 166: MEA Market Value Share (%) and BPS Analysis by Usage, 2023 to 2033

Figure 167: MEA Market Y-o-Y Growth (%) Projections by Usage, 2023 to 2033

Figure 168: MEA Market Value (US$ Million) Analysis by Capacity, 2018 to 2033

Figure 169: MEA Market Volume (Units) Analysis by Capacity, 2018 to 2033

Figure 170: MEA Market Value Share (%) and BPS Analysis by Capacity, 2023 to 2033

Figure 171: MEA Market Y-o-Y Growth (%) Projections by Capacity, 2023 to 2033

Figure 172: MEA Market Value (US$ Million) Analysis by End User, 2018 to 2033

Figure 173: MEA Market Volume (Units) Analysis by End User, 2018 to 2033

Figure 174: MEA Market Value Share (%) and BPS Analysis by End User, 2023 to 2033

Figure 175: MEA Market Y-o-Y Growth (%) Projections by End User, 2023 to 2033

Figure 176: MEA Market Attractiveness by Product, 2023 to 2033

Figure 177: MEA Market Attractiveness by Usage, 2023 to 2033

Figure 178: MEA Market Attractiveness by Capacity, 2023 to 2033

Figure 179: MEA Market Attractiveness by End User, 2023 to 2033

Figure 180: MEA Market Attractiveness by Country, 2023 to 2033

Recommendations

Healthcare

Urinary Tract Infection Testing Market

Published : July 2023

Healthcare

Urinary Collection Device Market

Published : December 2022

Explore Healthcare Insights

View Reports