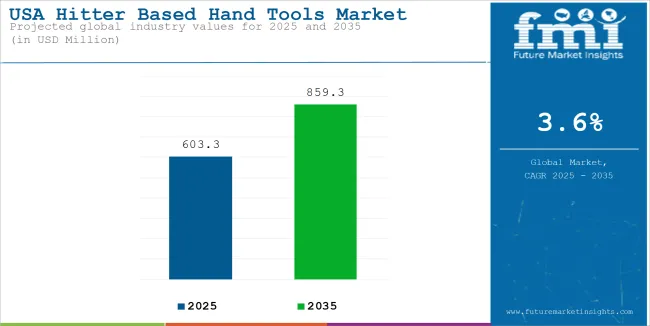
The USA Hitter Based Hand Tools market is estimated to account for USD 603.3 million in 2025. It is anticipated to grow at a CAGR of 3.6% during the assessment period and reach a value of USD 859.3 million by 2035.

| Attributes | Description |
|---|---|
| Estimated Global USA Hitter Based Hand Tools Market Size (2025 E) | USD 603.3 million |
| Projected Global USA Hitter Based Hand Tools Market Value (2035 F) | USD 859.3 million |
| Value-based CAGR (2025 to 2035) | 3.6% |
The construction industry plays a crucial role in driving demand for hitter-based hand tools owing to the substantial investments in both residential and commercial construction projects in recent years. These investments have significantly bolstered the market for hitter based hand tools as they allow accomplishing construction and assembly tasks such as framing, demolition, and finishing.
A major influence on the USA market has been the Infrastructure Investment and Jobs Act (IIJA), passed in 2021. This has triggered funding for various infrastructure projects, such as roads, bridges, and public transit systems, which has led to a rise in the demand for construction tools.
According to USA hitter-based hand tools industry analysis, construction spending grew from USD 1.9 trillion in 2021 to USD two trillion in 2022 and remained steady in 2023. The consistent investment supports the continued demand for hand tools in the construction sector.
Growing Popularity of DIY Projects to Boost Product Adoption
The growing popularity of DIY (Do-It-Yourself) projects is a key growth factor. During the pandemic, many people turned to home improvement projects as they spent more time at home, opting for DIY solutions to save on renovation costs.
The DIY market saw significant growth, with its value rising from USD 145.8 billion in 2021 to USD 162.5 billion in 2023. This trend directly influences the demand for hand tools as more consumers invest in quality tools for their home projects.
In addition, the manufacturing and metalworking sectors are major consumers of hitter-based hand tools. The reshoring of USA manufacturing jobs has created a need for tools to support new facilities and production processes.
As the manufacturing sector experiences exponential growth it attracts a robust need for specialized hand tools. The manufacturing output increased from USD 2.3 trillion to USD 2.5 trillion from 2021 to 2023.
Technological Advancements to Foster Demand
Technological advancements in tool design are also shaping the market. Ergonomic tools that reduce fatigue and the use of advanced materials make tools more durable and efficient, pushing demand for higher-quality, premium tools. Furthermore, with an increased focus on workplace safety and compliance with regulations like OSHA, there is a growing demand for tools that meet safety standards.
Overall, the USA hitter-based hand tools industry outlook remains strong, with demand driven by infrastructure investment, DIY culture, manufacturing growth, and technological innovation. The USA hitter-based hand tools sector analysis indicates a healthy and expanding market.
Power Tools Vs Hand Tools
The increasing uptake of power tools stands as a major threat to hit-based hand tools in the USA market. Be they professionals or DIY enthusiasts, users are found to prefer power tools over hand tools for rigorous operations.
Power tool innovations, especially in the battery technology sector, where high- and low-ion batteries have become the go-to tools for many, have made them portable and trustworthy.
Besides, the decreasing cost of power tools has been a backsplash, making them easy to buy and use for people from every social stratum. The constant increase in power tools market size is a practical reflection of consumer preference changes, and most construction and manufacturing companies are now leaning towards power tools for their repetitive activities, which in turn, reduces the need for traditional hand tools.
The desire for speed and ease has also made power tools the most captivating option for DIY enthusiasts.
Fluctuation in Production Costs and Strain in the Supply Chain
Increasing raw material costs are among the major issues facing the USA hit-based hand tools market. Major commodities such as aluminum, steel, and composites witnessed astounding price hikes due to chain breaks in supplies, societal tensions, and emphasized energy costs. For example, the price of steel grew 30% in 2021, followed with an 8% decrease in 2022 and a 14% increase in 2023.
These abrupt variations fluctuate the production costs of hand tool manufacturers, making it difficult for them to keep their prices competitive and healthy profits.
In addition to the fluctuations in raw materials, the accelerating energy costs in 2022 and 2023 further fueled the production costs. Global supply chain issues have resulted in failures, and high transportation costs have led some manufacturers to raise their retail prices. This could make it harder for purchasers and DIY outliers.
The transition of the USA hitter hand tools market towards sustainability is highly comprehensive. The manufacturing industries and the customers are both bringing the trend of going green to the forefront as the consumer awareness grows and the pressure from regulations binds tightens.
Many companies are resorting to the recycling of materials such as steel and aluminum, in addition to bio-composites and bamboo handles, to address their environmental impacts.
Numerous brands are in the pursuit of Eco certificates, such as Energy Star. Along with the conscious activities that the businesses follow, they promote eco-friendliness first through advertisements that educate the customers about the green attributes of their tools.
This solidifies brand loyalty invariably on the grounds of sustainability. Hence, the trend of using power optimized tools are driving the industry growth.

| Attributes | Details |
|---|---|
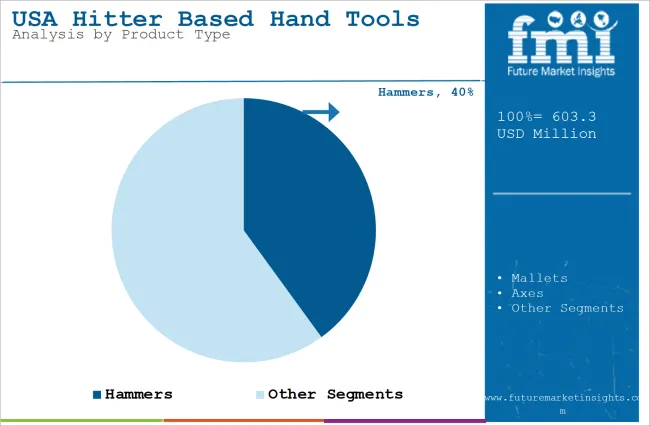
| Top Product Type | Hammer |
| Market Share in 2025 | 40% |
By product, hammers account for a dominant 40% share, making them one of the most essential tools in steel, wooden, and automobile industries. Their design and sturdiness make them indispensable for framing, upholstering, finishing, riveting, and striking masonry drills in manufacturing and assembly industries.
The strong demand for hammers is driven by the ongoing growth in construction and infrastructure projects, as well as the increasing popularity of DIY tasks where consumers regularly use hammers to perform in-house jobs.

| Attributes | Details |
|---|---|
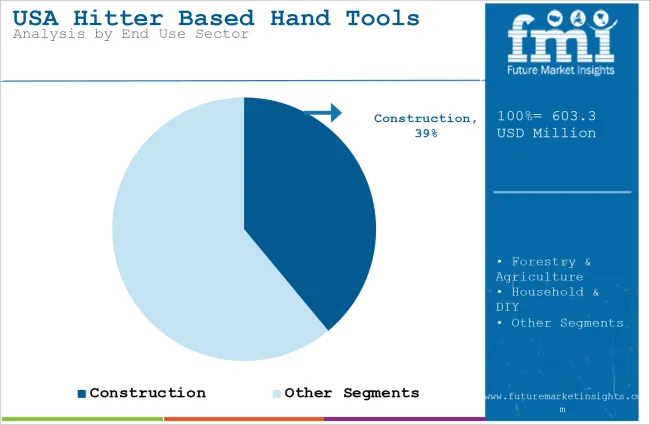
| Top End User | Construction |
| Market Share in 2025 | 35% |
The construction sector is the largest end-user in the USA hitter-based hand tools market, making up 35% of the share. With ongoing growth in both residential and commercial building projects, there’s a steady demand for reliable hand tools.
Other factors such as continuous projects in roads, bridges, and utilities fuel the need for durable tools, and increasing demand for new homes and commercial spaces keeps tools in high demand.
| Province | CAGR |
|---|---|
| Northeast | 4.8% |
| Midwest | 4.2% |
| West | 3.8% |
Southeast has moderate to high tool demand due to fast urbanization and the surge in the core sectors such as construction and automotive manufacturing. The primary aspects are:
Stanley Black & Decker, Snap-on Incorporated, and Techtronic Industries are the leading players in the USA hand tools market. The robust product portfolio of these companies sets them apart; they offer a wide variety of high-quality tools for both professional and home & hardware DIY enthusiasts.
Sum has advanced technologies such as vibration reduction systems and higher durability. Snap-on has a different approach; it prioritizes high-precision tools that are mainly directed toward the automotive and aerospace sectors.
Along with that, firms such as Estwing Manufacturing and Vaughan & Bushnell use their branding of "Made in the USA" in order to attract customers with preferences for domestic products.
To maintain market competitiveness, companies have adopted a broad spectrum of strategies. The USA hitter based hand tools market is currently highly fragmented with a diverse range of players, such as established manufacturers, and specialized construction companies.
| Company Name | Area of Focus |
|---|---|
| Stanley Black & Decker, Inc. | Global leader in tools, hardware, and security solutions. Offers power tools, hand tools, and home improvement products. |
| Q.E.P. Co., Inc. | Manufacturer of tools, adhesives, and flooring installation products. Known for ceramic tile installation tools. |
| Apex Tool Group, LLC | Leading global tool manufacturer, specializing in hand tools, power tools, and accessories. A subsidiary of Danaher Corporation. |
| Snap-on Incorporated | Known for high-quality automotive repair tools and diagnostic equipment. Serves professionals in automotive, aerospace, and heavy-duty industries. |
| Vaughan & Bushnell Manufacturing | Specializes in hand tools, especially hammers and striking tools. Known for durability and craftsmanship. |
Moreover, some players are also emphasizing to target underserved areas and remote regions to tap lucrative markets.
In terms of product type, the market is segmented into Hammers, Mallets, Axes, Shovels, Crowbars.
In terms of End User, the market is segmented into construction, forestry & agriculture, household & diy, manufacturing & fitting, rescue management, woodworking & framing.
The market is segmented into Midwest, Northeast, Southeast, Southwest, and West regions.
The value of USA Hitter Based Hand Tools Market is expected to value at USD 603.3 million
Key drivers are demand for residential and commercial construction, infrastructural investments, the DIY trend, and growing demand in the manufacturing sector. Technological improvements in tool design also play a role.
The rise of power tools and increasing raw material costs due to supply chain disruptions are major challenges.
The Northeast leads due to urban renovations, followed by the Midwest, driven by manufacturing and automotive industries.
Companies use recycled materials, focus on durable tools, and adopt eco-friendly production and packaging practices.


Full Research Suite comprises of:
Market outlook & trends analysis
Interviews & case studies
Strategic recommendations
Vendor profiles & capabilities analysis
5-year forecasts
8 regions and 60+ country-level data splits
Market segment data splits
12 months of continuous data updates
DELIVERED AS:
PDF EXCEL ONLINE
USA Medical Coding Market Size and Share Forecast Outlook 2025 to 2035
USA Labels Market Size and Share Forecast Outlook 2025 to 2035
USA Barrier Coated Paper Market Size and Share Forecast Outlook 2025 to 2035
USA Electronic Health Records (EHR) Market Size and Share Forecast Outlook 2025 to 2035
USA Animal Model Market Size and Share Forecast Outlook 2025 to 2035
USA and Canada Packer Bottle Market Size and Share Forecast Outlook 2025 to 2035
USA Stretch Hood Films Market Size and Share Forecast Outlook 2025 to 2035
USA and Canada Fence Screen Market Size and Share Forecast Outlook 2025 to 2035
USA Lubricant Contaminated HDPE Container Waste Market Size and Share Forecast Outlook 2025 to 2035
USA Commercial Walk-In Refrigeration Market Size and Share Forecast Outlook 2025 to 2035
USA & Canada Pre-painted Steel Roofing and Cladding Market Size and Share Forecast Outlook 2025 to 2035
USA Residential Cotton Candy Maker Market Size and Share Forecast Outlook 2025 to 2035
United States NFC Lemon Juice Market Analysis - Size, Growth and Forecast 2025 to 2035
USA and Canada Copper Market Insights - Demand, Size & Industry Trends 2025 to 2035
USA Ground and Precipitated Calcium Carbonate Market Growth by Product Type, Application, End-Use, and Region in 2025 to 2035
United States Animal Feed Additives Market Report – Trends, Growth & Forecast 2025–2035
United States Wild Rice Market Outlook – Size, Demand & Forecast 2025–2035
United States Wood Vinegar Market Analysis – Trends, Growth & Forecast 2025–2035
United States Tartrazine Market Report – Trends, Growth & Forecast 2025–2035
United States Whole Grain and High Fiber Foods Market Report – Trends & Forecast 2025–2035

Thank you!
You will receive an email from our Business Development Manager. Please be sure to check your SPAM/JUNK folder too.
Chat With
MaRIA