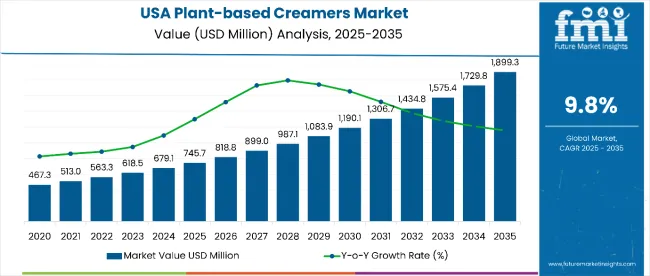
Sales of plant-based creamers in the USA are estimated at USD 745.7 million in 2025 and are projected to reach USD 1,899.3 million by 2035, reflecting a CAGR of 9.8% over the forecast period.

| Metric | Value |
|---|---|
| Estimated Value (2025E) | USD 745.7 million |
| Projected Value (2035F) | USD 1,899.3 million |
| CAGR (2025 to 2035) | 9.8% |
This growth is driven by rising health consciousness among consumers, increasing lactose intolerance awareness, expanding vegan and flexitarian populations, and growing demand for sustainable food alternatives. Per capita consumption is expected to steadily increase as consumers continue to seek dairy-free options that offer comparable taste and functionality to traditional dairy creamers.
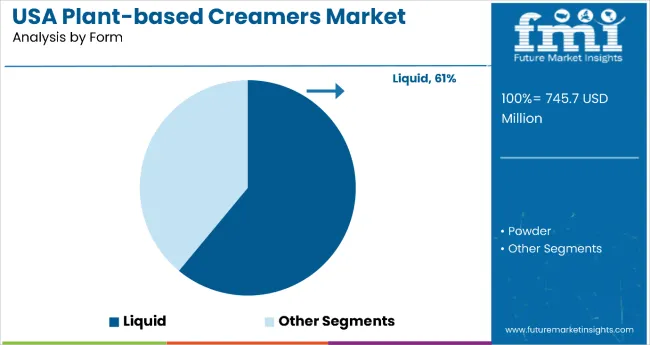
Liquid plant-based creamers are poised to remain the leading form segment with a 61.0% share in 2025, owing to superior convenience, familiar usage experience, and widespread availability across retail channels. Powdered alternatives, while still significant, cater to specific applications where extended shelf life and storage efficiency are prioritized.
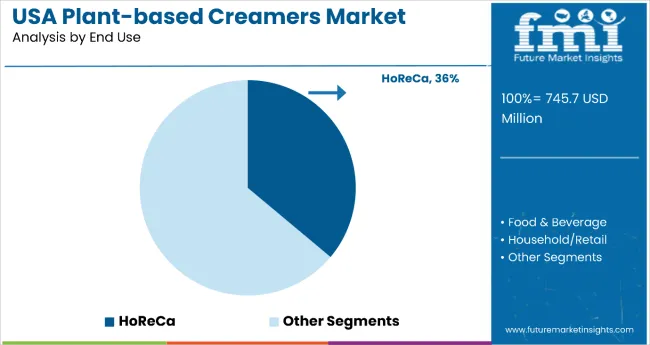
By end-use application, HoReCa (Hotels, Restaurants, and Cafes) will continue to drive the highest demand, with a 36% share in 2025, supported by increasing adoption of plant-based menu options, growing consumer demand for dairy-free alternatives in foodservice, and expanding coffee culture. Retail and household consumption segments are also experiencing robust growth, driven by mainstream acceptance and product innovation.
Consumer adoption is particularly concentrated among health-conscious individuals, environmentally aware consumers, and those with dietary restrictions, with increased availability of premium and barista-quality plant-based creamers further supporting market expansion. Product innovation, flavor diversification, and strategic partnerships between manufacturers and foodservice operators are expected to accelerate adoption.
The plant-based creamers in the USA is classified by base, form, nature, flavor, and end-use. By base, the segment includes soy, almond, coconut, oats, hemp, rice, and cashews.By form, the key classifications include liquid and powder. By nature, the segment spans organic and conventional. By flavor, the classification includes original, French vanilla, chocolate, coconut, hazelnut, and others. By end-use, the segment covers HoReCa, food & beverage, beverage mixes, coffee mixes, tea mixes, food premixes, soups & sauces, bakery products, RTD beverages, instant food, prepared & packaged, and retail/household.

Liquid plant-based creamers are projected to dominate with a 61% value share in 2025, driven by consumer familiarity, convenience of use, and superior blending characteristics in beverages. Powder alternatives remain relevant for specific applications requiring extended shelf life and portability, but represent a smaller market share.

HoReCa applications are projected to account for the largest share at 36% in 2025, driven by expanding coffee shop culture, increasing plant-based menu offerings, and growing consumer demand for dairy-free options in restaurants and cafes. Retail/household consumption represents a significant segment, while industrial applications are expanding as food manufacturers incorporate plant-based creamers into processed products.
The plant-based creamers category in the USA attracts a diverse range of health-conscious, environmentally aware, and dietary-restricted consumers seeking dairy alternatives that don't compromise on taste or functionality. While motivations range from health benefits to environmental concerns to dietary restrictions, demand is concentrated among several key consumer segments. Each segment demonstrates distinct adoption behaviors, product preferences, and purchasing considerations.
Collectively, these segments drive demand for plant-based creamers in the USA, with adoption patterns shaped by health considerations, environmental awareness, taste preferences, and lifestyle integration.

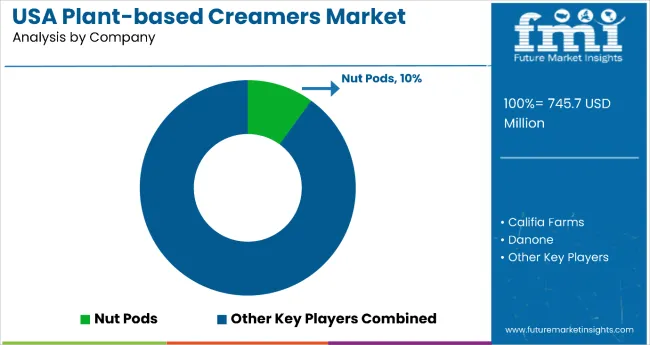
The competitive environment in the USA plant-based creamers sector is characterized by a mix of established dairy companies expanding into plant-based alternatives and specialized plant-based brands. Innovation in taste, texture, and functionality, rather than traditional dairy expertise, remains the decisive success factor: the top suppliers collectively serve millions of consumers across retail and foodservice channels nationwide and account for the majority of market distribution.
Nestlé S.A. is among the most prominent players, leveraging its Coffee-Mate brand recognition and extensive distribution network. The company focuses on taste innovation, mainstream appeal, and strategic product positioning to capture both traditional creamer users transitioning to plant-based alternatives and new consumers seeking dairy-free options.
Danone S.A. and Califia Farms provide comprehensive plant-based portfolios with strong brand positioning and premium product offerings. Their strategies emphasize organic growth, sustainability messaging, and targeted expansion into both retail and foodservice channels through innovative flavor profiles and functional benefits.
Oatly AB leverages its oat-based expertise alongside targeted marketing to health-conscious and environmentally aware consumers, focusing on barista-quality products and strategic partnerships with coffee shops and restaurants.
The next tier includes Silk (Danone), So Delicious Dairy Free, Ripple Foods, Nutpods, Laird Superfood, Milkadamia, Kitu Life, Prymal, Elmhurst 1925, and Chobani. These companies focus on specialized formulations, premium positioning, and niche market segments, often offering organic, functional, or artisanal plant-based creamer solutions.
Innovation and strategic partnerships are expected to continue, as expertise in plant-based formulation, taste optimization, and sustainable sourcing becomes increasingly critical for sustaining consumer loyalty and expanding presence across retail and foodservice sectors in the USA.
| Items | Values |
|---|---|
| Quantitative Units (2025) | USD 745.7 Million |
| Form | Liquid and Powder |
| Nature | Organic and Conventional |
| Base | Soy, Almond, Coconut, Oats, Hemp, Rice, and Cashews |
| Flavor | Original, French Vanilla, Chocolate, Coconut, Hazelnut, and Others |
| End Use | HoReCa, Food & Beverage, Beverage Mixes, Coffee Mixes, Tea Mixes, Food Premixes, Soups & Sauces, Bakery Products, R TD Beverages, Infant Food, Prepared & Packaged, and Household/Retail |
| Key Companies Profiled | Nut Pods, Califia Farms, Danone, Ripple Foods, SunOpta Grains and Foods Inc., Nestle SA, Oat-Ly, Chobani LLC, Palsgaard, Milkadamia, and Natural Bliss |
| Additional Attributes | Dollar sales by base and form, regional demand trends, competitive landscape, consumer preferences for natural versus synthetic alternatives, integration with sustainable sourcing practices, innovations in flavor development and product fortification |
The global USA plant-based creamers market is estimated to be valued at USD 745.7 million in 2025.
The market size for the USA plant-based creamers market is projected to reach USD 1,899.3 million by 2035.
The USA plant-based creamers market is expected to grow at a 9.8% CAGR between 2025 and 2035.
The key product types in USA plant-based creamers market are powder and liquid.
In terms of nature, organic segment to command 44.2% share in the USA plant-based creamers market in 2025.


Our Research Products

The "Full Research Suite" delivers actionable market intel, deep dives on markets or technologies, so clients act faster, cut risk, and unlock growth.

The Leaderboard benchmarks and ranks top vendors, classifying them as Established Leaders, Leading Challengers, or Disruptors & Challengers.

Locates where complements amplify value and substitutes erode it, forecasting net impact by horizon

We deliver granular, decision-grade intel: market sizing, 5-year forecasts, pricing, adoption, usage, revenue, and operational KPIs—plus competitor tracking, regulation, and value chains—across 60 countries broadly.

Spot the shifts before they hit your P&L. We track inflection points, adoption curves, pricing moves, and ecosystem plays to show where demand is heading, why it is changing, and what to do next across high-growth markets and disruptive tech

Real-time reads of user behavior. We track shifting priorities, perceptions of today’s and next-gen services, and provider experience, then pace how fast tech moves from trial to adoption, blending buyer, consumer, and channel inputs with social signals (#WhySwitch, #UX).

Partner with our analyst team to build a custom report designed around your business priorities. From analysing market trends to assessing competitors or crafting bespoke datasets, we tailor insights to your needs.
Supplier Intelligence
Discovery & Profiling
Capacity & Footprint
Performance & Risk
Compliance & Governance
Commercial Readiness
Who Supplies Whom
Scorecards & Shortlists
Playbooks & Docs
Category Intelligence
Definition & Scope
Demand & Use Cases
Cost Drivers
Market Structure
Supply Chain Map
Trade & Policy
Operating Norms
Deliverables
Buyer Intelligence
Account Basics
Spend & Scope
Procurement Model
Vendor Requirements
Terms & Policies
Entry Strategy
Pain Points & Triggers
Outputs
Pricing Analysis
Benchmarks
Trends
Should-Cost
Indexation
Landed Cost
Commercial Terms
Deliverables
Brand Analysis
Positioning & Value Prop
Share & Presence
Customer Evidence
Go-to-Market
Digital & Reputation
Compliance & Trust
KPIs & Gaps
Outputs
Full Research Suite comprises of:
Market outlook & trends analysis
Interviews & case studies
Strategic recommendations
Vendor profiles & capabilities analysis
5-year forecasts
8 regions and 60+ country-level data splits
Market segment data splits
12 months of continuous data updates
DELIVERED AS:
PDF EXCEL ONLINE
USA Medical Coding Market Size and Share Forecast Outlook 2025 to 2035
USA Labels Market Size and Share Forecast Outlook 2025 to 2035
USA Barrier Coated Paper Market Size and Share Forecast Outlook 2025 to 2035
USA Electronic Health Records (EHR) Market Size and Share Forecast Outlook 2025 to 2035
USA Animal Model Market Size and Share Forecast Outlook 2025 to 2035
USA and Canada Packer Bottle Market Size and Share Forecast Outlook 2025 to 2035
USA Stretch Hood Films Market Size and Share Forecast Outlook 2025 to 2035
USA and Canada Fence Screen Market Size and Share Forecast Outlook 2025 to 2035
USA Lubricant Contaminated HDPE Container Waste Market Size and Share Forecast Outlook 2025 to 2035
USA Commercial Walk-In Refrigeration Market Size and Share Forecast Outlook 2025 to 2035
USA & Canada Pre-painted Steel Roofing and Cladding Market Size and Share Forecast Outlook 2025 to 2035
USA Residential Cotton Candy Maker Market Size and Share Forecast Outlook 2025 to 2035
USA Faith Based Tourism Market Size and Share Forecast Outlook 2025 to 2035
United States NFC Lemon Juice Market Analysis - Size, Growth and Forecast 2025 to 2035
USA and Canada Copper Market Insights - Demand, Size & Industry Trends 2025 to 2035
USA Ground and Precipitated Calcium Carbonate Market Growth by Product Type, Application, End-Use, and Region in 2025 to 2035
United States Animal Feed Additives Market Report – Trends, Growth & Forecast 2025–2035
United States Wild Rice Market Outlook – Size, Demand & Forecast 2025–2035
United States Wood Vinegar Market Analysis – Trends, Growth & Forecast 2025–2035
United States Tartrazine Market Report – Trends, Growth & Forecast 2025–2035

Thank you!
You will receive an email from our Business Development Manager. Please be sure to check your SPAM/JUNK folder too.
Chat With
MaRIA