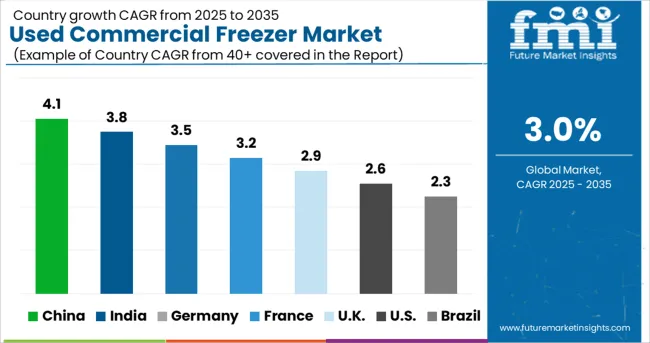
The Used Commercial Freezer Market is estimated to be valued at USD 28.4 billion in 2025 and is projected to reach USD 38.2 billion by 2035, registering a compound annual growth rate (CAGR) of 3.0% over the forecast period.
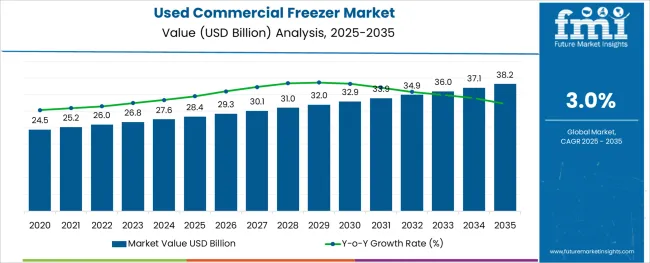
The used commercial freezer market is advancing steadily as businesses prioritize cost-efficiency, sustainability, and quick deployment of refrigeration solutions. The rising emphasis on reducing capital expenditure while maintaining operational standards has increased the appeal of refurbished and second-hand equipment.
Businesses are leveraging used freezers to align with environmental goals by extending product lifecycles and minimizing waste. Demand is further strengthened by growing awareness of circular economy practices and the rising availability of certified, quality-checked units.
Future growth is expected to benefit from the expansion of small and medium enterprises in foodservice and retail, as well as regulatory support for energy-efficient retrofits. Technological improvements in refurbishment processes and stronger distribution channels for pre-owned equipment are paving the way for broader adoption, offering both economic and environmental advantages.
The market is segmented by Type and Application and region. By Type, the market is divided into Display Cabinets, Ice Machines, and Others. In terms of Application, the market is classified into Restaurants, Hypermarkets and Supermarkets, Convenience Stores, and Others. Regionally, the market is classified into North America, Latin America, Western Europe, Eastern Europe, Balkan & Baltic Countries, Russia & Belarus, Central Asia, East Asia, South Asia & Pacific, and the Middle East & Africa.
The market is segmented by Type and Application and region. By Type, the market is divided into Display Cabinets, Ice Machines, and Others. In terms of Application, the market is classified into Restaurants, Hypermarkets and Supermarkets, Convenience Stores, and Others. Regionally, the market is classified into North America, Latin America, Western Europe, Eastern Europe, Balkan & Baltic Countries, Russia & Belarus, Central Asia, East Asia, South Asia & Pacific, and the Middle East & Africa.
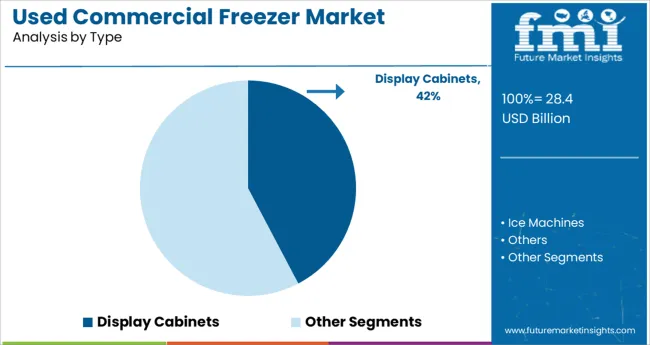
When segmented by type, display cabinets are projected to hold 42.3% of the total market revenue in 2025, emerging as the leading segment. This dominance is being driven by the high visibility and accessibility they provide in retail and foodservice environments, which enhances product presentation and customer engagement.
Businesses favor display cabinets for their versatility in showcasing frozen goods while maintaining temperature consistency and aesthetic appeal. Their modular design and compatibility with a variety of layouts have facilitated widespread deployment in space-constrained and high-traffic areas.
The availability of refurbished models with updated energy-efficient components and attractive exteriors has made display cabinets a cost-effective and practical choice for operators looking to balance performance with budget constraints. This combination of functional, economic, and visual benefits has cemented their leadership within the type segmentation.
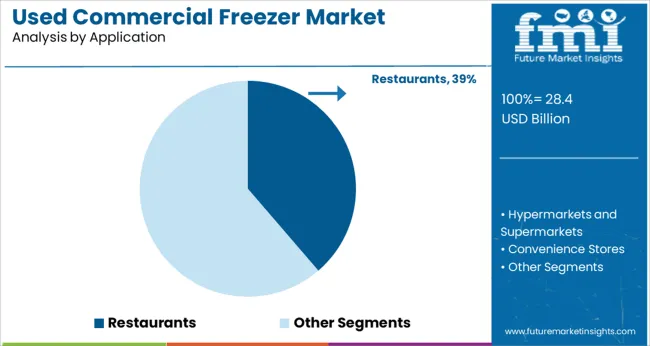
Segmenting by application reveals that restaurants are anticipated to account for 38.7% of the market revenue in 2025, securing their position as the top application segment. This has been enabled by the sector’s continuous need for reliable and affordable cold storage solutions to meet operational demands and regulatory compliance.
Restaurants have been increasingly opting for used commercial freezers as a way to reduce upfront investment while maintaining the ability to store diverse menu items safely and efficiently. The rapid turnover and competitive pressures in the dining industry have encouraged operators to adopt refurbished units that meet performance standards without straining capital budgets.
The availability of certified and warranty-backed freezers has further boosted confidence in purchasing used equipment. This pragmatic approach to balancing cost, compliance, and functionality has allowed the restaurant segment to lead in driving demand for used commercial freezers.
Saving Money
Buying a used commercial freezer can help you save a lot of money in the long run, but that's not the only reason to consider it. If you compare the cost of a new one to that of a refurbished one, the initial outlay might not seem that high. The money you save can then be used for other necessities, allowing you to get more out of your existing budget.
Lessening the Depreciation Rate of the Machinery
A brand-new commercial freezer loses hundreds of dollars in value the moment it is taken out of the box and placed on the lot. When a better model comes out, it is expected to likewise lose value. If you plan to resell it at some point, another huge advantage of going the refurbished way is that its value is likely to be maintained to a large extent.
A lot of potential choices.
Many other people and corporations spend money on commercial freezers that they don't really need. Many of these acquisitions are high-quality, little-used commercial freezers that were never even in use before.
Making a positive impact on the planet.
Follow the three R's: reduce, reuse, and recycle! You can help the world out by not adding to the garbage pile and getting a used freezer instead.
While it's unlikely that a refurbished industrial freezer would come with the same warranty as a brand-new one, the vendor you buy from may provide some other type of warranty or guarantee. Most sellers are expected to give you a discount on future repairs or maintenance, and some may even throw in a free extended warranty on the item you're buying.
| Attributes | Details |
|---|---|
| Market size value in 2025 | USD 28.4 billion |
| Market forecast value in 2035 | USD 38.2 billion |
| Forecast period | 2025 to 2035 |
| Global growth rate (CAGR) | 3% |
Norms encouraging the adoption of energy-efficient commercial refrigeration equipment have been established in response to increased environmental concerns about dangerous emissions from refrigerators, such as Hydrochlorofluorocarbons (HCFC) and Chlorofluorocarbons (CFC). The Clean Air Act, initiated by the United States Environmental Protection Agency, demands the standardization of the use of low Global Warming Potential (GWP) refrigerants in the business sector.
Energy-efficient refrigerants for commercial refrigerators are being developed in response to these regulatory restrictions, which aim to lessen the negative effects of greenhouse gas emissions. To create an environmentally friendly natural refrigerant CO2, for instance, Daikin Industries, Ltd. released an improved version of its Conveni-Pack cooling system in September 2024. This system is designed for use in gas stations and grocery stores. The commercial refrigeration needs of the European food retail sector are met by this all-in-one and highly efficient solution that incorporates food refrigeration, air conditioning, heat recovery, and a heat pump.
Historically, the used commercial freezer market grew at a CAGR of 2.1% during the forecast period of 2020 to 2025.
The cold storage warehouses provide many services for the food logistics industry, including the storage of perishable and seasonal goods for year-round availability, export-import logistic services across global transit routes, and meeting strategic locations for retail distributions. Short-term, cross-sectoral interest in these types of refrigeration warehousing services is growing rapidly. A rise in the number of warehouses means more money and more chances to grow the used commercial freezer market.
Due to the above factors, the used commercial freezer market is expected to grow at a CAGR of 3% in the coming years.
The food and beverage market is expected to grow as a result of increased investment in the sector.
One of the leading industries worldwide, the food and beverage business contributes significantly to the annual revenue of the used commercial freezer market. To meet consumer demand, the business processes raw farm commodities from more than 24.5 million farms into consumer food items sold in roughly 680,000 retail and food service outlets. This boosts manufacturing, consumption, and the need for commercial refrigeration equipment around the world. According to research conducted by the Food and Agriculture Organization (FAO), in 24.5017 the food sector made USD 1.4 trillion in sales, with the food and beverage business contributing an additional USD 164 billion in value. The global increase in the use of used refrigeration equipment can be largely attributed to the rising demand for consumer and ready-to-eat food and beverage items.
Increased Market Expansion Caused by Increased Use of Magnetic Refrigeration
Using the magnetocaloric effect, in which a temperature shift is generated by applying a reversible magnetic field, the recently developed technology of magnetic refrigeration has been introduced. To reduce the temperature inside the machine, the refrigerant is subjected to a powerful magnetic field, which aligns different magnetic dipoles. This magnetic refrigeration technology may be integrated into used refrigeration equipment worldwide since it is inexpensive, environmentally benign, long-lasting, safe, and uses less energy overall. This is expected to change the used commercial freezer market outlook.
Rising production and upkeep costs are likely to slow market expansion.
The high price of the equipment is likely to slow the expansion of the market. Commercial refrigerators, freezers, and other such appliances are made to accommodate big spaces, so their prices reflect this. Thus, the acquisition and upkeep of such massive apparatuses constitute further constraints. Another key factor restraining the used refrigeration equipment market is consumers' general lack of knowledge about how to make the most of these devices.
Rising consumer demand for convenient, healthy food options is driving the expansion of the used commercial freezer market's food and beverage segment. Commercial refrigeration is most widely used in the food and beverage industry because of all the different uses the technology has there.
Massively used refrigeration equipment is being introduced in the chemical and pharmaceutical industries for the purpose of storing chemicals, pathology samples, and other biological samples, and this is predicted to lead to explosive expansion in these fields. In order to store the ever-increasing supply of drugs like anti-COVID drugs and others, hospitals and pharmaceutical companies are investing in state-of-the-art refrigeration and freezing technology.
As the demand for frozen meat and other food and beverages rises, the market for frozen goods sold in industrialized countries' supermarkets is anticipated to expand slowly but steadily. The rising popularity of both full-service and quick-service restaurants is reflected in the used commercial freezer industry's constant growth rate of hotels and restaurants.
Due to a lack of adoption in the hospitality industry around the world, the other subsegment is also expected to see only modest used commercial freezer market expansion.
While it's unlikely that a refurbished industrial freezer would come with the same warranty as a brand-new one, the vendor you buy from may provide some other type of warranty or guarantee. Most sellers are expected to give you a discount on future repairs or maintenance, and some may even throw in a free extended warranty on the item you're buying.
| Attributes | Details |
|---|---|
| Market size value in 2025 | USD 26780 million |
| Market forecast value in 2035 | USD 37070 million |
| Forecast period | 2025 to 2035 |
| Global growth rate (CAGR) | 3% |
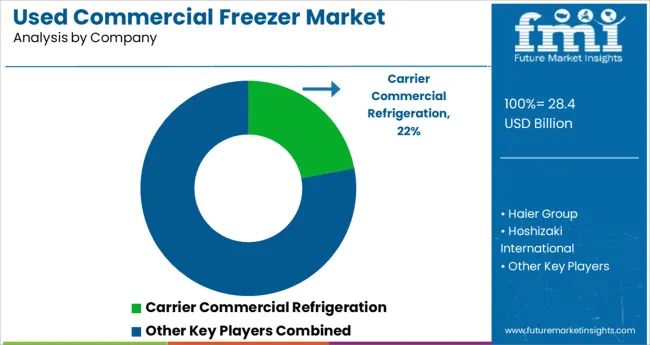
The rising demand for environmentally friendly machinery has prompted industry leaders to introduce cutting-edge new products. A COVID-19 vaccine storage facility in Spain, for example, received a PowerCO2OL refrigeration system from Carrier Commercial Refrigeration in January 2025. Carbon dioxide is used in this system because it is a natural refrigerant with a low global warming potential, making it ideal for preserving vaccinations in Spain.
In addition, the major players in the used commercial freezer market are working to fortify their position in the market through the implementation of various strategic initiatives, including capacity growth, partnerships, mergers, and acquisitions. Whirlpool Corporation, for instance, declared plans to invest over USD 65 million over the next few years in its manufacturing in Ottawa, Ohio, in order to establish the facility as the Premium Refrigeration Factory in North America. The Ottawa facility will get a makeover as part of the company's goal to compete in the luxury refrigeration market with items like the Built-In Refrigerator (BIR).
The used commercial freezer market is expanding rapidly, and new market players are trying to capitalize on the increasing potential of the industry. The top 4 start-ups in the used commercial freezer market are:
| Name | Optimum Energy |
|---|---|
| Date of Establishment | 2005 |
| Place of Establishment | Seattle, United States |
| Description | Optimizing HVAC systems in commercial buildings with a cloud-based service delivered as a service. It optimizes heating and cooling systems in commercial buildings using information collected from a variety of sources. It offers three distinct items: OptiCx, a chiller diagnostics platform; LOOP, a system-level optimizer for centrifugal chiller operations; and LOOP. |
| Name | Enerbrain |
|---|---|
| Date of Establishment | 2020 |
| Place of Establishment | Turin, Italy |
| Description | Commercial HVAC management powered by a SaaS platform. The company says its Internet of Things technology and cloud-based, highly effective algorithms can fine-tune energy usage, resulting in cost reductions for businesses. The Energy Cloud enhances indoor comfort by integrating with preexisting HVAC systems and permitting a dynamic reaction to changing internal and exterior conditions. |
| Name | BeeBryte |
|---|---|
| Date of Establishment | 2020 |
| Place of Establishment | Lyon, France |
| Description | Software for predictive HVAC-R control powered by artificial intelligence is being offered so that commercial and industrial structures can become more energy efficient. It aids commercial and industrial structures in cutting back on energy use, saving money, and reducing carbon dioxide emissions. It has created an AI-powered energy optimization programme that uses predictive driving to maximise the efficiency of already-in-place cooling and refrigeration infrastructure. |
| Name | Smart Joules |
|---|---|
| Date of Establishment | 2014 |
| Place of Establishment | Delhi, India |
| Description | HVAC management service provider for building owners and managers. It offers hardware and software options for pre-existing building infrastructures to save power usage. Using the energy management platform and some secret sauce in the form of algorithms, it adjusts the performance of the central air conditioning plant in response to variations in external temperature and building occupancy. |
The global used commercial freezer market is estimated to be valued at USD 28.4 billion in 2025.
It is projected to reach USD 38.2 billion by 2035.
The market is expected to grow at a 3.0% CAGR between 2025 and 2035.
The key product types are display cabinets, ice machines and others.
restaurants segment is expected to dominate with a 38.7% industry share in 2025.


Full Research Suite comprises of:
Market outlook & trends analysis
Interviews & case studies
Strategic recommendations
Vendor profiles & capabilities analysis
5-year forecasts
8 regions and 60+ country-level data splits
Market segment data splits
12 months of continuous data updates
DELIVERED AS:
PDF EXCEL ONLINE
Used EV Market Size and Share Forecast Outlook 2025 to 2035
Used Restaurant Equipment Market Size and Share Forecast Outlook 2025 to 2035
Used E-Scooter Market Growth - Trends & Forecast 2024 to 2034
Used Passenger Car Sales Market
Used Commercial Kitchen Equipment Market Size and Share Forecast Outlook 2025 to 2035
Focused Ultrasound System Market Trends and Forecast 2025 to 2035
CBD-Infused Skincare Market Size and Share Forecast Outlook 2025 to 2035
Cica-Infused Healing Creams Market Analysis - Size, Share, and Forecast Outlook 2025 to 2035
GABA-Infused Drinks Market Size and Share Forecast Outlook 2025 to 2035
Metric Value Industry Size (2025E) USD 32.0 billion Industry Value (2035F) 46.9 billion CAGR (2025 to 2035) 3.9%
Herb-Infused Water Market Analysis by Nature, Packaging, Herb Type, and Region through 2025 to 2035
Sales of Used Bikes through Bike Marketplaces Market- Growth & Demand 2025 to 2035
Ectoin-Infused Skincare Market Size and Share Forecast Outlook 2025 to 2035
Cancer-focused Genetic Testing Service Market Analysis – Growth & Industry Insights 2024-2034
Peptide-Infused Anti-Aging Serums Market Analysis - Size and Share Forecast Outlook 2025 to 2035
Peptide-Infused Tinted Moisturizers Market Size and Share Forecast Outlook 2025 to 2035
Graphene Infused Packaging Market Size and Share Forecast Outlook 2025 to 2035
Retinoid-Infused Night Creams Market Analysis - Size, Share, and Forecast Outlook 2025 to 2035
Caffeine-Infused Skincare Market Size and Share Forecast Outlook 2025 to 2035
Turmeric-Infused Actives Market Size and Share Forecast Outlook 2025 to 2035

Thank you!
You will receive an email from our Business Development Manager. Please be sure to check your SPAM/JUNK folder too.
Chat With
MaRIA