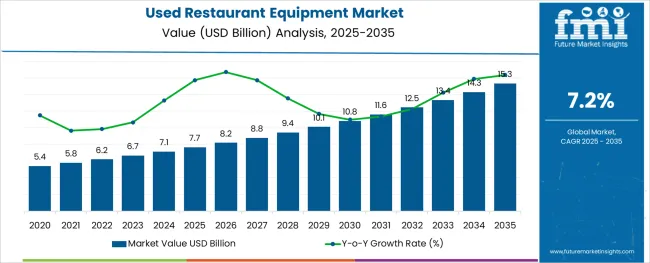
The Used Restaurant Equipment Market is estimated to be valued at USD 7.7 billion in 2025 and is projected to reach USD 15.3 billion by 2035, registering a compound annual growth rate (CAGR) of 7.2% over the forecast period.

The used restaurant equipment market is undergoing steady growth as economic pressures, sustainability initiatives, and entrepreneurial activity in the food service sector converge. Rising demand from small and independent operators to minimize startup costs has accelerated interest in high quality pre-owned equipment. Sustainability trends encouraging the reuse and extended lifecycle of durable assets have further strengthened this market’s appeal.
The availability of certified, refurbished products with warranty assurances has improved buyer confidence and enhanced resale values. Growth is also being supported by the increasing closure or renovation of restaurants, creating a steady supply of used inventory and incentivizing secondary market activity.
Technological upgrades in newer equipment models continue to push older but functional units into the resale channel, widening choices for buyers. These factors are paving the path for continued expansion, particularly as awareness of cost savings and environmental benefits become more pronounced across the food service industry.
The market is segmented by Equipment and Application and region. By Equipment, the market is divided into Kitchen Purpose Equipment, Refrigeration Equipment, Ware Washing Equipment, Warming and Holding Equipment, and Others. In terms of Application, the market is classified into Full-Service Restaurants, Quick Service Restaurants, Commercial Canteens, Hotels, and Others. Regionally, the market is classified into North America, Latin America, Western Europe, Eastern Europe, Balkan & Baltic Countries, Russia & Belarus, Central Asia, East Asia, South Asia & Pacific, and the Middle East & Africa.
The market is segmented by Equipment and Application and region. By Equipment, the market is divided into Kitchen Purpose Equipment, Refrigeration Equipment, Ware Washing Equipment, Warming and Holding Equipment, and Others. In terms of Application, the market is classified into Full-Service Restaurants, Quick Service Restaurants, Commercial Canteens, Hotels, and Others. Regionally, the market is classified into North America, Latin America, Western Europe, Eastern Europe, Balkan & Baltic Countries, Russia & Belarus, Central Asia, East Asia, South Asia & Pacific, and the Middle East & Africa.

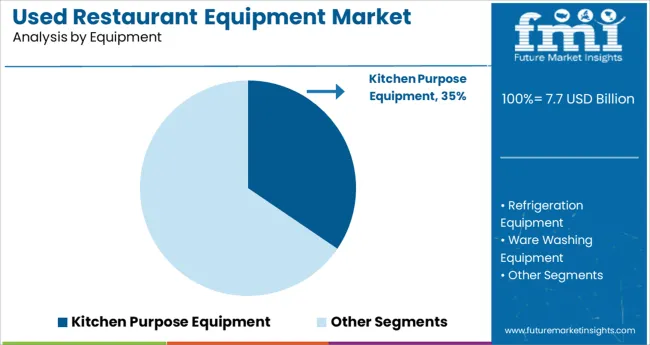
When segmented by equipment, the kitchen purpose equipment subsegment is expected to hold 34.5% of the total market revenue in 2025, positioning it as the leading equipment category. This leadership has been reinforced by the central role of cooking, refrigeration, and preparation appliances in the operational efficiency of restaurants.
These items are often the most expensive investments in a commercial kitchen and retain functional value even after years of use, making them highly sought after in the secondary market. The durability and repairability of these units, combined with their essential nature in day to day restaurant operations, have driven consistent demand.
Buyers in this segment are motivated by the opportunity to acquire high performance equipment at a fraction of the original cost, enabling quicker returns on investment. The sustained availability of certified refurbished options has further boosted confidence in kitchen purpose equipment, solidifying its top position within the equipment category.

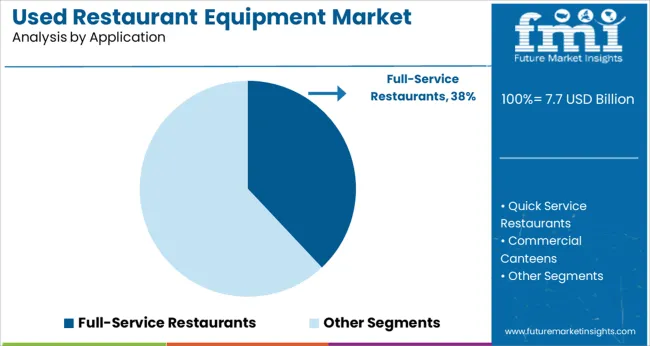
Segmenting by application shows that full service restaurants are anticipated to account for 38.0% of the used restaurant equipment market revenue in 2025, making it the dominant segment. This prominence has been shaped by the operational needs and financial realities of full service establishments, which often require extensive equipment setups to deliver diverse menus and maintain high service standards.
The larger kitchen footprints and higher capital requirements typical of full service operations have increased reliance on cost effective used equipment solutions. Entrepreneurs and operators in this segment are particularly inclined to optimize budgets while ensuring quality and compliance, which has supported their preference for refurbished assets.
Moreover, the frequent remodeling and repositioning of full service restaurants contribute to a steady flow of equipment into the used market, sustaining supply and driving adoption. The ability to acquire premium grade equipment at lower costs has enabled full service restaurants to maintain competitiveness, reinforcing this segment’s leadership.
Kitchen appliances have remained a top seller in the used restaurant equipment industry over the previous decade. Sales of kitchen appliances have recently overtaken those of dining room sets and home appliances. This is probably because of the rising fad for fast and easy food service options, as well as the rising need for nutritious and environmentally friendly cuisine. Cookware is one of the most widely used categories of kitchen appliances.
The worldwide used restaurant equipment market also features a wide variety of other types of kitchen appliances, such as ovens, microwaves, dishwashers, range hoods, countertops, mixers and blenders, steamers, fryers, coffee makers, juicers, and juice extractors.
Numerous factors contribute to the widespread adoption of kitchen appliances in the hospitality industry. One explanation is that there just isn't the space required for as many individual pieces of kitchen furniture as there formerly was. Furthermore, many individuals today would rather eat at a fast-food restaurant than a traditional restaurant. This has changed the dynamics of the global used restaurant equipment market.
Demand for high-tech equipment is expected to increase, driving market expansion.
Demand for cutting-edge food service equipment is expected to skyrocket in the next years due to the growing concern for food safety and the popularity of smart kitchen gadgets. Therefore, the development of the Internet of Things (IoT), Big Data, and Industry 4.0 has stimulated the growth of smart food businesses that produce technologically advanced machinery. The greatest standards of food safety can be attained, food waste can be reduced, traceability can be enhanced, costs may be minimized, and dangers related to the increasingly popular alternative methods of serving food can be mitigated. Thus, the advancement of used restaurant equipment is highly required for global growth.
Increased Market Expansion Caused by the Incorporation of Automated Technologies
The manufacturers of these tools have set their sights on bettering the quality of food at a reasonable cost. Given the current state of the used restaurant equipment market, it is crucial to keep an eye on and provide high-quality servicing for any piece of machinery. To acknowledge the operation of used kitchen equipment, remote maintenance, and self-diagnosis features are introduced for connected and smart operations.
When it comes to consumer food safety, it's important to utilize utensils that have been properly sterilised, kept at the correct temperature, and cleaned regularly. To better serve their customers, companies in this sector are creating new offerings that leverage AI and IoT technology. One example is Samsung's IoT-enabled refrigerator, which debuted in July 2020 and featured a 21-inch display and Bixby voice control.
Market Expansion Stifled by Exorbitantly Priced Cutting-Edge Equipment
In order to ensure that their products are safe for use in the food industry, manufacturers of used restaurant equipment must employ workers who are proficient with both manual and automated machinery. It's more expensive to implement automated food service devices because of the need for trained workers and other automated infrastructure. This raises the barrier to entry into the used restaurant equipment market by making the devices more difficult to set up and maintain.
| Market Share (2035) | 28.5% |
|---|
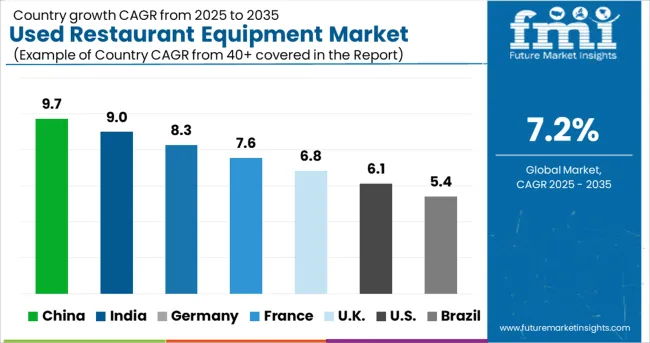
The USA market is expected to hold a market share of 28.5% of the global market.
The United States of America has become the world's largest consumer of used restaurant equipment because of the prevalence of household names like McDonald's, Burger King, KFC, and Starbucks. The restaurant industry is predicted to grow in the next years, which could be good news for the deployment rates of this equipment thanks to government actions affecting the country's tourist economy and immigration. FMI anticipates significant growth in the Latin American used restaurant equipment market as a result of the increasing demand for off-premises or home delivery services.
One of the most well-known destinations for vacationers in Europe. The hospitality industry would benefit greatly from an increase in tourists, and this would have a positive knock-on effect on the used restaurant equipment market across Europe.
According to FMI, Germany currently accounts for 20.3% of the European used restaurant equipment industry and is poised to become the continent's largest market.
There has been a significant increase in the level of infrastructure and technological advancement in the hotel sector in the area. Hotel guests also like to eat, and they choose meals that are both quick to make and healthy. Preparing and preserving the quality of such cuisine is greatly aided by the hotel's food service equipment.
| Market Share (2035) | 3.5% |
|---|
The Japanese market is expected to hold a market share of 3.5% of the global market.
A healthy increase in the used restaurant equipment market in Japan is anticipated. Japan's manufacturers are working to reduce prices while maintaining high standards of product quality and customer satisfaction. By automating several aspects of the food service industry, they have been able to increase production, improve quality, and keep prices low for the general public.
Also, the capability of sterilizing utensils to keep things clean has generated considerable attention among Japanese stakeholders. The increasing popularity of processed foods is also predicted to increase Japan's share of the global demand for used restaurant equipment.
Consumers now have more options to choose from owing to the cutting-edge technology in used restaurant equipment.
Technologies such as the Internet of Things (IoT), data analytics, etc., are being used by Korean manufacturers to guarantee consistency across the board. Minimizing distractions and maximizing productivity are two major benefits of implementing such technology in a restaurant setting.
The incorporation of multi-purpose modular kitchens as part of the food service infrastructure also contributes to efficiency. Robots are being used in factories for food preparation and delivery; these machines are designed to work in tandem with existing dining room appliances.

New Entrants to Foster Innovation in the Global Market
The start-ups in the used restaurant equipment market are adding a new edge to the properties of excavators by curating innovations beyond the imagination. They are continually upgrading the used restaurant equipment with advanced technology, and manufacturers and sellers are continuously attempting to reduce costs for greater accessibility to the market share. Start-up firms are triggering the expansion of the used restaurant equipment market with their unique attempts.
In order to boost profits and solidify their foothold in the used restaurant equipment market, major players in the industry have turned to mergers and acquisitions, as well as strategic partnerships.
As a result of the market's growth, companies that produce used commercial appliances have begun developing innovative new products. Modern dishwashing equipment, refrigerated display cases, and self-service ordering kiosks are all examples of useful tools in the food service industry. By eliminating the need for human labor, these devices can reduce operational expenses for restaurants. In addition, patrons can purchase their own food at their convenience using self-service ordering kiosks.
Companies in the used restaurant equipment industry throughout the world are scrambling to keep up with the rising demand for their wares. Recent innovations in home appliances include energy-efficient electric prep tables and microwaves. Filtered ventilation systems for kitchens, which remove potentially dangerous airborne contaminants, are also gaining popularity. All these items allow eateries to lessen their carbon footprint without sacrificing the quality of service they provide to their clientele.
With the release of ChefLincTM in June 2024, Alto-Shaam introduced a cloud-based, remote oven management system that encouraged reduced travel and enhanced interpersonal connections. With ChefLinc, food service businesses can manage their facilities, menus, and operations from anywhere, increasing productivity and uniformity across several locations. Because of this advancement, operators are likely to no longer need to enter recipes into ovens by hand, transfer recipes through USB, or physically update ovens at each location.
The global used restaurant equipment market is estimated to be valued at USD 7.7 billion in 2025.
It is projected to reach USD 15.3 billion by 2035.
The market is expected to grow at a 7.2% CAGR between 2025 and 2035.
The key product types are kitchen purpose equipment, refrigeration equipment, ware washing equipment, warming and holding equipment and others.
full-service restaurants segment is expected to dominate with a 38.0% industry share in 2025.


Our Research Products

The "Full Research Suite" delivers actionable market intel, deep dives on markets or technologies, so clients act faster, cut risk, and unlock growth.

The Leaderboard benchmarks and ranks top vendors, classifying them as Established Leaders, Leading Challengers, or Disruptors & Challengers.

Locates where complements amplify value and substitutes erode it, forecasting net impact by horizon

We deliver granular, decision-grade intel: market sizing, 5-year forecasts, pricing, adoption, usage, revenue, and operational KPIs—plus competitor tracking, regulation, and value chains—across 60 countries broadly.

Spot the shifts before they hit your P&L. We track inflection points, adoption curves, pricing moves, and ecosystem plays to show where demand is heading, why it is changing, and what to do next across high-growth markets and disruptive tech

Real-time reads of user behavior. We track shifting priorities, perceptions of today’s and next-gen services, and provider experience, then pace how fast tech moves from trial to adoption, blending buyer, consumer, and channel inputs with social signals (#WhySwitch, #UX).

Partner with our analyst team to build a custom report designed around your business priorities. From analysing market trends to assessing competitors or crafting bespoke datasets, we tailor insights to your needs.
Supplier Intelligence
Discovery & Profiling
Capacity & Footprint
Performance & Risk
Compliance & Governance
Commercial Readiness
Who Supplies Whom
Scorecards & Shortlists
Playbooks & Docs
Category Intelligence
Definition & Scope
Demand & Use Cases
Cost Drivers
Market Structure
Supply Chain Map
Trade & Policy
Operating Norms
Deliverables
Buyer Intelligence
Account Basics
Spend & Scope
Procurement Model
Vendor Requirements
Terms & Policies
Entry Strategy
Pain Points & Triggers
Outputs
Pricing Analysis
Benchmarks
Trends
Should-Cost
Indexation
Landed Cost
Commercial Terms
Deliverables
Brand Analysis
Positioning & Value Prop
Share & Presence
Customer Evidence
Go-to-Market
Digital & Reputation
Compliance & Trust
KPIs & Gaps
Outputs
Full Research Suite comprises of:
Market outlook & trends analysis
Interviews & case studies
Strategic recommendations
Vendor profiles & capabilities analysis
5-year forecasts
8 regions and 60+ country-level data splits
Market segment data splits
12 months of continuous data updates
DELIVERED AS:
PDF EXCEL ONLINE
Used EV Market Size and Share Forecast Outlook 2025 to 2035
Used Commercial Freezer Market Size and Share Forecast Outlook 2025 to 2035
Used E-Scooter Market Growth - Trends & Forecast 2024 to 2034
Used Passenger Car Sales Market
Used Commercial Kitchen Equipment Market Size and Share Forecast Outlook 2025 to 2035
Focused Ultrasound System Market Trends and Forecast 2025 to 2035
CBD-Infused Skincare Market Size and Share Forecast Outlook 2025 to 2035
Cica-Infused Healing Creams Market Analysis - Size, Share, and Forecast Outlook 2025 to 2035
GABA-Infused Drinks Market Size and Share Forecast Outlook 2025 to 2035
Metric Value Industry Size (2025E) USD 32.0 billion Industry Value (2035F) 46.9 billion CAGR (2025 to 2035) 3.9%
Herb-Infused Water Market Analysis by Nature, Packaging, Herb Type, and Region through 2025 to 2035
Sales of Used Bikes through Bike Marketplaces Market- Growth & Demand 2025 to 2035
Ectoin-Infused Skincare Market Size and Share Forecast Outlook 2025 to 2035
Cancer-focused Genetic Testing Service Market Analysis – Growth & Industry Insights 2024-2034
Peptide-Infused Anti-Aging Serums Market Analysis - Size and Share Forecast Outlook 2025 to 2035
Peptide-Infused Tinted Moisturizers Market Size and Share Forecast Outlook 2025 to 2035
Graphene Infused Packaging Market Size and Share Forecast Outlook 2025 to 2035
Retinoid-Infused Night Creams Market Analysis - Size, Share, and Forecast Outlook 2025 to 2035
Caffeine-Infused Skincare Market Size and Share Forecast Outlook 2025 to 2035
Turmeric-Infused Actives Market Size and Share Forecast Outlook 2025 to 2035

Thank you!
You will receive an email from our Business Development Manager. Please be sure to check your SPAM/JUNK folder too.
Chat With
MaRIA