Vestibular Testing System Market Size and Share Forecast Outlook 2025 to 2035

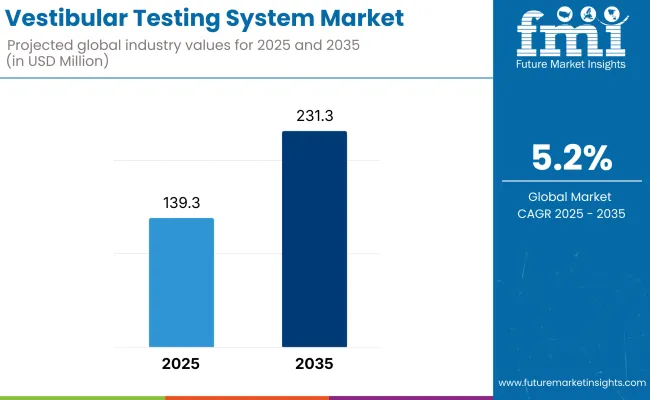
The Vestibular Testing System Market is anticipated to be valued at USD 139.3 million in 2025 and is expected to reach USD 231.3 million by 2035, registering a CAGR of 5.2%.
Quick Stats for Vestibular Testing System Market

  • Industry Value (2025): USD 139.3 million
  • Forecast Value (2035): USD 231.3 million
  • Forecast CAGR: 5.2%
  • Leading Segment in 2025: Videonystagmography
  • Key Growth Region: North America and Asia Pacific
  • Top Key Players: Interacoustics A/S (Demant), GN Otometrics (Natus Medical), Neuro Kinetics Inc., Micromedical Technologies, Difra Instrumentation, BioMed Jena GmbH, Balanceback, VertiScience, Techno Concept
Metric Value
Industry Size (2025E) USD 139.3 million
Industry Value (2035F) USD 231.3 million
CAGR (2025 to 2035) 5.2%

This market witnessing significant growth driven by the increasing prevalence of balance disorders and advancements in diagnostic technologies. These systems are essential for diagnosing conditions like vertigo, dizziness, and imbalance, which are becoming more common due to aging populations and lifestyle changes. The market is characterized by the adoption of non-invasive, accurate diagnostic tools such as Videonystagmography (VNG) and Computerized Dynamic Posturography (CDP).

Healthcare providers are increasingly investing in these technologies to enhance patient care and diagnostic accuracy. The integration of artificial intelligence and machine learning into vestibular testing systems is also contributing to market growth by enabling more precise and efficient diagnostics.

Furthermore, the expansion of healthcare infrastructure in emerging economies and increased awareness of vestibular disorders are creating new opportunities for market players. Overall, the market is poised for continued growth, supported by technological innovations and a growing demand for effective diagnostic solutions.

Analyzing Vestibular Testing System Market by Top Investment Segments

Videonystagmography (VNG) Leads the Market Due to Rising Preference for Non-Invasive and Real-Time Eye Movement Diagnostics

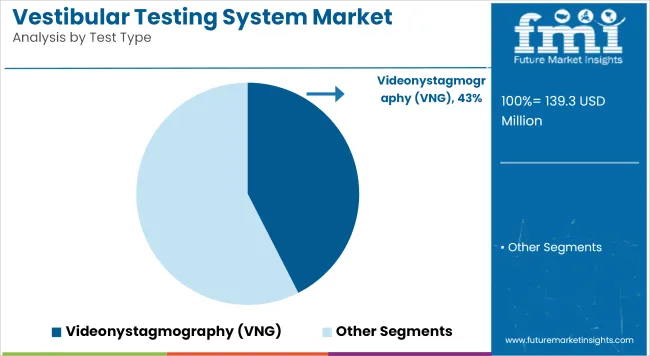
A revenue share of 42.5% in 2025 has been secured by the Videonystagmography (VNG) segment in the Vestibular Testing System Market. The growth of this segment has been largely driven by its non-invasive nature and high diagnostic accuracy in assessing vestibular and ocular motor functions.

The demand for VNG systems has been reinforced by clinicians’ preference for eye-tracking methodologies that deliver real-time responses to stimuli, improving diagnostic certainty in vertigo, dizziness, and balance-related disorders. Its dominance has also been attributed to its broad compatibility with various test protocols, faster setup, and ease of use in both hospital and ambulatory care settings.

VNG’s ability to quantify and document eye movements with video-based goggles has enhanced clinical decision-making. Increased training access and awareness among audiologists and neurologists have enabled its rapid adoption.
Vestibular Testing System Market Analysis By Test Type

Hospitals Dominate the Market Due to Their Capacity to Integrate Advanced Diagnostic Infrastructure and Multispecialty Collaboration

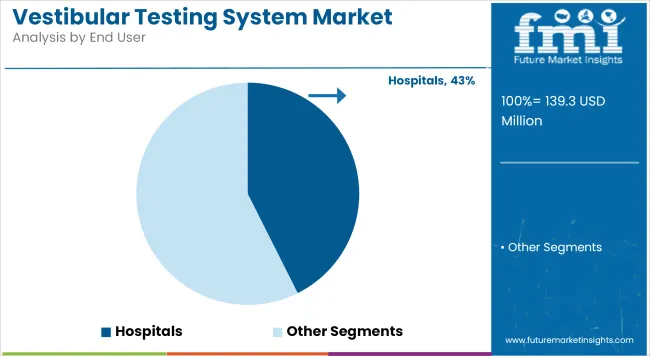
Hospitals were identified as the leading end user in 2025, accounting for 42.6% of the revenue share in the global Vestibular Testing System Market. This dominance has been supported by hospitals’ ability to invest in high-end diagnostic equipment and integrate vestibular testing with broader neurology and ENT departments.

The availability of specialized personnel and established diagnostic workflows has enhanced clinical throughput and optimized the utilization of vestibular technologies. Hospitals have served as the primary centers for early diagnosis and management of balance disorders, often coordinating with rehabilitation services.

Their role in medical education and research has further supported early adoption of cutting-edge technologies, such as AI-based VNG and rotary chair systems. Additionally, the reimbursement infrastructure in developed regions has favored hospital-based diagnostic care, reinforcing patient volumes and technology upgrades.

Cross-functional expertise and a higher footfall of geriatric patients have made hospitals pivotal in shaping the growth trajectory of the Vestibular Testing System Market. This concentration of diagnostic resources within hospitals is expected to continue driving their leading position.
Vestibular Testing System Market Analysis By End User

Challenges and Opportunities

Challenges

Diagnostic Variability, Limited Access, and Cost Barriers Hindering Widespread Adoption of Vestibular Testing Systems

Although there has been progress made on the technical fronts of vestibular testing systems, there exist key pain points within the market of vestibular testing systems that currently exist, being born on complexity of operation and inequity of access.

Most kinds of vestibular tests such as caloric tests, VNG, and rotary chair tests involve personnel with specific training and dedicated lab equipment restricting their adoption to cities or tertiary-level care. Further, interpretation of responses to eye movement is subjective and any tests stepping dependency is patient-based which tends to offer site-based inconsistency of diagnosis.

The repeated high capital cost involved with state-of-the-art testing equipment discourages mid-sized clinics and outpatient facilities, particularly in cost-conscious markets. Every provider also must contend with restricted access to international standardization of vestibular protocols, leading to fractured models of care that limit the capacity of the market to scale appropriately and hinder technology transfer between nations or providers.

Opportunities

Expanding Horizons with AI Diagnostics, Remote Monitoring, and Multisensory Integration

The vestibular testing system market is undergoing transformative times, shaped by digital innovation that creates new avenues for access, precision, and functionality. Sophisticated eye tracking by artificial intelligence (AI) and machine-learning-based pattern recognition broaden the diagnostic excellence of VNG and vHIT systems, reducing user bias and speeding up interpretation in community primary care practice.

The advent of battery-operated vestibular assessment kits that are recharged from a tablet computer or smart phone is opening the door to rural and community clinic deployment, especially for fall-risk screening in the geriatric population.

The integration of vestibular testing and virtual reality (VR) rehabilitation platforms gives rise to dual-purpose equipment that tests and treats balance dysfunctions in one workflow, which improves attractiveness in neurology and sports medicine.

In addition, since wearable vestibular monitors for real-time dizziness monitoring are being developed, diagnostics will eventually transition away from episodic testing to real-time monitoring. As telehealth integration gains wider reach, these advances are building the cornerstone for scalable vestibular testing that is poised to drive growth in the developed and developing world.
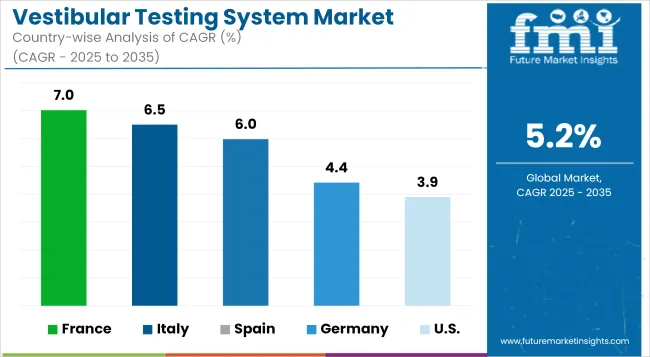
Country-wise Insights

Vestibular Testing System Market Country Wise Analysis

United States

Market Outlook

The United States vestibular testing system market is growing at a rapid pace, owing to the rising incidence of vestibular diseases such as balance related diseases, motion sickness and bicharotherapeutic. Increasing propensity of the elderly population towards these health issues, is another aspect driving the market.

Technological innovations, such as artificial intelligence (AI) and machine learning (ML) systems incorporated into diagnostic tools for vestibular disorders, are significantly improving the accuracy and efficiency of assessments. The growing number of top multinational medical device companies and a strong healthcare infrastructure help these systems find widespread commercial adoption.

Market Growth Factors

  • Widespread prevalence of vestibular diseases: The USA has an estimated 35% of the adult population aged 40 and above suffering from vestibular diseases, calling for efficient diagnostic solutions.
  • Aging Population: All the elderly face age-related balance problems hence increase the need for vestibular testing.
  • Technology: The integration of Artificial Intelligence (AI) and Machine Learning (ML) into vestibular testing systems is revolutionizing the market by significantly improving diagnostic accuracy.
  • Availability of Healthcare Infrastructure: Well-developed hospitals and medical infrastructure make it easier to implement such advanced diagnostic devices.
  • Government Initiatives: Funding of research in balance disorders and related technologies and supportive policies.

Market Forecast

Country CAGR (2025 to 2035)
United States 3.6%

India

Market Outlook

The increasing awareness regarding vestibular testing in the country as well as the developing healthcare infrastructure is positively impacting the India vestibular testing system market. The aging population poses a potential large patient pool for vestibular diagnostics. Additionally, government programs to improve healthcare access and affordability are contributing to more robust market growth.

Market Growth Factors

  • Large Patient Base: A substantial population with a growing number of elderly individuals increases demand for diagnostic services.
  • Healthcare Infrastructure Development: Investments in medical facilities improve access to diagnostic technologies.
  • Government Health Programs: Initiatives to raise awareness and provide affordable healthcare solutions.
  • Technological Adoption: Emergence of cost-effective and portable diagnostic devices suitable for diverse settings.
  • Educational Efforts: Training programs for healthcare professionals to effectively diagnose and manage vestibular disorders.

Market Forecast

Country CAGR (2025 to 2035)
India 7.6%

Germany

Market Outlook

The vestibular testing system market in Germany benefits from a robust healthcare system and a strong focus on research and development. The country has an elderly population, leading to various disorders of balance. Revolutionary diagnostic technologies are being developed through collaborations between academic institutions and medical device companies.

Market Growth Factors

  • The aged population is more prone to balance disorders, which is increasing the need for diagnostic systems.
  • Research Collaborations: University-industry partnerships that ensure technology innovations are built.
  • Spending on Healthcare: As healthcare spending spikes, the market for advanced medical devices grows.
  • Adoption of Technology: Use of advanced technologies in diagnostic devices increases accuracy.
  • Initiatives Related to Public Health: programs organized by the government to early identifying and managing vestibular disorders

Market Forecast

Country CAGR (2025 to 2035)
Germany 3.3%

China

Market Outlook

China vestibular testing market is experiencing high growth with rising healthcare investment and increasing prevalence of balance disorders. The government has made a commitment to improving healthcare infrastructure and access across the nation, which is a major driver of adoption for these advanced diagnostic technologies. The global market is dominated by vestibular health awareness, which is another driving factor for market growth.

Market Growth Factors

  • Healthcare Investments: Substantial government funding enhances medical infrastructure and services.
  • Rising Prevalence of Balance Disorders: An increase in conditions such as vertigo drives the need for diagnostic solutions.
  • Technological Advancements: Adoption of innovative diagnostic tools improves patient outcomes.
  • Aging Population: An expanding elderly demographic is more prone to vestibular disorders.
  • Public Awareness Campaigns: Efforts to educate the population on balance health and available diagnostics.

Market Forecast

Country CAGR (2025 to 2035)
China 7.0%

Brazil

Market Outlook

Brazil is the most lucrative market for vestibular testing systems due to the growing prevalence of balance disorders, coupled with rising medical technology advancements. Healthcare access is also hindered by economic barriers, but national health policies attempt to enhance local diagnostic services. Innovative diagnostic tools is aiding to enhance patient care as well as the growth of the market.

Market Growth Factors

  • Prevalence of Vestibular Disorders: A significant number of individuals experience balance-related issues, necessitating diagnostic solutions.
  • Healthcare Investments: Government funding to enhance medical infrastructure and services.
  • Technological Integration: Incorporation of advanced diagnostic equipment improves accuracy and efficiency.
  • Public Health Campaigns: Efforts to raise awareness about vestibular health and available diagnostics.
  • Medical Training Programs: Initiatives to equip healthcare professionals with skills to diagnose and manage balance disorders.

Market Forecast

Country CAGR (2025 to 2035)
Brazil 3.9%

Competitive Outlook

Vestibular Testing System Market Analysis Company

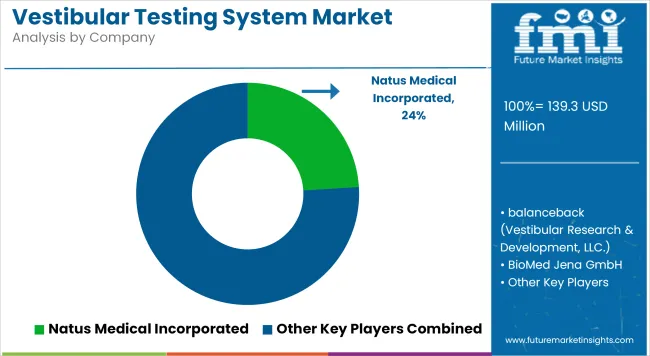
The vestibular testing system market is growing rapidly due to increasing awareness of balance disorders, rising geriatric populations, and advances in diagnostic technologies. These systems are essential in identifying vestibular dysfunctions linked to conditions like vertigo, Ménière’s disease, vestibular neuritis, and post-concussion syndrome.

Demand is being driven by hospitals, ENT clinics, and audiology labs seeking comprehensive and efficient diagnostic tools. The market is characterized by a mix of established diagnostic equipment manufacturers and innovators in video head impulse testing (vHIT), rotary chair systems, and caloric irrigation systems.

Recent Developments:

  • In 2024, Inventis has launched Celesta, a next-generation two-channel system for comprehensive auditory and vestibular evoked potential testing, which integrates seamlessly with their Maestro software and offers scalable, smart features to streamline clinical workflows and enhance diagnostic precision.
  • In 2025, Natus Sensory has commercially launched the ICS® Dizcovery VNG in the USA, introducing the first-ever all-in-one, plug-and-play VNG goggles that integrate with a unified diagnostic software platform for comprehensive vestibular assessment, including caloric testing and support for vHIT, to revolutionize workflows and enhance precision.

Companies

  • Natus Medical Incorporated
  • balanceback (Vestibular Research & Development, LLC.)
  • BioMed Jena GmbH
  • Neuro Kinetics, Inc
  • Micromedical Technologies
  • Instrumentation Difra SA
  • Interacoustics A/S
  • Synapsys (an Inventis company)
  • Bertec Corporation
  • Framiral

Key Segments

By Test Type:

Videonystagmography (VNG), Vestibular-evoked myogenic potential (VEMP), Rotary chair, Computerized Dynamic Posturography and Others

By End User:

Hospitals, Diagnostic Centers and Clinics

By Region:

North America, Latin America, Western Europe, Eastern Europe, East Asia, South Asia & Pacific, Middle East & Africa

Table of Content

  1. Executive Summary
  2. Industry Introduction, including Taxonomy and Market Definition
  3. Market Trends and Success Factors, including Macro-economic Factors, Market Dynamics, and Recent Industry Developments
  4. Global Market Demand (Value in USD) and Volume (Units) Analysis 2020 to 2024 and Forecast 2025 to 2035, including Historical Analysis and Future Projections
  5. Global Market - Pricing Analysis
  6. Global Market Analysis 2020 to 2024 and Forecast 2025 to 2035
    • By Test Type
    • By End User
    • By Region
  7. Global Market Analysis 2020 to 2024 and Forecast 2025 to 2035, by Test Type
    • Videonystagmography (VNG)
    • Vestibular-evoked myogenic potential (VEMP)
    • Rotary chair
    • Computerized Dynamic Posturography
    • Others
  8. Global Market Analysis 2020 to 2024 and Forecast 2025 to 2035, by End User
    • Hospitals
    • Diagnostic Centers
    • Clinics
  9. Global Market Analysis 2020 to 2024 and Forecast 2025 to 2035, by Region
    • North America
    • Latin America
    • East Asia
    • South Asia and Pacific
    • Western Europe
    • Eastern Europe
    • Middle East and Africa
  10. North America Sales Analysis 2020 to 2024 and Forecast 2025 to 2035, by Key Segments and Countries
  11. Latin America Sales Analysis 2020 to 2024 and Forecast 2025 to 2035, by Key Segments and Countries
  12. East Asia Sales Analysis 2020 to 2024 and Forecast 2025 to 2035, by Key Segments and Countries
  13. South Asia & Pacific Sales Analysis 2020 to 2024 and Forecast 2025 to 2035, by Key Segments and Countries
  14. Western Europe Sales Analysis 2020 to 2024 and Forecast 2025 to 2035, by Key Segments and Countries
  15. Eastern Europe Sales Analysis 2020 to 2024 and Forecast 2025 to 2035, by Key Segments and Countries
  16. Middle East and Africa Sales Analysis 2020 to 2024 and Forecast 2025 to 2035, by Key Segments and Countries
  17. Sales Forecast 2025 to 2035 by Test Type, and End User for 30 Countries
  18. Competition Outlook, including Market Structure Analysis, Company Share Analysis by Key Players, and Competition Dashboard
  19. Company Profile
    • Interacoustics A/S
    • GN Otometrics
    • Neuro Kinetics, Inc.
    • Micromedical Technologies
    • Difra Instrumentation
    • Synapsys (Inventis)
    • BioMed Jena GmbH
    • Balanceback (Vestibular Research & Education Foundation)
    • ICS Medical (historically significant in ENG systems)
    • Techno Concept
    • VertiScience

List of Tables

  • Table 1: Global Market Value (USD Million) Forecast by Region, 2020 to 2035
  • Table 2: Global Market Volume (Units) Forecast by Region, 2020 to 2035
  • Table 3: Global Market Value (USD Million) Forecast by Test Type, 2020 to 2035
  • Table 4: Global Market Volume (Units) Forecast by Test Type, 2020 to 2035
  • Table 5: Global Market Value (USD Million) Forecast by End User, 2020 to 2035
  • Table 6: Global Market Volume (Units) Forecast by End User, 2020 to 2035
  • Table 7: North America Market Value (USD Million) Forecast by Country, 2020 to 2035
  • Table 8: North America Market Volume (Units) Forecast by Country, 2020 to 2035
  • Table 9: North America Market Value (USD Million) Forecast by Test Type, 2020 to 2035
  • Table 10: North America Market Volume (Units) Forecast by Test Type, 2020 to 2035
  • Table 11: North America Market Value (USD Million) Forecast by End User, 2020 to 2035
  • Table 12: North America Market Volume (Units) Forecast by End User, 2020 to 2035
  • Table 13: Latin America Market Value (USD Million) Forecast by Country, 2020 to 2035
  • Table 14: Latin America Market Volume (Units) Forecast by Country, 2020 to 2035
  • Table 15: Latin America Market Value (USD Million) Forecast by Test Type, 2020 to 2035
  • Table 16: Latin America Market Volume (Units) Forecast by Test Type, 2020 to 2035
  • Table 17: Latin America Market Value (USD Million) Forecast by End User, 2020 to 2035
  • Table 18: Latin America Market Volume (Units) Forecast by End User, 2020 to 2035
  • Table 19: Western Europe Market Value (USD Million) Forecast by Country, 2020 to 2035
  • Table 20: Western Europe Market Volume (Units) Forecast by Country, 2020 to 2035
  • Table 21: Western Europe Market Value (USD Million) Forecast by Test Type, 2020 to 2035
  • Table 22: Western Europe Market Volume (Units) Forecast by Test Type, 2020 to 2035
  • Table 23: Western Europe Market Value (USD Million) Forecast by End User, 2020 to 2035
  • Table 24: Western Europe Market Volume (Units) Forecast by End User, 2020 to 2035
  • Table 25: Eastern Europe Market Value (USD Million) Forecast by Country, 2020 to 2035
  • Table 26: Eastern Europe Market Volume (Units) Forecast by Country, 2020 to 2035
  • Table 27: Eastern Europe Market Value (USD Million) Forecast by Test Type, 2020 to 2035
  • Table 28: Eastern Europe Market Volume (Units) Forecast by Test Type, 2020 to 2035
  • Table 29: Eastern Europe Market Value (USD Million) Forecast by End User, 2020 to 2035
  • Table 30: Eastern Europe Market Volume (Units) Forecast by End User, 2020 to 2035
  • Table 31: South Asia and Pacific Market Value (USD Million) Forecast by Country, 2020 to 2035
  • Table 32: South Asia and Pacific Market Volume (Units) Forecast by Country, 2020 to 2035
  • Table 33: South Asia and Pacific Market Value (USD Million) Forecast by Test Type, 2020 to 2035
  • Table 34: South Asia and Pacific Market Volume (Units) Forecast by Test Type, 2020 to 2035
  • Table 35: South Asia and Pacific Market Value (USD Million) Forecast by End User, 2020 to 2035
  • Table 36: South Asia and Pacific Market Volume (Units) Forecast by End User, 2020 to 2035
  • Table 37: East Asia Market Value (USD Million) Forecast by Country, 2020 to 2035
  • Table 38: East Asia Market Volume (Units) Forecast by Country, 2020 to 2035
  • Table 39: East Asia Market Value (USD Million) Forecast by Test Type, 2020 to 2035
  • Table 40: East Asia Market Volume (Units) Forecast by Test Type, 2020 to 2035
  • Table 41: East Asia Market Value (USD Million) Forecast by End User, 2020 to 2035
  • Table 42: East Asia Market Volume (Units) Forecast by End User, 2020 to 2035
  • Table 43: Middle East and Africa Market Value (USD Million) Forecast by Country, 2020 to 2035
  • Table 44: Middle East and Africa Market Volume (Units) Forecast by Country, 2020 to 2035
  • Table 45: Middle East and Africa Market Value (USD Million) Forecast by Test Type, 2020 to 2035
  • Table 46: Middle East and Africa Market Volume (Units) Forecast by Test Type, 2020 to 2035
  • Table 47: Middle East and Africa Market Value (USD Million) Forecast by End User, 2020 to 2035
  • Table 48: Middle East and Africa Market Volume (Units) Forecast by End User, 2020 to 2035

List of Figures

  • Figure 1: Global Market Value (USD Million) by Test Type, 2025 to 2035
  • Figure 2: Global Market Value (USD Million) by End User, 2025 to 2035
  • Figure 3: Global Market Value (USD Million) by Region, 2025 to 2035
  • Figure 4: Global Market Value (USD Million) Analysis by Region, 2020 to 2035
  • Figure 5: Global Market Volume (Units) Analysis by Region, 2020 to 2035
  • Figure 6: Global Market Value Share (%) and BPS Analysis by Region, 2025 to 2035
  • Figure 7: Global Market Y-o-Y Growth (%) Projections by Region, 2025 to 2035
  • Figure 8: Global Market Value (USD Million) Analysis by Test Type, 2020 to 2035
  • Figure 9: Global Market Volume (Units) Analysis by Test Type, 2020 to 2035
  • Figure 10: Global Market Value Share (%) and BPS Analysis by Test Type, 2025 to 2035
  • Figure 11: Global Market Y-o-Y Growth (%) Projections by Test Type, 2025 to 2035
  • Figure 12: Global Market Value (USD Million) Analysis by End User, 2020 to 2035
  • Figure 13: Global Market Volume (Units) Analysis by End User, 2020 to 2035
  • Figure 14: Global Market Value Share (%) and BPS Analysis by End User, 2025 to 2035
  • Figure 15: Global Market Y-o-Y Growth (%) Projections by End User, 2025 to 2035
  • Figure 16: Global Market Attractiveness by Test Type, 2025 to 2035
  • Figure 17: Global Market Attractiveness by End User, 2025 to 2035
  • Figure 18: Global Market Attractiveness by Region, 2025 to 2035
  • Figure 19: North America Market Value (USD Million) by Test Type, 2025 to 2035
  • Figure 20: North America Market Value (USD Million) by End User, 2025 to 2035
  • Figure 21: North America Market Value (USD Million) by Country, 2025 to 2035
  • Figure 22: North America Market Value (USD Million) Analysis by Country, 2020 to 2035
  • Figure 23: North America Market Volume (Units) Analysis by Country, 2020 to 2035
  • Figure 24: North America Market Value Share (%) and BPS Analysis by Country, 2025 to 2035
  • Figure 25: North America Market Y-o-Y Growth (%) Projections by Country, 2025 to 2035
  • Figure 26: North America Market Value (USD Million) Analysis by Test Type, 2020 to 2035
  • Figure 27: North America Market Volume (Units) Analysis by Test Type, 2020 to 2035
  • Figure 28: North America Market Value Share (%) and BPS Analysis by Test Type, 2025 to 2035
  • Figure 29: North America Market Y-o-Y Growth (%) Projections by Test Type, 2025 to 2035
  • Figure 30: North America Market Value (USD Million) Analysis by End User, 2020 to 2035
  • Figure 31: North America Market Volume (Units) Analysis by End User, 2020 to 2035
  • Figure 32: North America Market Value Share (%) and BPS Analysis by End User, 2025 to 2035
  • Figure 33: North America Market Y-o-Y Growth (%) Projections by End User, 2025 to 2035
  • Figure 34: North America Market Attractiveness by Test Type, 2025 to 2035
  • Figure 35: North America Market Attractiveness by End User, 2025 to 2035
  • Figure 36: North America Market Attractiveness by Country, 2025 to 2035
  • Figure 37: Latin America Market Value (USD Million) by Test Type, 2025 to 2035
  • Figure 38: Latin America Market Value (USD Million) by End User, 2025 to 2035
  • Figure 39: Latin America Market Value (USD Million) by Country, 2025 to 2035
  • Figure 40: Latin America Market Value (USD Million) Analysis by Country, 2020 to 2035
  • Figure 41: Latin America Market Volume (Units) Analysis by Country, 2020 to 2035
  • Figure 42: Latin America Market Value Share (%) and BPS Analysis by Country, 2025 to 2035
  • Figure 43: Latin America Market Y-o-Y Growth (%) Projections by Country, 2025 to 2035
  • Figure 44: Latin America Market Value (USD Million) Analysis by Test Type, 2020 to 2035
  • Figure 45: Latin America Market Volume (Units) Analysis by Test Type, 2020 to 2035
  • Figure 46: Latin America Market Value Share (%) and BPS Analysis by Test Type, 2025 to 2035
  • Figure 47: Latin America Market Y-o-Y Growth (%) Projections by Test Type, 2025 to 2035
  • Figure 48: Latin America Market Value (USD Million) Analysis by End User, 2020 to 2035
  • Figure 49: Latin America Market Volume (Units) Analysis by End User, 2020 to 2035
  • Figure 50: Latin America Market Value Share (%) and BPS Analysis by End User, 2025 to 2035
  • Figure 51: Latin America Market Y-o-Y Growth (%) Projections by End User, 2025 to 2035
  • Figure 52: Latin America Market Attractiveness by Test Type, 2025 to 2035
  • Figure 53: Latin America Market Attractiveness by End User, 2025 to 2035
  • Figure 54: Latin America Market Attractiveness by Country, 2025 to 2035
  • Figure 55: Western Europe Market Value (USD Million) by Test Type, 2025 to 2035
  • Figure 56: Western Europe Market Value (USD Million) by End User, 2025 to 2035
  • Figure 57: Western Europe Market Value (USD Million) by Country, 2025 to 2035
  • Figure 58: Western Europe Market Value (USD Million) Analysis by Country, 2020 to 2035
  • Figure 59: Western Europe Market Volume (Units) Analysis by Country, 2020 to 2035
  • Figure 60: Western Europe Market Value Share (%) and BPS Analysis by Country, 2025 to 2035
  • Figure 61: Western Europe Market Y-o-Y Growth (%) Projections by Country, 2025 to 2035
  • Figure 62: Western Europe Market Value (USD Million) Analysis by Test Type, 2020 to 2035
  • Figure 63: Western Europe Market Volume (Units) Analysis by Test Type, 2020 to 2035
  • Figure 64: Western Europe Market Value Share (%) and BPS Analysis by Test Type, 2025 to 2035
  • Figure 65: Western Europe Market Y-o-Y Growth (%) Projections by Test Type, 2025 to 2035
  • Figure 66: Western Europe Market Value (USD Million) Analysis by End User, 2020 to 2035
  • Figure 67: Western Europe Market Volume (Units) Analysis by End User, 2020 to 2035
  • Figure 68: Western Europe Market Value Share (%) and BPS Analysis by End User, 2025 to 2035
  • Figure 69: Western Europe Market Y-o-Y Growth (%) Projections by End User, 2025 to 2035
  • Figure 70: Western Europe Market Attractiveness by Test Type, 2025 to 2035
  • Figure 71: Western Europe Market Attractiveness by End User, 2025 to 2035
  • Figure 72: Western Europe Market Attractiveness by Country, 2025 to 2035
  • Figure 73: Eastern Europe Market Value (USD Million) by Test Type, 2025 to 2035
  • Figure 74: Eastern Europe Market Value (USD Million) by End User, 2025 to 2035
  • Figure 75: Eastern Europe Market Value (USD Million) by Country, 2025 to 2035
  • Figure 76: Eastern Europe Market Value (USD Million) Analysis by Country, 2020 to 2035
  • Figure 77: Eastern Europe Market Volume (Units) Analysis by Country, 2020 to 2035
  • Figure 78: Eastern Europe Market Value Share (%) and BPS Analysis by Country, 2025 to 2035
  • Figure 79: Eastern Europe Market Y-o-Y Growth (%) Projections by Country, 2025 to 2035
  • Figure 80: Eastern Europe Market Value (USD Million) Analysis by Test Type, 2020 to 2035
  • Figure 81: Eastern Europe Market Volume (Units) Analysis by Test Type, 2020 to 2035
  • Figure 82: Eastern Europe Market Value Share (%) and BPS Analysis by Test Type, 2025 to 2035
  • Figure 83: Eastern Europe Market Y-o-Y Growth (%) Projections by Test Type, 2025 to 2035
  • Figure 84: Eastern Europe Market Value (USD Million) Analysis by End User, 2020 to 2035
  • Figure 85: Eastern Europe Market Volume (Units) Analysis by End User, 2020 to 2035
  • Figure 86: Eastern Europe Market Value Share (%) and BPS Analysis by End User, 2025 to 2035
  • Figure 87: Eastern Europe Market Y-o-Y Growth (%) Projections by End User, 2025 to 2035
  • Figure 88: Eastern Europe Market Attractiveness by Test Type, 2025 to 2035
  • Figure 89: Eastern Europe Market Attractiveness by End User, 2025 to 2035
  • Figure 90: Eastern Europe Market Attractiveness by Country, 2025 to 2035
  • Figure 91: South Asia and Pacific Market Value (USD Million) by Test Type, 2025 to 2035
  • Figure 92: South Asia and Pacific Market Value (USD Million) by End User, 2025 to 2035
  • Figure 93: South Asia and Pacific Market Value (USD Million) by Country, 2025 to 2035
  • Figure 94: South Asia and Pacific Market Value (USD Million) Analysis by Country, 2020 to 2035
  • Figure 95: South Asia and Pacific Market Volume (Units) Analysis by Country, 2020 to 2035
  • Figure 96: South Asia and Pacific Market Value Share (%) and BPS Analysis by Country, 2025 to 2035
  • Figure 97: South Asia and Pacific Market Y-o-Y Growth (%) Projections by Country, 2025 to 2035
  • Figure 98: South Asia and Pacific Market Value (USD Million) Analysis by Test Type, 2020 to 2035
  • Figure 99: South Asia and Pacific Market Volume (Units) Analysis by Test Type, 2020 to 2035
  • Figure 100: South Asia and Pacific Market Value Share (%) and BPS Analysis by Test Type, 2025 to 2035
  • Figure 101: South Asia and Pacific Market Y-o-Y Growth (%) Projections by Test Type, 2025 to 2035
  • Figure 102: South Asia and Pacific Market Value (USD Million) Analysis by End User, 2020 to 2035
  • Figure 103: South Asia and Pacific Market Volume (Units) Analysis by End User, 2020 to 2035
  • Figure 104: South Asia and Pacific Market Value Share (%) and BPS Analysis by End User, 2025 to 2035
  • Figure 105: South Asia and Pacific Market Y-o-Y Growth (%) Projections by End User, 2025 to 2035
  • Figure 106: South Asia and Pacific Market Attractiveness by Test Type, 2025 to 2035
  • Figure 107: South Asia and Pacific Market Attractiveness by End User, 2025 to 2035
  • Figure 108: South Asia and Pacific Market Attractiveness by Country, 2025 to 2035
  • Figure 109: East Asia Market Value (USD Million) by Test Type, 2025 to 2035
  • Figure 110: East Asia Market Value (USD Million) by End User, 2025 to 2035
  • Figure 111: East Asia Market Value (USD Million) by Country, 2025 to 2035
  • Figure 112: East Asia Market Value (USD Million) Analysis by Country, 2020 to 2035
  • Figure 113: East Asia Market Volume (Units) Analysis by Country, 2020 to 2035
  • Figure 114: East Asia Market Value Share (%) and BPS Analysis by Country, 2025 to 2035
  • Figure 115: East Asia Market Y-o-Y Growth (%) Projections by Country, 2025 to 2035
  • Figure 116: East Asia Market Value (USD Million) Analysis by Test Type, 2020 to 2035
  • Figure 117: East Asia Market Volume (Units) Analysis by Test Type, 2020 to 2035
  • Figure 118: East Asia Market Value Share (%) and BPS Analysis by Test Type, 2025 to 2035
  • Figure 119: East Asia Market Y-o-Y Growth (%) Projections by Test Type, 2025 to 2035
  • Figure 120: East Asia Market Value (USD Million) Analysis by End User, 2020 to 2035
  • Figure 121: East Asia Market Volume (Units) Analysis by End User, 2020 to 2035
  • Figure 122: East Asia Market Value Share (%) and BPS Analysis by End User, 2025 to 2035
  • Figure 123: East Asia Market Y-o-Y Growth (%) Projections by End User, 2025 to 2035
  • Figure 124: East Asia Market Attractiveness by Test Type, 2025 to 2035
  • Figure 125: East Asia Market Attractiveness by End User, 2025 to 2035
  • Figure 126: East Asia Market Attractiveness by Country, 2025 to 2035
  • Figure 127: Middle East and Africa Market Value (USD Million) by Test Type, 2025 to 2035
  • Figure 128: Middle East and Africa Market Value (USD Million) by End User, 2025 to 2035
  • Figure 129: Middle East and Africa Market Value (USD Million) by Country, 2025 to 2035
  • Figure 130: Middle East and Africa Market Value (USD Million) Analysis by Country, 2020 to 2035
  • Figure 131: Middle East and Africa Market Volume (Units) Analysis by Country, 2020 to 2035
  • Figure 132: Middle East and Africa Market Value Share (%) and BPS Analysis by Country, 2025 to 2035
  • Figure 133: Middle East and Africa Market Y-o-Y Growth (%) Projections by Country, 2025 to 2035
  • Figure 134: Middle East and Africa Market Value (USD Million) Analysis by Test Type, 2020 to 2035
  • Figure 135: Middle East and Africa Market Volume (Units) Analysis by Test Type, 2020 to 2035
  • Figure 136: Middle East and Africa Market Value Share (%) and BPS Analysis by Test Type, 2025 to 2035
  • Figure 137: Middle East and Africa Market Y-o-Y Growth (%) Projections by Test Type, 2025 to 2035
  • Figure 138: Middle East and Africa Market Value (USD Million) Analysis by End User, 2020 to 2035
  • Figure 139: Middle East and Africa Market Volume (Units) Analysis by End User, 2020 to 2035
  • Figure 140: Middle East and Africa Market Value Share (%) and BPS Analysis by End User, 2025 to 2035
  • Figure 141: Middle East and Africa Market Y-o-Y Growth (%) Projections by End User, 2025 to 2035
  • Figure 142: Middle East and Africa Market Attractiveness by Test Type, 2025 to 2035
  • Figure 143: Middle East and Africa Market Attractiveness by End User, 2025 to 2035
  • Figure 144: Middle East and Africa Market Attractiveness by Country, 2025 to 2035

Frequently Asked Questions

What was the overall size of the Vestibular Testing System Market in 2025?

The overall market size for vestibular testing system market was USD 139.3 million in 2025.

How big is the Vestibular Testing System Market expected in 2035?

The vestibular testing system market is expected to reach USD 231.3 million in 2035.

What will drive the demand for Vestibular Testing System Market during the forecast period?

Growing utilization of vestibular testing in post-COVID neurorehabilitation programs is accelerating system adoption across rehabilitation centers.

List the top 5 Key players of the Vestibular Testing System Market?

The top key players that drives the development of vestibular testing system market are Interacoustics A/S, GN Otometrics, Neuro Kinetics, Inc., Micromedical Technologies, and Difra Instrumentation

Which segment in test type is expected to lead in Vestibular Testing System Market?

Videonystagmography (VNG) is expected to command significant share over the assessment period.

Explore Similar Insights

Future Market Insights

Vestibular Testing System Market