Vision Screener Market Outlook from 2025 to 2035

The vision screener market is advancing steadily, propelled by a rising focus on early detection of visual impairments and increasing demand for preventive ophthalmic care. Industry publications and clinical data reports have highlighted the growing burden of refractive errors, amblyopia, and other eye conditions across both pediatric and geriatric populations.

Healthcare institutions and school health programs are integrating vision screening into routine checkups, creating broader access to diagnostic tools. In response, manufacturers have intensified product development efforts around accuracy, portability, and automation, particularly in digital platforms.

Government-supported vision screening campaigns and partnerships with non-profit organizations have also expanded screening infrastructure in underdiagnosed regions. Technological enhancements in screening software, touch-screen interfaces, and wireless data integration are further streamlining workflows for clinicians and technicians. Looking ahead, market expansion is expected to be LED by rising adoption of digital and table-top devices for efficient screening, increased funding for vision care programs, and a growing emphasis on reducing undiagnosed visual disorders globally.
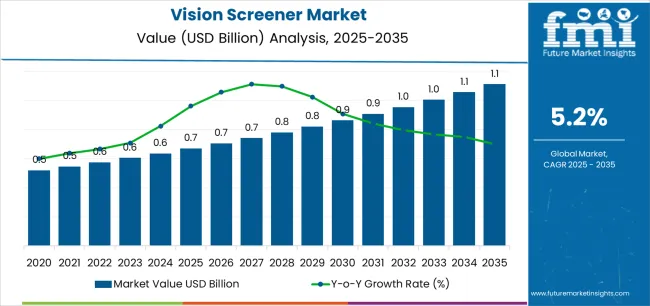
Quick Stats for Vision Screener Market

  • Vision Screener Market Industry Value (2025): USD 0.7 billion
  • Vision Screener Market Forecast Value (2035): USD 1.1 billion
  • Vision Screener Market Forecast CAGR: 5.2%
  • Leading Segment in Vision Screener Market in 2025: Table-Top Vision Screeners (33.5%)
  • Key Growth Region in Vision Screener Market: North America, Asia-Pacific, Europe
  • Top Key Players in Vision Screener Market: Hill-Rom Holdings, Inc., Essilor International S.A., Adaptica S.r.l., OCULUS Surgical, Inc., Plusoptix Inc., Honeywell International Inc., FIM Medical SAS, SHANGHAI TOP VIEW INDUSTRIAL CO., LTD., Thomson Screening Solutions Ltd., Keystone View

Vision Screener Market Market Value Analysis

Metric Value
Vision Screener Market Estimated Value in (2025 E) USD 0.7 billion
Vision Screener Market Forecast Value in (2035 F) USD 1.1 billion
Forecast CAGR (2025 to 2035) 5.2%

Segmental Analysis

The market is segmented by Product, Technology, Application, and End-Users and region. By Product, the market is divided into Table-Top Vision Screeners, Portable/Handheld Vision Screeners, and Vision Screening Software. In terms of Technology, the market is classified into Digital Vision Screeners and Computer-Based Vision Screeners. Based on Application, the market is segmented into Vision Screening Tests, Color Vision Test, Binocular Testing, and Others.

By End-Users, the market is divided into Hospitals, Homecare Settings, Specialized Clinics, Rehabilitation Centers, and Ambulatory Surgical Centers. Regionally, the market is classified into North America, Latin America, Western Europe, Eastern Europe, Balkan & Baltic Countries, Russia & Belarus, Central Asia, East Asia, South Asia & Pacific, and the Middle East & Africa.
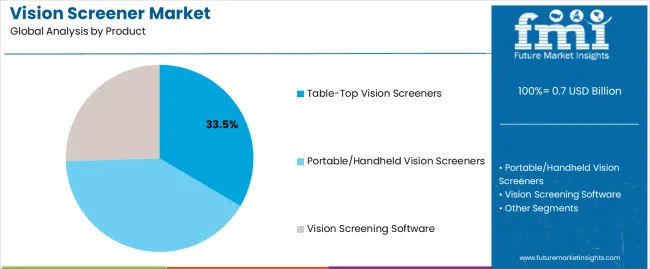
Insights into the Product Segment: Table-Top Vision Screeners

Vision Screener Market Analysis By Product

The Table-Top Vision Screeners segment is projected to hold 33.5% of the market revenue in 2025, reinforcing its importance in primary care and specialized vision testing environments. This segment’s growth has been influenced by the high reliability and consistency offered by fixed-base screening devices.

Clinics, hospitals, and optometric practices have adopted table-top screeners for their ergonomic designs, comprehensive test menus, and ability to integrate with electronic health records. Product innovation in terms of compact footprints and user-friendly controls has made table-top devices more accessible for medium-sized practices and community health centers.

Moreover, their superior measurement accuracy and patient throughput capabilities have reinforced their value in mass screening initiatives. As vision care professionals continue to prioritize precision and workflow efficiency, table-top screeners are expected to maintain strong relevance in the diagnostic landscape.
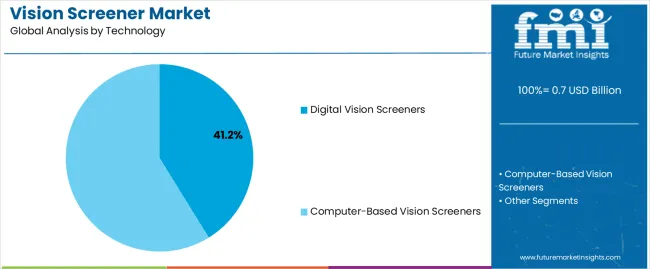
Insights into the Technology Segment: Digital Vision Screeners

Vision Screener Market Analysis By Technology

The Digital Vision Screeners segment is projected to account for 41.2% of the market revenue in 2025, making it the leading technology category. Growth of this segment has been driven by increasing adoption of fully automated, touch-enabled screening systems capable of delivering rapid and objective assessments.

Digital screeners have replaced manual testing procedures in many settings due to their ability to minimize operator dependency and standardize outcomes. Portable digital devices have gained popularity among pediatricians, mobile screening units, and school-based health programs, where convenience and speed are critical.

Technology advancements such as wireless connectivity, cloud integration, and AI-based result interpretation have enhanced usability and data management. These features have made digital screeners indispensable for large-scale vision health programs and tele-optometry services. As digital health continues to reshape clinical workflows, the digital vision screeners segment is expected to lead the technological transformation in the market.
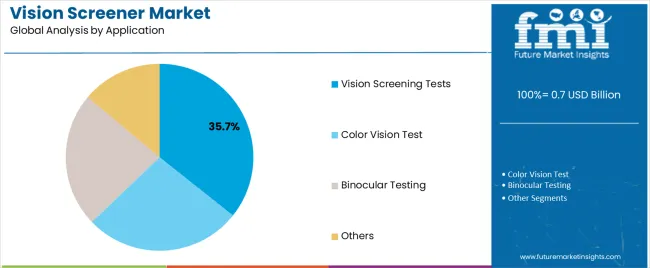
Insights into the Application Segment: Vision Screening Tests

Vision Screener Market Analysis By Application

The Vision Screening Tests segment is projected to contribute 35.7% of the market revenue in 2025, sustaining its dominance among application areas. This growth has been supported by the increased use of screening tests for early identification of refractive errors, visual acuity deficiencies, and binocular vision problems.

Public health initiatives, school-based programs, and pediatric wellness guidelines have promoted vision screening as a standard protocol, especially in populations at risk for developmental or learning issues. Clinics and screening service providers have prioritized efficient, standardized vision tests to improve diagnostic accuracy and treatment planning.

Furthermore, innovations in test algorithms and adaptive testing interfaces have expanded the scope and sensitivity of vision screening procedures. With growing clinical emphasis on proactive visual health and broader integration into community and occupational health settings, the Vision Screening Tests segment is expected to retain its leading role in driving market demand.

Semi Annual Market Update

The above table presents the expected CAGR for the global vision screener market over numerous semi-annual periods spanning from 2025 to 2035. In the first half (H1) of the decade from 2025 to 2035, the industry is predicted to surge at a CAGR of 5.8%, followed by a slightly lower growth rate of 5.7% in the second half (H2) of the same decade.

Particular Value CAGR
H1 5.8% (2025 to 2035)
H2 5.6% (2025 to 2035)
H1 5.4% (2025 to 2035)
H2 5.1% (2025 to 2035)

Moving into the subsequent period, from H1 2025 to H2 2035, the CAGR is projected to decrease slightly to 5.4% in the first half and remain relatively moderate at 5.1% in the second half.

Key Industry Highlights

Growing Demand for Vision Screener Market Owing to Government Initiatives

Lack of proper nutrition in new borns, especially in under developed economies, has resulted in numerous medical conditions. Increasing prevalence of vision problems in children is aiding the demand for treatments related to eye disorders.

Vision impairment is one of the most common medical conditions that young children are facing due to several reasons. Irregular eye checkups, inconsistent care, increased screen time, is some of the key factors resulting in vision impairment, sometimes blindness.

Around 6.8% of children under the age of 18 are diagnosed with vision and eye condition in the United States as per the Centers for Disease Control and Prevention. Over 3% of children under the age of 18 are visually impaired or have some eye related disorders.

Governments across the globe are undertaking several initiatives in collaboration with leading companies to spread awareness regarding treatment. Key players in the industry are developing innovative products to curb the prevalence of such disorders among children.

Governments worldwide are initiating several preschool programs, which enable preschool children to undergo vision screening tests. The initiatives are expected to increase the demand for the market.

High Cost of Advanced Screening Methods is Expected to Stifle Vision Screener Industry Growth

The high cost of improved screening methods is a significant barrier to growth in the industry. Numerous recent technologies with artificial and advanced imaging capabilities need substantial investment, making them less accessible to smaller clinics, rural healthcare professionals, and developing nations.

This costly barrier may impede the broad use and integration of sophisticated screeners, thus impeding overall sector growth. The cost element might have an impact on patient affordability, particularly in places without adequate healthcare funding or insurance coverage, limiting access to comprehensive eye care.

2020 to 2024 Global Vision Screener Sales Outlook Compared to Demand Forecast from 2025 to 2035

The global vision screener market recorded a CAGR of 4% during the historical period between 2020 and 2025. The growth of the sector was positive as this reached a value of USD 0.7 billion in 2025 from USD 0.5 billion in 2020.

Rapid developments in the healthcare and advancements in technology are augmenting the growth in the sector. Growing prevalence of vision impairment, especially among children, is propelling the demand.

Lack of proper nutrition, irregular eye checkups, and extensive usage of smartphones is resulting in vision impairment. To reduce the global burden, especially across underdeveloped regions, governments worldwide are undertaking several initiatives to create awareness.

Surging demand for early and accurate detection of medical conditions such as vision impairment, spot vision, and others has created lucrative prospects for players operating in the , especially across Asia Pacific excluding Japan.

As per the National Blindness & Visual Impairment Survey, prevalence of vision impairment and number of blind individuals in India surpassed 0.6 million by the end of 2025. The government anticipates, with the initiatives and improvement in healthcare infrastructure, 15.6 million persons can be saved from permanent blindness.

In response to such developments in emerging economies, key players operating in the sector are eyeing the regions to improve sales. Following the outbreak of COVID 19, awareness regarding health among people has surged significantly.

Demand for portable/handheld vision screeners, especially for patients in home care settings is expected to increase. Backed by the aforementioned factors, the global vision screener market is expected to witness robust growth over the forecast period.

Market Concentration

The market is organized and concentrated, with Tier 1, Tier 2, and Tier 3 firms. This segmentation depicts the competitive landscape and industry share distribution among several types of enterprises involved in the manufacture and distribution of vision screening equipment.

In 2025, Tier 1 firms are estimated to create USD 601.9 million in market concentration revenue, accounting for 55% of the overall industry share. Tier 1 organizations are often huge, well established businesses with vast research and development skills, strong distribution networks, and enormous industry impact.

Their overwhelming industry share demonstrates their leadership in driving innovation, creating industry standards, and offering a diverse variety of sophisticated vision screening products.

Tier 2 industry players, on the other hand, are expected to occupy 27% of the industry share by 2025. Tier 2 industry players are smaller than Tier 1 competitors, continue to play an important role in the industry.

Tier 2 firms frequently specialize on certain niches or areas, offering competitive goods that address unique demands in the vision screening industry. Tier 2 firms contribute to the industry by increasing product diversity, providing creative solutions, and promoting improved accessibility and affordability.

The market concentration reveals a competitive yet organized ecosystem in which Tier 1 and Tier 2 businesses are critical.

The dominance of Tier 1 industry players, along with a significant presence of Tier 2 competitors, guarantees a balanced industry dynamic, stimulating innovation and guaranteeing a diversified variety of high quality vision screening products are accessible to suit consumer demands. As the market evolves, the interaction between the levels will determine the future path of the.

Country-wise Insights

The section below covers the industry analysis for the vision screener market for different countries. demand analysis on key countries in several regions of the globe, including North America, Asia Pacific, Europe, and others, is provided. Canada is anticipated to remain at the forefront in North America, with a value share of 5.1% through 2035. In Asia Pacific, China is projected to witness a CAGR of 7.5% by 2035.

Countries Value CAGR (2025 to 2035)
China 7.5%
Canada 5.1%
The United States 4.3%
The United Kingdom 4.1%

Integration of Artificial Intelligence and Big Data Analytics Boosting Sales in China

China is expected ascend at a CAGR of 7.5% during the forecast period. The combination of artificial intelligence and big data analytics is considerably boosting the sector, improving diagnosis accuracy and efficiency.

Artificial intelligence systems examine massive volumes of data from vision tests to detect trends and forecast probable visual issues with high accuracy. This skill enables early identification and appropriate intervention, which are critical for avoiding serious visual deficits.

Big data analytics, on the other hand, allows for the consolidation and analysis of massive datasets, resulting in insights into trends and outcomes that help clinicians make better decisions. This connection also allows for individualized eye care, since artificial intelligence may adapt suggestions based on specific patient data, enhancing therapy efficacy.

Artificial intelligence powered vision screener may continuously learn and improve, guaranteeing that diagnostic tools grow more effective over time.

By simplifying the screening process and decreasing the strain on healthcare practitioners, the combination of artificial intelligence and big data analytics is driving innovation and sector growth, eventually leading to better patient outcomes.
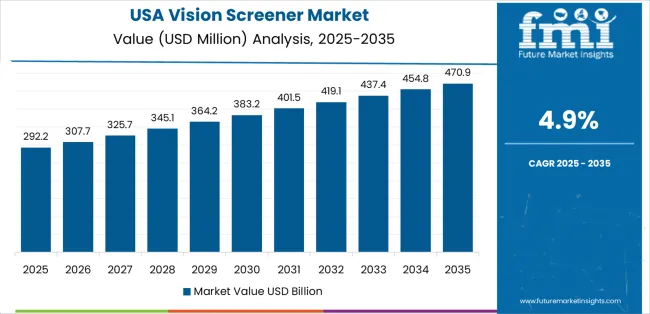
Cost Effective Prices to Drive Demand for Vision Screener Market in the United States

Vision Screener Market Country Value Analysis

The United States market is expected ascend at a CAGR of 4.3% during forecast period. Growing prevalence of vision impairment, improved healthcare infrastructure, and cost effective prices of vision screener devices and treatment are key factors supporting the sector growth in the United States.

With the presence of leading companies in the United States, coupled with increasing development and innovation of the devices, demand in the United States is expected to propel.

Surging Prevalence of Vision Impairment to Drive Demand in the United Kingdom

The United Kingdom is expected to garner a CAGR of 4.1% during forecast period. In the United Kingdom, there are nearly 2 million people suffering from vision loss and around 360,000 diagnosed a visually impaired or partially blind, according to the United Kingdom National Health Statistics. The United Kingdom is expected to be among the most lucrative pockets in Europe for market players.

Growth in the country is attributable to the growing prevalence of vision impairment among the children and the geriatric population. Improved healthcare infrastructure and technological advancements in the digital vision screener devices will aid the growth in the sector.

The presence of leading companies and innovation in portable vision screener for the patients in home care setting in the United Kingdom is expected to favor the growth in the sector.

Category-wise Insights

The section contains information about the leading segments in the sector. By product, the handheld vision screener segment held an industry share of 56.1% in 2025. Vision screening tests segment held an industry share of 32% in 2025.

Handheld Vision Screeners to Constitute a Substantial Part of all Vision Screener Sales

Product Handheld Vision Screeners
Value Share (2025) 56.1%

The handheld vision screener segment dominates the sector, accounting for an industry share of 56.1% in 2025. The rising emphasis on early detection and preventative eye health, along with technical advances in mobile devices, has increased their popularity. The segment is dominating the sector, increasing global access to essential vision screening services.

Vision Screening Tests to Comprise Major Chunk of Global Vision Screeners Market Revenue

Application Vision Screening Tests
Value Share (2035) 32%

The vision screening tests segment is forecast to account for a market share of 32% in 2025. Growing prevalence of vision impairment and eye related disorders is burgeoning the need for vision screening tests.

Governments and private healthcare organizations in emerging economies are organizing free vision screening tests to curb the burden of blindness and vision impairment. Increasing number of ophthalmic eye centers and multispecialty clinics worldwide are expected to aid the adoption of vision screening tests on the back growing prevalence of eye related disorders.

Competitive Landscape

The global vision screener market is expected to be consolidated in nature. Tier-1 companies actively operating in the global sector. Some of the leading players are focusing on developing digital vision screener to capitalize on the surging trend, especially in the United States and Germany, to expand their global presence. Other key players are investing extensively in research & development activities for innovation for paediatric vision screener.

Recent Industry Developments in Vision Screener Market

  • In April 2025, EssilorLuxottica has completed the purchase of Washin to expand its optical retail footprint in Japan.

Key Players of Vision Screener Industry

  • Hill-Rom Holdings, Inc.
  • Essilor International S.A.
  • Adaptica S.r.l.
  • OCULUS Surgical, Inc.
  • Plusoptix Inc.
  • Honeywell International Inc.
  • FIM Medical SAS
  • SHANGHAI TOP VIEW INDUSTRIAL CO., LTD.
  • Thomson Screening Solutions Ltd.
  • Keystone View

Key Segments of Vision Screener Market

By Product:

In terms of product, the sector is divided into table-top vision screeners, portable/handheld vision screener and vision screening software.

By Technology:

By technology, the sector is divided into digital vision Screener and computer-based vision screeners.

By Application:

By application, the sector is divided into vision screening tests, color vision test, binocular testing and others.

By End user:

The sector is classified by end user as hospitals, homecare settings, specialized clinics, rehabilitation centers and ambulatory surgical centers.

By Region:

Key countries of North America, Latin America, Western Europe, South Asia, East Asia, Eastern Europe and Middle East & Africa have been covered in the report.

Frequently Asked Questions

How big is the vision screener market in 2025?

The global vision screener market is estimated to be valued at USD 0.7 billion in 2025.

What will be the size of vision screener market in 2035?

The market size for the vision screener market is projected to reach USD 1.1 billion by 2035.

How much will be the vision screener market growth between 2025 and 2035?

The vision screener market is expected to grow at a 5.2% CAGR between 2025 and 2035.

What are the key product types in the vision screener market?

The key product types in vision screener market are table-top vision screeners, portable/handheld vision screeners and vision screening software.

Which technology segment to contribute significant share in the vision screener market in 2025?

In terms of technology, digital vision screeners segment to command 41.2% share in the vision screener market in 2025.

Table of Content

  1. Executive Summary
    • Global Market Outlook
    • Demand to side Trends
    • Supply to side Trends
    • Technology Roadmap Analysis
    • Analysis and Recommendations
  2. Market Overview
    • Market Coverage / Taxonomy
    • Market Definition / Scope / Limitations
  3. Market Background
    • Market Dynamics
      • Drivers
      • Restraints
      • Opportunity
      • Trends
    • Scenario Forecast
      • Demand in Optimistic Scenario
      • Demand in Likely Scenario
      • Demand in Conservative Scenario
    • Opportunity Map Analysis
    • Product Life Cycle Analysis
    • Supply Chain Analysis
    • Investment Feasibility Matrix
    • Value Chain Analysis
    • PESTLE and Porter’s Analysis
    • Regulatory Landscape
    • Regional Parent Market Outlook
    • Production and Consumption Statistics
    • Import and Export Statistics
  4. Global Market Analysis 2020 to 2025 and Forecast, 2025 to 2035
    • Historical Market Size Value (USD Million) Analysis, 2020 to 2025
    • Current and Future Market Size Value (USD Million) Projections, 2025 to 2035
      • Y to o to Y Growth Trend Analysis
      • Absolute $ Opportunity Analysis
  5. Global Market Pricing Analysis 2020 to 2025 and Forecast 2025 to 2035
  6. Global Market Analysis 2020 to 2025 and Forecast 2025 to 2035, By Product
    • Introduction / Key Findings
    • Historical Market Size Value (USD Million) Analysis By Product , 2020 to 2025
    • Current and Future Market Size Value (USD Million) Analysis and Forecast By Product , 2025 to 2035
      • Table-Top Vision Screeners
      • Portable/Handheld Vision Screeners
      • Vision Screening Software
    • Y to o to Y Growth Trend Analysis By Product , 2020 to 2025
    • Absolute $ Opportunity Analysis By Product , 2025 to 2035
  7. Global Market Analysis 2020 to 2025 and Forecast 2025 to 2035, By Technology
    • Introduction / Key Findings
    • Historical Market Size Value (USD Million) Analysis By Technology, 2020 to 2025
    • Current and Future Market Size Value (USD Million) Analysis and Forecast By Technology, 2025 to 2035
      • Digital Vision Screeners
      • Computer-Based Vision Screeners
    • Y to o to Y Growth Trend Analysis By Technology, 2020 to 2025
    • Absolute $ Opportunity Analysis By Technology, 2025 to 2035
  8. Global Market Analysis 2020 to 2025 and Forecast 2025 to 2035, By Application
    • Introduction / Key Findings
    • Historical Market Size Value (USD Million) Analysis By Application, 2020 to 2025
    • Current and Future Market Size Value (USD Million) Analysis and Forecast By Application, 2025 to 2035
      • Vision Screening Tests
      • Color Vision Test
      • Binocular Testing
      • Others
    • Y to o to Y Growth Trend Analysis By Application, 2020 to 2025
    • Absolute $ Opportunity Analysis By Application, 2025 to 2035
  9. Global Market Analysis 2020 to 2025 and Forecast 2025 to 2035, By End-Users
    • Introduction / Key Findings
    • Historical Market Size Value (USD Million) Analysis By End-Users, 2020 to 2025
    • Current and Future Market Size Value (USD Million) Analysis and Forecast By End-Users, 2025 to 2035
      • Hospitals
      • Homecare Settings
      • Specialized Clinics
      • Rehabilitation Centers
      • Ambulatory Surgical Centers
    • Y to o to Y Growth Trend Analysis By End-Users, 2020 to 2025
    • Absolute $ Opportunity Analysis By End-Users, 2025 to 2035
  10. Global Market Analysis 2020 to 2025 and Forecast 2025 to 2035, By Region
    • Introduction
    • Historical Market Size Value (USD Million) Analysis By Region, 2020 to 2025
    • Current Market Size Value (USD Million) Analysis and Forecast By Region, 2025 to 2035
      • North America
      • Latin America
      • Western Europe
      • Eastern Europe
      • East Asia
      • South Asia and Pacific
      • Middle East & Africa
    • Market Attractiveness Analysis By Region
  11. North America Market Analysis 2020 to 2025 and Forecast 2025 to 2035, By Country
    • Historical Market Size Value (USD Million) Trend Analysis By Market Taxonomy, 2020 to 2025
    • Market Size Value (USD Million) Forecast By Market Taxonomy, 2025 to 2035
      • By Country
        • USA
        • Canada
        • Mexico
      • By Product
      • By Technology
      • By Application
      • By End-Users
    • Market Attractiveness Analysis
      • By Country
      • By Product
      • By Technology
      • By Application
      • By End-Users
    • Key Takeaways
  12. Latin America Market Analysis 2020 to 2025 and Forecast 2025 to 2035, By Country
    • Historical Market Size Value (USD Million) Trend Analysis By Market Taxonomy, 2020 to 2025
    • Market Size Value (USD Million) Forecast By Market Taxonomy, 2025 to 2035
      • By Country
        • Brazil
        • Chile
        • Rest of Latin America
      • By Product
      • By Technology
      • By Application
      • By End-Users
    • Market Attractiveness Analysis
      • By Country
      • By Product
      • By Technology
      • By Application
      • By End-Users
    • Key Takeaways
  13. Western Europe Market Analysis 2020 to 2025 and Forecast 2025 to 2035, By Country
    • Historical Market Size Value (USD Million) Trend Analysis By Market Taxonomy, 2020 to 2025
    • Market Size Value (USD Million) Forecast By Market Taxonomy, 2025 to 2035
      • By Country
        • Germany
        • UK
        • Italy
        • Spain
        • France
        • Nordic
        • BENELUX
        • Rest of Western Europe
      • By Product
      • By Technology
      • By Application
      • By End-Users
    • Market Attractiveness Analysis
      • By Country
      • By Product
      • By Technology
      • By Application
      • By End-Users
    • Key Takeaways
  14. Eastern Europe Market Analysis 2020 to 2025 and Forecast 2025 to 2035, By Country
    • Historical Market Size Value (USD Million) Trend Analysis By Market Taxonomy, 2020 to 2025
    • Market Size Value (USD Million) Forecast By Market Taxonomy, 2025 to 2035
      • By Country
        • Russia
        • Poland
        • Hungary
        • Balkan & Baltic
        • Rest of Eastern Europe
      • By Product
      • By Technology
      • By Application
      • By End-Users
    • Market Attractiveness Analysis
      • By Country
      • By Product
      • By Technology
      • By Application
      • By End-Users
    • Key Takeaways
  15. East Asia Market Analysis 2020 to 2025 and Forecast 2025 to 2035, By Country
    • Historical Market Size Value (USD Million) Trend Analysis By Market Taxonomy, 2020 to 2025
    • Market Size Value (USD Million) Forecast By Market Taxonomy, 2025 to 2035
      • By Country
        • China
        • Japan
        • South Korea
      • By Product
      • By Technology
      • By Application
      • By End-Users
    • Market Attractiveness Analysis
      • By Country
      • By Product
      • By Technology
      • By Application
      • By End-Users
    • Key Takeaways
  16. South Asia and Pacific Market Analysis 2020 to 2025 and Forecast 2025 to 2035, By Country
    • Historical Market Size Value (USD Million) Trend Analysis By Market Taxonomy, 2020 to 2025
    • Market Size Value (USD Million) Forecast By Market Taxonomy, 2025 to 2035
      • By Country
        • India
        • ASEAN
        • Australia & New Zealand
        • Rest of South Asia and Pacific
      • By Product
      • By Technology
      • By Application
      • By End-Users
    • Market Attractiveness Analysis
      • By Country
      • By Product
      • By Technology
      • By Application
      • By End-Users
    • Key Takeaways
  17. Middle East & Africa Market Analysis 2020 to 2025 and Forecast 2025 to 2035, By Country
    • Historical Market Size Value (USD Million) Trend Analysis By Market Taxonomy, 2020 to 2025
    • Market Size Value (USD Million) Forecast By Market Taxonomy, 2025 to 2035
      • By Country
        • Kingdom of Saudi Arabia
        • Other GCC Countries
        • Turkiye
        • South Africa
        • Other African Union
        • Rest of Middle East & Africa
      • By Product
      • By Technology
      • By Application
      • By End-Users
    • Market Attractiveness Analysis
      • By Country
      • By Product
      • By Technology
      • By Application
      • By End-Users
    • Key Takeaways
  18. Key Countries Market Analysis
    • USA
      • Pricing Analysis
      • Market Share Analysis, 2025
        • By Product
        • By Technology
        • By Application
        • By End-Users
    • Canada
      • Pricing Analysis
      • Market Share Analysis, 2025
        • By Product
        • By Technology
        • By Application
        • By End-Users
    • Mexico
      • Pricing Analysis
      • Market Share Analysis, 2025
        • By Product
        • By Technology
        • By Application
        • By End-Users
    • Brazil
      • Pricing Analysis
      • Market Share Analysis, 2025
        • By Product
        • By Technology
        • By Application
        • By End-Users
    • Chile
      • Pricing Analysis
      • Market Share Analysis, 2025
        • By Product
        • By Technology
        • By Application
        • By End-Users
    • Germany
      • Pricing Analysis
      • Market Share Analysis, 2025
        • By Product
        • By Technology
        • By Application
        • By End-Users
    • UK
      • Pricing Analysis
      • Market Share Analysis, 2025
        • By Product
        • By Technology
        • By Application
        • By End-Users
    • Italy
      • Pricing Analysis
      • Market Share Analysis, 2025
        • By Product
        • By Technology
        • By Application
        • By End-Users
    • Spain
      • Pricing Analysis
      • Market Share Analysis, 2025
        • By Product
        • By Technology
        • By Application
        • By End-Users
    • France
      • Pricing Analysis
      • Market Share Analysis, 2025
        • By Product
        • By Technology
        • By Application
        • By End-Users
    • India
      • Pricing Analysis
      • Market Share Analysis, 2025
        • By Product
        • By Technology
        • By Application
        • By End-Users
    • ASEAN
      • Pricing Analysis
      • Market Share Analysis, 2025
        • By Product
        • By Technology
        • By Application
        • By End-Users
    • Australia & New Zealand
      • Pricing Analysis
      • Market Share Analysis, 2025
        • By Product
        • By Technology
        • By Application
        • By End-Users
    • China
      • Pricing Analysis
      • Market Share Analysis, 2025
        • By Product
        • By Technology
        • By Application
        • By End-Users
    • Japan
      • Pricing Analysis
      • Market Share Analysis, 2025
        • By Product
        • By Technology
        • By Application
        • By End-Users
    • South Korea
      • Pricing Analysis
      • Market Share Analysis, 2025
        • By Product
        • By Technology
        • By Application
        • By End-Users
    • Russia
      • Pricing Analysis
      • Market Share Analysis, 2025
        • By Product
        • By Technology
        • By Application
        • By End-Users
    • Poland
      • Pricing Analysis
      • Market Share Analysis, 2025
        • By Product
        • By Technology
        • By Application
        • By End-Users
    • Hungary
      • Pricing Analysis
      • Market Share Analysis, 2025
        • By Product
        • By Technology
        • By Application
        • By End-Users
    • Kingdom of Saudi Arabia
      • Pricing Analysis
      • Market Share Analysis, 2025
        • By Product
        • By Technology
        • By Application
        • By End-Users
    • Turkiye
      • Pricing Analysis
      • Market Share Analysis, 2025
        • By Product
        • By Technology
        • By Application
        • By End-Users
    • South Africa
      • Pricing Analysis
      • Market Share Analysis, 2025
        • By Product
        • By Technology
        • By Application
        • By End-Users
  19. Market Structure Analysis
    • Competition Dashboard
    • Competition Benchmarking
    • Market Share Analysis of Top Players
      • By Regional
      • By Product
      • By Technology
      • By Application
      • By End-Users
  20. Competition Analysis
    • Competition Deep Dive
      • Hill-Rom Holdings, Inc.
        • Overview
        • Product Portfolio
        • Profitability by Market Segments (Product/Age /Sales Channel/Region)
        • Sales Footprint
        • Strategy Overview
          • Marketing Strategy
          • Product Strategy
          • Channel Strategy
      • Essilor International S.A.
      • Adaptica S.r.l.
      • OCULUS Surgical, Inc.
      • Plusoptix Inc.
      • Honeywell International Inc.
      • FIM Medical SAS
      • SHANGHAI TOP VIEW INDUSTRIAL CO., LTD.
      • Thomson Screening Solutions Ltd.
      • Keystone View
  21. Assumptions & Acronyms Used
  22. Research Methodology

List of Tables

  • Table 1: Global Market Value (USD Million) Forecast by Region, 2020 to 2035
  • Table 2: Global Market Value (USD Million) Forecast by Product , 2020 to 2035
  • Table 3: Global Market Value (USD Million) Forecast by Technology, 2020 to 2035
  • Table 4: Global Market Value (USD Million) Forecast by Application, 2020 to 2035
  • Table 5: Global Market Value (USD Million) Forecast by End-Users, 2020 to 2035
  • Table 6: North America Market Value (USD Million) Forecast by Country, 2020 to 2035
  • Table 7: North America Market Value (USD Million) Forecast by Product , 2020 to 2035
  • Table 8: North America Market Value (USD Million) Forecast by Technology, 2020 to 2035
  • Table 9: North America Market Value (USD Million) Forecast by Application, 2020 to 2035
  • Table 10: North America Market Value (USD Million) Forecast by End-Users, 2020 to 2035
  • Table 11: Latin America Market Value (USD Million) Forecast by Country, 2020 to 2035
  • Table 12: Latin America Market Value (USD Million) Forecast by Product , 2020 to 2035
  • Table 13: Latin America Market Value (USD Million) Forecast by Technology, 2020 to 2035
  • Table 14: Latin America Market Value (USD Million) Forecast by Application, 2020 to 2035
  • Table 15: Latin America Market Value (USD Million) Forecast by End-Users, 2020 to 2035
  • Table 16: Western Europe Market Value (USD Million) Forecast by Country, 2020 to 2035
  • Table 17: Western Europe Market Value (USD Million) Forecast by Product , 2020 to 2035
  • Table 18: Western Europe Market Value (USD Million) Forecast by Technology, 2020 to 2035
  • Table 19: Western Europe Market Value (USD Million) Forecast by Application, 2020 to 2035
  • Table 20: Western Europe Market Value (USD Million) Forecast by End-Users, 2020 to 2035
  • Table 21: Eastern Europe Market Value (USD Million) Forecast by Country, 2020 to 2035
  • Table 22: Eastern Europe Market Value (USD Million) Forecast by Product , 2020 to 2035
  • Table 23: Eastern Europe Market Value (USD Million) Forecast by Technology, 2020 to 2035
  • Table 24: Eastern Europe Market Value (USD Million) Forecast by Application, 2020 to 2035
  • Table 25: Eastern Europe Market Value (USD Million) Forecast by End-Users, 2020 to 2035
  • Table 26: East Asia Market Value (USD Million) Forecast by Country, 2020 to 2035
  • Table 27: East Asia Market Value (USD Million) Forecast by Product , 2020 to 2035
  • Table 28: East Asia Market Value (USD Million) Forecast by Technology, 2020 to 2035
  • Table 29: East Asia Market Value (USD Million) Forecast by Application, 2020 to 2035
  • Table 30: East Asia Market Value (USD Million) Forecast by End-Users, 2020 to 2035
  • Table 31: South Asia and Pacific Market Value (USD Million) Forecast by Country, 2020 to 2035
  • Table 32: South Asia and Pacific Market Value (USD Million) Forecast by Product , 2020 to 2035
  • Table 33: South Asia and Pacific Market Value (USD Million) Forecast by Technology, 2020 to 2035
  • Table 34: South Asia and Pacific Market Value (USD Million) Forecast by Application, 2020 to 2035
  • Table 35: South Asia and Pacific Market Value (USD Million) Forecast by End-Users, 2020 to 2035
  • Table 36: Middle East & Africa Market Value (USD Million) Forecast by Country, 2020 to 2035
  • Table 37: Middle East & Africa Market Value (USD Million) Forecast by Product , 2020 to 2035
  • Table 38: Middle East & Africa Market Value (USD Million) Forecast by Technology, 2020 to 2035
  • Table 39: Middle East & Africa Market Value (USD Million) Forecast by Application, 2020 to 2035
  • Table 40: Middle East & Africa Market Value (USD Million) Forecast by End-Users, 2020 to 2035

List of Figures

  • Figure 1: Global Market Pricing Analysis
  • Figure 2: Global Market Value (USD Million) Forecast 2020-2035
  • Figure 3: Global Market Value Share and BPS Analysis by Product , 2025 and 2035
  • Figure 4: Global Market Y to o to Y Growth Comparison by Product , 2025-2035
  • Figure 5: Global Market Attractiveness Analysis by Product
  • Figure 6: Global Market Value Share and BPS Analysis by Technology, 2025 and 2035
  • Figure 7: Global Market Y to o to Y Growth Comparison by Technology, 2025-2035
  • Figure 8: Global Market Attractiveness Analysis by Technology
  • Figure 9: Global Market Value Share and BPS Analysis by Application, 2025 and 2035
  • Figure 10: Global Market Y to o to Y Growth Comparison by Application, 2025-2035
  • Figure 11: Global Market Attractiveness Analysis by Application
  • Figure 12: Global Market Value Share and BPS Analysis by End-Users, 2025 and 2035
  • Figure 13: Global Market Y to o to Y Growth Comparison by End-Users, 2025-2035
  • Figure 14: Global Market Attractiveness Analysis by End-Users
  • Figure 15: Global Market Value (USD Million) Share and BPS Analysis by Region, 2025 and 2035
  • Figure 16: Global Market Y to o to Y Growth Comparison by Region, 2025-2035
  • Figure 17: Global Market Attractiveness Analysis by Region
  • Figure 18: North America Market Incremental Dollar Opportunity, 2025-2035
  • Figure 19: Latin America Market Incremental Dollar Opportunity, 2025-2035
  • Figure 20: Western Europe Market Incremental Dollar Opportunity, 2025-2035
  • Figure 21: Eastern Europe Market Incremental Dollar Opportunity, 2025-2035
  • Figure 22: East Asia Market Incremental Dollar Opportunity, 2025-2035
  • Figure 23: South Asia and Pacific Market Incremental Dollar Opportunity, 2025-2035
  • Figure 24: Middle East & Africa Market Incremental Dollar Opportunity, 2025-2035
  • Figure 25: North America Market Value Share and BPS Analysis by Country, 2025 and 2035
  • Figure 26: North America Market Value Share and BPS Analysis by Product , 2025 and 2035
  • Figure 27: North America Market Y to o to Y Growth Comparison by Product , 2025-2035
  • Figure 28: North America Market Attractiveness Analysis by Product
  • Figure 29: North America Market Value Share and BPS Analysis by Technology, 2025 and 2035
  • Figure 30: North America Market Y to o to Y Growth Comparison by Technology, 2025-2035
  • Figure 31: North America Market Attractiveness Analysis by Technology
  • Figure 32: North America Market Value Share and BPS Analysis by Application, 2025 and 2035
  • Figure 33: North America Market Y to o to Y Growth Comparison by Application, 2025-2035
  • Figure 34: North America Market Attractiveness Analysis by Application
  • Figure 35: North America Market Value Share and BPS Analysis by End-Users, 2025 and 2035
  • Figure 36: North America Market Y to o to Y Growth Comparison by End-Users, 2025-2035
  • Figure 37: North America Market Attractiveness Analysis by End-Users
  • Figure 38: Latin America Market Value Share and BPS Analysis by Country, 2025 and 2035
  • Figure 39: Latin America Market Value Share and BPS Analysis by Product , 2025 and 2035
  • Figure 40: Latin America Market Y to o to Y Growth Comparison by Product , 2025-2035
  • Figure 41: Latin America Market Attractiveness Analysis by Product
  • Figure 42: Latin America Market Value Share and BPS Analysis by Technology, 2025 and 2035
  • Figure 43: Latin America Market Y to o to Y Growth Comparison by Technology, 2025-2035
  • Figure 44: Latin America Market Attractiveness Analysis by Technology
  • Figure 45: Latin America Market Value Share and BPS Analysis by Application, 2025 and 2035
  • Figure 46: Latin America Market Y to o to Y Growth Comparison by Application, 2025-2035
  • Figure 47: Latin America Market Attractiveness Analysis by Application
  • Figure 48: Latin America Market Value Share and BPS Analysis by End-Users, 2025 and 2035
  • Figure 49: Latin America Market Y to o to Y Growth Comparison by End-Users, 2025-2035
  • Figure 50: Latin America Market Attractiveness Analysis by End-Users
  • Figure 51: Western Europe Market Value Share and BPS Analysis by Country, 2025 and 2035
  • Figure 52: Western Europe Market Value Share and BPS Analysis by Product , 2025 and 2035
  • Figure 53: Western Europe Market Y to o to Y Growth Comparison by Product , 2025-2035
  • Figure 54: Western Europe Market Attractiveness Analysis by Product
  • Figure 55: Western Europe Market Value Share and BPS Analysis by Technology, 2025 and 2035
  • Figure 56: Western Europe Market Y to o to Y Growth Comparison by Technology, 2025-2035
  • Figure 57: Western Europe Market Attractiveness Analysis by Technology
  • Figure 58: Western Europe Market Value Share and BPS Analysis by Application, 2025 and 2035
  • Figure 59: Western Europe Market Y to o to Y Growth Comparison by Application, 2025-2035
  • Figure 60: Western Europe Market Attractiveness Analysis by Application
  • Figure 61: Western Europe Market Value Share and BPS Analysis by End-Users, 2025 and 2035
  • Figure 62: Western Europe Market Y to o to Y Growth Comparison by End-Users, 2025-2035
  • Figure 63: Western Europe Market Attractiveness Analysis by End-Users
  • Figure 64: Eastern Europe Market Value Share and BPS Analysis by Country, 2025 and 2035
  • Figure 65: Eastern Europe Market Value Share and BPS Analysis by Product , 2025 and 2035
  • Figure 66: Eastern Europe Market Y to o to Y Growth Comparison by Product , 2025-2035
  • Figure 67: Eastern Europe Market Attractiveness Analysis by Product
  • Figure 68: Eastern Europe Market Value Share and BPS Analysis by Technology, 2025 and 2035
  • Figure 69: Eastern Europe Market Y to o to Y Growth Comparison by Technology, 2025-2035
  • Figure 70: Eastern Europe Market Attractiveness Analysis by Technology
  • Figure 71: Eastern Europe Market Value Share and BPS Analysis by Application, 2025 and 2035
  • Figure 72: Eastern Europe Market Y to o to Y Growth Comparison by Application, 2025-2035
  • Figure 73: Eastern Europe Market Attractiveness Analysis by Application
  • Figure 74: Eastern Europe Market Value Share and BPS Analysis by End-Users, 2025 and 2035
  • Figure 75: Eastern Europe Market Y to o to Y Growth Comparison by End-Users, 2025-2035
  • Figure 76: Eastern Europe Market Attractiveness Analysis by End-Users
  • Figure 77: East Asia Market Value Share and BPS Analysis by Country, 2025 and 2035
  • Figure 78: East Asia Market Value Share and BPS Analysis by Product , 2025 and 2035
  • Figure 79: East Asia Market Y to o to Y Growth Comparison by Product , 2025-2035
  • Figure 80: East Asia Market Attractiveness Analysis by Product
  • Figure 81: East Asia Market Value Share and BPS Analysis by Technology, 2025 and 2035
  • Figure 82: East Asia Market Y to o to Y Growth Comparison by Technology, 2025-2035
  • Figure 83: East Asia Market Attractiveness Analysis by Technology
  • Figure 84: East Asia Market Value Share and BPS Analysis by Application, 2025 and 2035
  • Figure 85: East Asia Market Y to o to Y Growth Comparison by Application, 2025-2035
  • Figure 86: East Asia Market Attractiveness Analysis by Application
  • Figure 87: East Asia Market Value Share and BPS Analysis by End-Users, 2025 and 2035
  • Figure 88: East Asia Market Y to o to Y Growth Comparison by End-Users, 2025-2035
  • Figure 89: East Asia Market Attractiveness Analysis by End-Users
  • Figure 90: South Asia and Pacific Market Value Share and BPS Analysis by Country, 2025 and 2035
  • Figure 91: South Asia and Pacific Market Value Share and BPS Analysis by Product , 2025 and 2035
  • Figure 92: South Asia and Pacific Market Y to o to Y Growth Comparison by Product , 2025-2035
  • Figure 93: South Asia and Pacific Market Attractiveness Analysis by Product
  • Figure 94: South Asia and Pacific Market Value Share and BPS Analysis by Technology, 2025 and 2035
  • Figure 95: South Asia and Pacific Market Y to o to Y Growth Comparison by Technology, 2025-2035
  • Figure 96: South Asia and Pacific Market Attractiveness Analysis by Technology
  • Figure 97: South Asia and Pacific Market Value Share and BPS Analysis by Application, 2025 and 2035
  • Figure 98: South Asia and Pacific Market Y to o to Y Growth Comparison by Application, 2025-2035
  • Figure 99: South Asia and Pacific Market Attractiveness Analysis by Application
  • Figure 100: South Asia and Pacific Market Value Share and BPS Analysis by End-Users, 2025 and 2035
  • Figure 101: South Asia and Pacific Market Y to o to Y Growth Comparison by End-Users, 2025-2035
  • Figure 102: South Asia and Pacific Market Attractiveness Analysis by End-Users
  • Figure 103: Middle East & Africa Market Value Share and BPS Analysis by Country, 2025 and 2035
  • Figure 104: Middle East & Africa Market Value Share and BPS Analysis by Product , 2025 and 2035
  • Figure 105: Middle East & Africa Market Y to o to Y Growth Comparison by Product , 2025-2035
  • Figure 106: Middle East & Africa Market Attractiveness Analysis by Product
  • Figure 107: Middle East & Africa Market Value Share and BPS Analysis by Technology, 2025 and 2035
  • Figure 108: Middle East & Africa Market Y to o to Y Growth Comparison by Technology, 2025-2035
  • Figure 109: Middle East & Africa Market Attractiveness Analysis by Technology
  • Figure 110: Middle East & Africa Market Value Share and BPS Analysis by Application, 2025 and 2035
  • Figure 111: Middle East & Africa Market Y to o to Y Growth Comparison by Application, 2025-2035
  • Figure 112: Middle East & Africa Market Attractiveness Analysis by Application
  • Figure 113: Middle East & Africa Market Value Share and BPS Analysis by End-Users, 2025 and 2035
  • Figure 114: Middle East & Africa Market Y to o to Y Growth Comparison by End-Users, 2025-2035
  • Figure 115: Middle East & Africa Market Attractiveness Analysis by End-Users
  • Figure 116: Global Market - Tier Structure Analysis
  • Figure 117: Global Market - Company Share Analysis
Dashboard
Dashboard
Dashboard
Dashboard
Dashboard
Dashboard

Full Research Suite comprises of:

Market outlook & trends analysis

Market outlook & trends analysis

Interviews & case studies

Interviews & case studies

Strategic recommendations

Strategic recommendations

Vendor profiles & capabilities analysis

Vendor profiles & capabilities analysis

5-year forecasts

5-year forecasts

8 regions and 60+ country-level data splits

8 regions and 60+ country-level data splits

Market segment data splits

Market segment data splits

12 months of continuous data updates

12 months of continuous data updates

DELIVERED AS:

PDF EXCEL ONLINE

Full Research Suite


$5000

$7500

$10000

Buy Report Now
Similar Industry Reports

Similar Industry Reports

Vision Care Market
Vision Care Market

Vision Care Market Size and Share Forecast Outlook 2025 to 2035

Vision Guided Robots Market

Vision Guided Robots Market - Trends & Forecast 2025 to 2035

Vision Sensor Market

Vision Sensor Market by Type, Application, End user and Region through 2035

Revision Knee Replacement Market

Revision Knee Replacement Market Size and Share Forecast Outlook 2025 to 2035

PCB Vision Inspection Equipment for SMT Market

PCB Vision Inspection Equipment for SMT Market Size and Share Forecast Outlook 2025 to 2035

Television Broadcasting Services Market

Television Broadcasting Services Market Insights – Growth & Forecast 2023-2033

Television Services Market

Television Services Market

Smart Vision Sensors Market

Smart Vision Sensors Market Analysis - Size, Share, and Forecast Outlook 2025 to 2035

Night Vision Surveillance Cameras Market

Night Vision Surveillance Cameras Market Size and Share Forecast Outlook 2025 to 2035

Night Vision System Market

Night Vision System Market Growth - Trends & Forecast 2024 to 2034

Night Vision Device Market

Night Vision Device Market

Hybrid Vision Sensor Chips Market

Hybrid Vision Sensor Chips Market Size and Share Forecast Outlook 2025 to 2035

Capsule Vision Inspection Solution Market

Capsule Vision Inspection Solution Market Size and Share Forecast Outlook 2025 to 2035

Machine Vision Camera Market

Machine Vision Camera Market Size and Share Forecast Outlook 2025 to 2035

Machine Vision System And Services Market

Machine Vision System And Services Market Size and Share Forecast Outlook 2025 to 2035

Robotic Vision Market

Robotic Vision Market Size and Share Forecast Outlook 2025 to 2035

Machine Vision Market

Machine Vision Market Insights – Growth & Forecast 2024-2034

Digital Vision Lenses Market

Digital Vision Lenses Market

Computer Vision in Healthcare Market

Computer Vision in Healthcare Market Size and Share Forecast Outlook 2025 to 2035

Computer Vision Market

Computer Vision Market Insights – Trends & Forecast 2025 to 2035

Future Market Insights

Vision Screener Market

Chat With MaRIA

Chat With

MaRIA

Hi There, I am MaRIA, Your Market Research Intelligence Assistant. How may I help you?