Reports

- Global Locations -

Headquarters

Future Market Insights, Inc.

Christiana Corporate, 200
Continental Drive, Suite 401,
Newark, Delaware - 19713,
United States

T: +1-845-579-5705

Americas

Future Market Insights, Inc.

616 Corporate Way, Suite 2-9018,
Valley Cottage, NY 10989, United States

T: +1-347-918-3531

MEA

Future Market Insights

1602-6 Jumeirah Bay X2 Tower, Plot No: JLT-PH2-X2A,
Jumeirah Lakes Towers, Dubai,
United Arab Emirates

Europe

Future Market Insights

3rd Floor, 207 Regent Street,
W1B 3HH London
United Kingdom

T: + 44 (0) 20 8123 9659
D: +44 (0) 20 3287 4268

Asia Pacific

Future Market Insights

IndiaLand Global Tech Park, Unit UG-1, Behind Grand HighStreet, Phase 1, Hinjawadi, MH, Pune – 411057, India

Walk-in Coolers and Freezers Market Outlook (2022 to 2029)

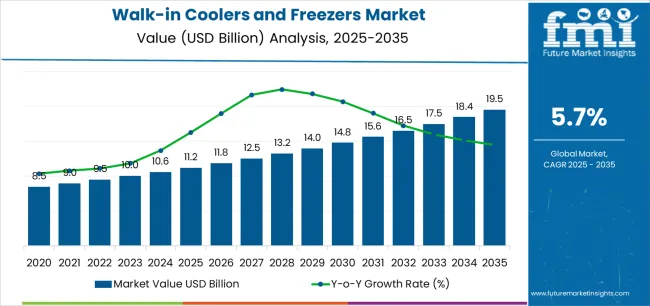
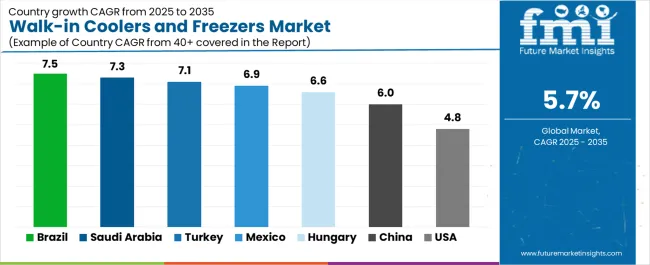
The global walk-in coolers and freezers market is estimated to be worth around US$ 9.52 Billion in 2022. With the rising trend of installing customized walk-in coolers and freezers, the overall market is projected to expand at a robust CAGR of 5.7% between 2022 and 2029, reaching a valuation of US$ 14.05 Billion by 2029.

Attribute Details
Walk-in Coolers and Freezers Market Estimated Size in 2022 US$ 9.52 Billion
Walk-in Coolers and Freezers Market Projected Size in 2029 US$ 14.05 Billion
Walk-in Coolers and Freezers Market Historical CAGR (2014 to 2021) 4.8%
Walk-in Coolers and Freezers Market Value-Based CAGR (2022 to 2029) 5.7%

Increasing penetration of walk-in coolers and freezers across developing regions is creating new growth avenues within the global walk-in coolers and freezers market. These refrigeration products are rising in popularity due to their larger capacity to store and preserve sensitive products as well as extend their shelf life.

Regionally, North America will continue to remain the most lucrative market for walk-in coolers and freezers, accounting for the largest share of 25.7% in 2022. Growth in the region is attributable to the rapidly expanding HoReCa sector, continuous advancements in refrigeration technology, and the presence of leading market players.

Don't pay for what you don't need

Customize your report by selecting specific countries or regions and save 30%!

How The Market Progressed Till June 2022?

Market Statistics Details
H1,2021 (A) 5.4%
H1,2022 Projected (P) 5.6%
H1,2022 Outlook (O) 5.1%
BPS Change : H1,2022 (O) - H1,2022 (P) (-) 46 ↓
BPS Change : H1,2022 (O) - H1,2021 (A) (-) 31 ↓

Future Market Insights represents a half-yearly comparison and insightful analysis of the Walk-in Coolers and Freezers market outlook. In a walk-in Cooler and Freezer, the compressor is used to compress the refrigerant, wherein it receives low-pressure gas from the evaporator and converts it into high-pressure gas.

Due to the high operational efficiency and continuous working of walk-in coolers and freezers, it often leads to the failure of the compressor. In application areas such as restaurants, commercial kitchens, supermarkets, and hypermarket stores, the continuous operation and frequent opening and closing of the coolers put a high load on the compressor.

The high compressor failure rate is expected to threaten market opportunities in certain highly efficient application ends.

The global sales for walk-in coolers and freezers witnessed a growth rate of 5.4% over the first half of 2021. Whereas it is estimated and will decline to 5.1% in 2022, due to the Governments taking initiatives to make stringent regulations for maintaining the desired standards of coolers and freezers, for maintenance of temperature, and control of GHG emissions from the freezers. Resultantly, the market is projected to lose negative 31 bps between 2021 and 2022.

Pharmaceuticals and healthcare industries have been witnessing steady growth over the last few years owing to the rising population and growing need for better healthcare faculties.

The increasing aging population is one of the prime factors contributing to the growing pharmaceutical industry while the healthcare industry growth can be attributed to growing government spending and per-capita expenditure. which are projected to drive the market forward in the approaching years.

Walk-in Coolers and Freezers Market

Walk-in coolers and freezers Market Outlook 2014 to 2021 Compared to 2022 to 2029 Forecast

The global walk-in coolers and freezers market is set to register a healthy CAGR of 5.7% between 2022 and 2029 in comparison to the 4.8% CAGR registered from 2014 to 2021.

Increasing demand for walk-in coolers and freezers across diverse applications such as retail food & beverage stores, pharmaceuticals, chemicals, cold storage warehouses, and hospitals is driving the global walk-in cooler and freezers market.

Walk-in coolers and freezers are standard modular cold storage spaces or room chambers with a walking space for cooling and freezing various products including food, beverages, meat, fruits and vegetables, pharmaceuticals, and chemicals. They have become indispensable parts of modern restaurants, hotels, research labs, supermarkets, and any other place that needs to store fresh, frozen, or pre-cooled products.

The rising adoption of walk-in coolers and freezers for preserving food and other temperature-sensitive products is boosting the growth of the market. It is being estimated that millions of tons of food get wasted globally due to a lack of proper cooling facilities.

During the last few decades, rapid technological advancements in refrigeration technology have paved way for the development of smart and energy-efficient walk-in coolers and freezers with eco-friendly features. The introduction of these innovative products with low global warming potential (GWP) is anticipated to facilitate the growth of walk-in coolers and freezers during the forecast period.

The rising trend of customized coolers and freezers is gaining traction. End-use customers prefer to install customized walk-in coolers and freezers as they provide flexibility and tailor-made options as per specific requirements. The rising inclination towards customized walk-in Coolers and Freezers by end-use industries is expected to help the market players to capitalize in the market.

Moreover, increasing demand from pharmaceutical and bakery segments is anticipated to support the growth of the walk-in coolers and freezers market during the forecast period.

Spurred by the aforementioned factors, the walk-in coolers and freezers market is set to expand 1.5X through 2029.

Nikhil Kaitwade
Nikhil Kaitwade

Principal Consultant

Talk to Analyst

Find your sweet spots for generating winning opportunities in this market.

Will Expansion of Food and Beverage Industry Fuel Demand for Industrial Walk In Coolers?

The rapid increase in food and beverage production, along with the expansion of cold chain capacities to ensure efficient storage and minimize wastage of food are primary factors driving resulting in the high adoption of industrial walk-in coolers and freezers.

With fast-changing lifestyles and rising disposable income, there has been a rapid shift from FSR (Full-Service Restaurants) to QSR (Quick Service Restaurants). This is positively impacting the growth of walk-in freezers.

Moreover, rising concerns pertaining to food insecurity issue has opened avenues for sales of walk-in coolers and freezers. Countries across the globe are strengthening their cold supply chain infrastructure to minimize the waste of food and beverages.

The rising number of retail industry sectors such as convenience stores, hypermarkets, and supermarkets across the globe is creating demand for better refrigeration solutions such as walk-in coolers and freezers and the trend is likely to continue in the future. These places require proper refrigeration facilities for preserving food products and extending their shelf life.

In addition to this, rising sales of frozen and processed food products through online sales will continue to boost the growth of walk-in coolers and freezers during the forecast period.

Country-wise Insights

Why is the USA Considered A Leading Walk-in Coolers and Freezers Market?

Rising Frozen Food Consumption Pushing Demand for Commercial Walk-in Freezers for Sale

As per FMI, the USA will remain the most lucrative market for indoor walk-in coolers and freezers and commercial grades alike. The presence of well-established retail sectors, the growing popularity of customized walk-in coolers and freezers, the rising construction of hotels, and the presence of leading market players will continue aiding sales in the USA

Rising disposable income and changing lifestyles across the country have triggered the sales of frozen and processed food products. A large population in the USA consumes frozen food products either at restaurants or in homes. According to the American Frozen Food Institute (AFFI), frozen food retail sales reached around US$ 65.1 billion in 2020, a 21% increase compared to the previous year. This is positively impacting the growth of the walk-in coolers and freezers market across the country.

A maximum number of restaurants and commercial kitchens in the USA have well-maintained commercial walk-in freezers and coolers to keep frozen and refrigerated products in optimal condition.

Moreover, the increasing adoption of portable walk-in coolers and freezers, besides the regular ones, in pharmaceutical and clinical research segments and the rising sales of food products through online platforms will support the growth of the USA market.

Based on the aforementioned factors, a healthy market share of 25.7% has been projected for the North American walk-in coolers and freezers market dominated by the USA in 2022.

How will Growth Unfold in China Market?

Modular Walk-in Coolers and Freezers Remain Highly Sought-after in China

China is one of the lucrative markets for walk-in coolers and freezers. Rapid urbanization coupled with the economic boom across China has created attractive prospects for commercial kitchens and restaurants. This is, in turn driving the modular walk-in coolers and freezers.

The emergence of China as a tech hub has had a profound impact on the sales of walk-in coolers and freezers. Leading players based in China are using modern technologies for developing innovative and eco-friendly products at affordable prices. This has helped in achieving higher sales of walk-in coolers.

Increasing the export of frozen products such as seafood also will continue driving sales of advanced walk-in freezers. According to a report published in the World’s Top Exports (WTEx), China remained the largest exporter of frozen fish, with total frozen whole fish export reaching around US$ 2.38 billion in 2020.

Furthermore, the expansion of retail industry sectors along with increasing consumer spending is anticipated to boost the growth of the walk-in coolers and freezers market in China during the forecast period.

A market share of 15.7% has been projected for the East Asia walk-in coolers and freezers market spearheaded by China in 2022.

Why is Demand for Walk-in Coolers and Freezers Rising in India?

Blooming Food and Beverage Industry Increasing Sales

As per FMI, the India walk-in coolers and freezers market is poised to exhibit strong growth during the forecast period from 2022 to 2029. Growth in the country is attributable to the rising sales of food products through omni-distribution channels and increasing adoption of indoor and outdoor walk-in coolers and freezers from various industries such as food & beverages, healthcare, and chemicals.

According to the Indian Brand Equity Foundation (IBEF), the food and beverages industry accounted for around 3% of India’s GDP in 2020. India is the second largest populated country in the world. To sustain such an enormous population, the preservation of food has become a necessity.

A large number of outdoor walk-in coolers and freezers are installed in various food outlets, storage facilities, and commercial kitchens.

With rising disposable income and rapid urbanization, there has been a significant rise in the frozen and processed food demand. This is creating lucrative growth opportunities for sales of walk-in coolers and freezers.

Based on the aforementioned factors, the South Asia walk-in coolers and freezers market led by India is set to account for a healthy share of 14.1% in 2022.

Get the data you need at a Fraction of the cost

Personalize your report by choosing insights you need
and save 40%!

Category-wise Insights

Which Product Type Dominates the Walk-in Coolers and Freezers Market?

Walk-in Freezers to Remain the Top Selling Products

On the basis of product type, the global walk-in coolers and freezers market is segmented into walk-in coolers, walk-in freezers,s and combo (freezer + cooler). Among these, walk-in freezers remain the top-selling product in the global walk-in coolers and freezers market.

Walk-in freezers are being increasingly employed across various end-use applications including restaurants, research laboratories, and retail sectors to protect sensitive products from bacterial growth and other environmental factors.

However, with the growing popularity of combo walk-in products, the combo segment is anticipated to witness substantial growth over the forecast period.

Why are Indoor Walk-in Coolers and Freezers More Popular than Outdoor Ones?

Ease of Accessibility Triggering the Sales of Indoor Walk-In Coolers and Freezers

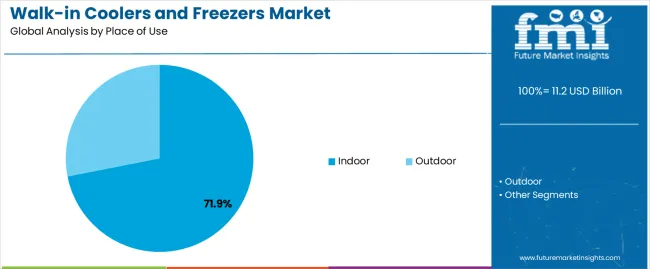
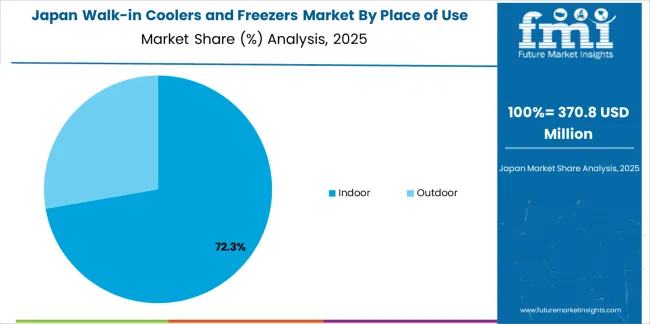
Based on the place of use, the walk-in coolers and freezers market is segmented into indoor and outdoor segments. Among these two, the indoor walk-in coolers and freezers segment is projected to maintain its lead in the global market during the forecast period.

Indoor walk-in coolers and freezers offer various features such as ease of accessibility and low cost which makes them ideal for adoption across various end-use applications. Moreover, they are easy to install and are more energy efficient as compared to its counterpart.

The rising adoption of indoor walk-in coolers and freezers for storing and extending the shelf life of perishable products due to their ease of accessibility will continue to boost the growth of the walk-in coolers and freezers market.

Which is the Preferred Technology in the Walk-in coolers and Freezers Market?

Convenience Offered by Self-Contained Walk-in Coolers and Freezers Spurring the Sales

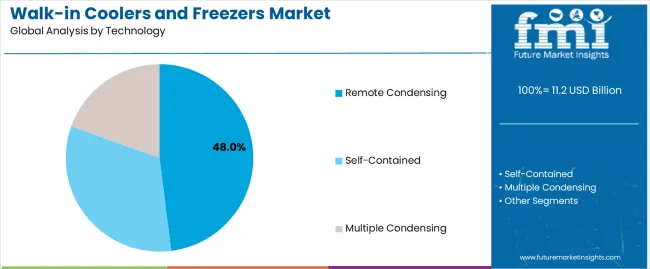
Based on technology, the walk-in coolers and freezers market is segmented into self-contained, remote condensing, and multiple condensing. Among these, the self-contained segment accounts for the majority of the share and is anticipated to continue its dominance during the forecast period.

Self-contained walk-in coolers and freezers offer various advantages such as being more convenient, easy to set up, portable, and incurring low maintenance and service costs. The rising adoption of self-contained walk-in coolers and freezers for storing food products for longer periods of time will continue to boost the growth of the walk-in coolers and freezers market during the forecast period.

Which is the Most Lucrative End-Use Application for Walk-in Coolers and Freezers?

Sales of walk-in Coolers and Freezers to Remain Mostly Concentrated in Commercial Kitchens & Restaurants

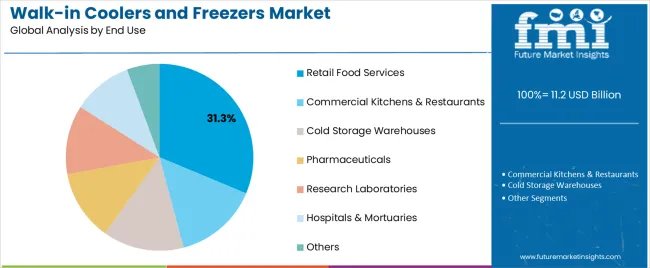
By application, the walk-in coolers and freezers market has been categorized into cold storage warehouses, breweries, commercial kitchens & restaurants, floral storage, pharmaceuticals, chemicals, research laboratories, hospitals & mortuaries, mobile refrigeration systems, retail food & beverage, and other stores.

The commercial kitchens and restaurants segment will continue to lead the global walk-in coolers and freezers market, accounting for the largest revenue share by 2029. Increasing adoption of walk-in coolers and freezers across commercial kitchens and restaurants is the major factor fueling sales in the global market.

Walk-in coolers and freezers play a crucial role in the bulk storage and display of food products in commercial kitchens and restaurants. They are used to freeze or cool down cooked or raw foodstuffs.

However, with the rapid expansion of retail industry sectors such as supermarkets, convenience stores, and hypermarkets, the retail food & beverages segment is anticipated to grow at a strong CAGR between 2022 and 2029.

Competitive Landscape

The walk-in coolers and freezers market is highly competitive with leading manufacturers constantly upgrading their product portfolio. They have adopted various organic and inorganic strategies such as mergers, partnerships, collaborations, new product launches, and acquisitions to dominate the market. For instance,

  • In January 2021, Emerson launched a New Platform of annual walk-in energy factor (AWEF), compliant condensing units for walk-In coolers to meet the DOE (Department of Energy) rule.
  • In May 2021, Arctic Industries, a leading walk-in cooler, and freezer manufacturer sponsored by Stoic Holdings, partnered with the Fischer Group.
  • In September 2018, Arctic Industries acquired Duracold Refrigeration Manufacturing Company, a Los Angeles-based walk-in cooler and freezer manufacturer. The acquisition will help the company to expand its geographic reach to the western USA

Scope of the Report

Attribute Details
 Historical Data Available for 2014 to 2021
Forecast Period 2022 to 2029
Market Analysis Units for Volume and US$ Million for Value
Key Regions Covered North America, Latin America, Europe, South Asia, East Asia, Oceania, and the Middle East & Africa
Key Countries Covered USA, Canada, Mexico, Brazil, Germany, United Kingdom, France, Italy, Spain, Russia, Poland, China, Japan, South Korea, India, ASEAN, Turkey, and South Africa
Key Segments Covered Product Type, Place of Use, Technology, Door Type, Application, Sales Channel, Mounting Type, and Region
Key Companies Profiled
  • SRC Refrigeration
  • Parker Hannifin Corp.
  • TMP Manufacturing Company
  • Panasonic Corporation
  • American Panel Corporation
  • Others
Report Coverage Market Forecast, Company Share Analysis, Competition Intelligence, Drivers, Restraints, Opportunities and Threats Analysis, Market Dynamics and Challenges, and Strategic Growth Initiatives
Customization & Pricing Available upon Request

Walk-in Coolers and Freezers Market by Category

Product Type:

  • Walk-in Cooler
  • Walk-in Freezer
  • Combo (Freezer + Cooler)

Place of Use:

  • Indoor
  • Outdoor

Technology:

  • Self-Contained
  • Remote Condensing
  • Multiplex Condensing

Door Type:

  • Hinged
  • Power Sliding
  • Manual Sliding

Application:

  • Cold Storage Warehouse
  • Breweries
  • Commercial Kitchen & Restaurants
  • Floral Storage
  • Pharmaceuticals
  • Chemicals
  • Research laboratories
  • Hospitals & Mortuaries
  • Mobile Refrigeration System
  • Retail Food & Beverage
    • Supermarket
    • Hypermarket
    • Convenience Stores
  • Other Stores

Sales Channel:

  • OEM
  • Aftermarket

Mounting Type:

  • Floor
  • Non-floor

Region:

  • North America
  • Europe
  • Latin America
  • South Asia
  • Oceania
  • East Asia
  • Middle East & Africa (MEA)

Frequently Asked Questions

What is the current walk-in coolers and freezers market valuation?

The walk-in coolers and freezers market is estimated to be worth around US$ 9.52 Billion in 2022.

What is the demand outlook for walk-in coolers and freezers market?

As per FMI, the walk-in coolers and freezers market is forecast to register a CAGR of 5.7% between 2022 and 2029

At what rate did the walk-in coolers and freezers market grow between 2014 and 2021?

The walk-in coolers and freezers market grew at a CAGR of 4.8% between 2014 and 2021.

What are the key trends shaping the walk-in coolers and freezers market?

Expansion of the food & beverage industry, growing export of food products, the introduction of eco-friendly products, and the rising need to preserve food from excessive wastage are some of the key trends shaping the growth of the walk-in coolers and freezers market.

What is the North America walk-in coolers and freezers market demand outlook?

The North American walk-in coolers and freezers market is estimated to account for over 25.7% share of the global walk-in coolers and freezers market in 2022.

Who are the leading players in walk-in coolers and freezers market?

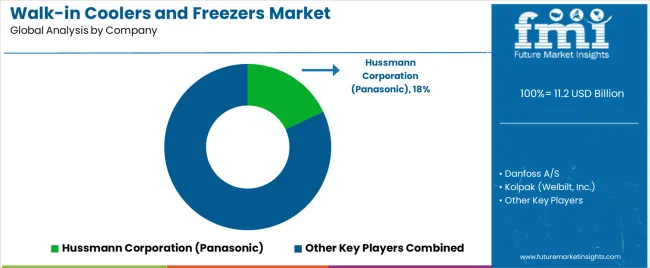
SRC Refrigeration, Parker Hannifin Corp., TMP Manufacturing Company, Panasonic Corporation, and American Panel Corporation are some of the leading players operating in the walk-in coolers and freezers market.

Table of Content

1. Executive Summary | Walk-in Coolers and Freezers Market

    1.1. Global Market Outlook

    1.2. Supply Side Trends

    1.3. Technology Roadmap Analysis

    1.4. Analysis and Recommendations

2. Market Overview

    2.1. Market Taxonomy

    2.2. Market Definition 

3. Key Market Trends

    3.1. Key Trends Impacting the Market

4. Key Success Factors

5. Global Market Volume (Units) Analysis

    5.1. Historical Market Volume Analysis

    5.2. Current and Future Market Volume Projections

    5.3. Y-o-Y Growth Trend Analysis

6. Pricing Analysis

    6.1. Global Average Pricing Analysis Benchmark 

7. Global Market Value (Market Size US$ Million) Analysis

    7.1. Historical Market Value (US$ Million) Analysis

    7.2. Current and Future Market Value (US$ Million) Projections

        7.2.1. Y-o-Y Growth Trend Analysis

        7.2.2. Absolute $ Opportunity Analysis

8. Market Background

    8.1. Macro-Economic Factors

    8.2. Forecast Factors - Relevance & Impact

    8.3. Value Chain

        8.3.1. Manufacturers

        8.3.2. Distributors

        8.3.3. End-users

    8.4. Market Dynamics

        8.4.1. Drivers

        8.4.2. Restraints

        8.4.3. Opportunity Analysis

        8.4.4. Trends

9. Global Market Analysis By Technology

    9.1. Introduction

        9.1.1. Market Value Share Analysis By Technology

        9.1.2. Y-o-Y Growth Analysis By Technology

    9.2. Historical Market Size and Volume Analysis By Technology, 2014 to 2021

    9.3. Market Size and Volume Forecast By Technology 2022 to 2029

        9.3.1. Self-contained

        9.3.2. Remote Condensing

        9.3.3. Multiplex Condensing 

    9.4. Market Attractiveness Analysis By Technology

10. Global Market Analysis By Place of Use

    10.1. Introduction

        10.1.1. Market Value Share Analysis By Place of Use

        10.1.2. Y-o-Y Growth Analysis By Place of Use

    10.2. Historical Market Size and Volume Analysis By Place of Use 2014 to 2021

    10.3. Market Size and Volume Forecast By Place of Use 2022 to 2029

        10.3.1. Indoor

        10.3.2. Outdoor

    10.4. Market Attractiveness Analysis By Place of Use

11. Global Market Analysis By Product Type

    11.1. Introduction

        11.1.1. Market Value Share Analysis By Product Type

        11.1.2. Y-o-Y Growth Analysis By Product Type

    11.2. Historical Market Size and Volume Analysis By Product Type,2014 to 2021

    11.3. Market Size and Volume Forecast By Product Type 2022 to 2029

        11.3.1. Walk-In Cooler

        11.3.2. Walk-In Freezer

    11.4. Market Attractiveness Analysis By Product Type

12. Global Market Analysis By Application

    12.1. Introduction

        12.1.1. Market Value Share Analysis By Application

        12.1.2. Y-o-Y Growth Analysis By Application

    12.2. Historical Market Size and Volume Analysis By Application 2014 to 2021

    12.3. Market Size and Volume Forecast By Application 2022 to 2029

        12.3.1. Cold Storage Warehouses

        12.3.2. Breweries

        12.3.3. Commercial Kitchen and Restaurants

        12.3.4. Floral Storage

        12.3.5. Retail Food & Beverage Sector

            12.3.5.1. Supermarket

            12.3.5.2. Hypermarket

            12.3.5.3. Convenience Stores

            12.3.5.4. Other Stores 

        12.3.6. Pharmaceuticals 

        12.3.7. Chemicals

        12.3.8. Research Laboratories

        12.3.9. Hospitals and Mortuaries

        12.3.10. Mobile Refrigeration System

    12.4. Market Attractiveness Analysis By Application

13. Global Market Analysis By Door Type

    13.1. Introduction

        13.1.1. Market Value Share Analysis By Door Type

        13.1.2. Y-o-Y Growth Analysis By Door Type

    13.2. Historical Market Size and Volume Analysis By Door Type 2014 to 2021

    13.3. Market Size and Volume Forecast By Door Type 2022 to 2029

        13.3.1. Hinged Door

        13.3.2. Power Sliding

    13.4. Market Attractiveness Analysis By Door Type

14. Global Market Analysis By Sales Channel

    14.1. Introduction

        14.1.1. Market Value Share Analysis By Sales Channel

        14.1.2. Y-o-Y Growth Analysis By Sales Channel

    14.2. Historical Market Size and Volume Analysis By Sales Channel 2014 to 2021

    14.3. Market Size and Volume Forecast By Sales Channel 2022 to 2029

        14.3.1. OEM

        14.3.2. Aftermarket

    14.4. Market Attractiveness Analysis By Sales Channel

15. Global Market Analysis By Mounting Type

    15.1. Introduction

        15.1.1. Market Value Share Analysis By Mounting Type

        15.1.2. Y-o-Y Growth Analysis By Mounting Type

    15.2. Historical Market Size and Volume Analysis By Mounting Type, 2014 to 2021

    15.3. Market Size and Volume Forecast By Mounting Type, 2022 to 2029

        15.3.1. Floor Based

        15.3.2. Non-floor Based

    15.4. Market Attractiveness Analysis By Mounting Type

16. Global Market Analysis By Region

    16.1. Introduction

        16.1.1. Market Value Share Analysis By Region

        16.1.2. Y-o-Y Growth Analysis By Region

    16.2. Historical Market Size and Volume Analysis By Region 2014 to 2021

    16.3. Market Size and Volume Forecast By Region 2022 to 2029

        16.3.1. North America

        16.3.2. Europe

        16.3.3. Middle East and Africa(MEA)

        16.3.4. East Asia

        16.3.5. South Asia 

        16.3.6. Oceania 

        16.3.7. Latin America

    16.4. Market Attractiveness Analysis By Region

17. North America Market Analysis

    17.1. Introduction

    17.2. Pricing Analysis

    17.3. Historical Market Size and Volume Analysis By Market Segments, 2014 to 2021

    17.4. Market Size and Volume Forecast By Market Segments, 2022 to 2029

        17.4.1. By Country

            17.4.1.1. USA

            17.4.1.2. Canada

        17.4.2. By Technology

        17.4.3. By Place of Use

        17.4.4. By Product Type

        17.4.5. By Application

        17.4.6. By Door Type

        17.4.7. By Sales Channel

        17.4.8. By Mounting Type

    17.5. Market Attractiveness Analysis

        17.5.1. By Country

        17.5.2. By Technology

        17.5.3. By Place of Use

        17.5.4. By Product Type

        17.5.5. By Application

        17.5.6. By Door Type

        17.5.7. By Sales Channel

        17.5.8. By Mounting Type

    17.6. Drivers and Restraints - Impact Analysis

18. Latin America Market Analysis

    18.1. Introduction

    18.2. Pricing Analysis

    18.3. Historical Market Size and Volume Analysis By Market Segments, 2014 to 2021

    18.4. Market Size and Volume Forecast By Market Segments, 2022 to 2029

        18.4.1. By Country

            18.4.1.1. Brazil

            18.4.1.2. Mexico

            18.4.1.3. Rest of Latin America

        18.4.2. By Technology

        18.4.3. By Place of Use

        18.4.4. By Product Type

        18.4.5. By Application

        18.4.6. By Door Type

        18.4.7. By Sales Channel

        18.4.8. By Mounting Type

    18.5. Market Attractiveness Analysis

        18.5.1. By Country

        18.5.2. By Technology

        18.5.3. By Place of Use

        18.5.4. By Product Type

        18.5.5. By Application

        18.5.6. By Door Type

        18.5.7. By Sales Channel

        18.5.8. By Mounting Type

    18.6. Drivers and Restraints - Impact Analysis

19. Europe Market Analysis

    19.1. Introduction

    19.2. Pricing Analysis

    19.3. Historical Market Size and Volume Analysis By Market Segments, 2014 to 2021

    19.4. Market Size and Volume Forecast By Market Segments, 2022 to 2029

        19.4.1. By Country

            19.4.1.1. Germany

            19.4.1.2. Italy

            19.4.1.3. France

            19.4.1.4. United Kingdom

            19.4.1.5. Spain

            19.4.1.6. BENELUX

            19.4.1.7. Nordic

            19.4.1.8. Russia

            19.4.1.9. Rest of Europe

        19.4.2. By Technology

        19.4.3. By Place of Use

        19.4.4. By Product Type

        19.4.5. By Application

        19.4.6. By Door Type

        19.4.7. By Sales Channel

        19.4.8. By Mounting Type

    19.5. Market Attractiveness Analysis

        19.5.1. By Country

        19.5.2. By Technology

        19.5.3. By Place of Use

        19.5.4. By Product Type

        19.5.5. By Application

        19.5.6. By Door Type

        19.5.7. By Sales Channel

        19.5.8. By Mounting Type

    19.6. Drivers and Restraints - Impact Analysis

20. South Asia Market Analysis

    20.1. Introduction

    20.2. Pricing Analysis

    20.3. Historical Market Size and Volume Analysis By Market Segments, 2014 to 2021

    20.4. Market Size and Volume Forecast By Market Segments, 2022 to 2029

        20.4.1. By Country 

            20.4.1.1. India

            20.4.1.2. Thailand

            20.4.1.3. Malaysia

            20.4.1.4. Philippines

            20.4.1.5. Rest of South Asia

        20.4.2. By Technology

        20.4.3. By Place of Use

        20.4.4. By Product Type

        20.4.5. By Application

        20.4.6. By Door Type

        20.4.7. By Sales Channel

        20.4.8. By Mounting Type

    20.5. Market Attractiveness Analysis

        20.5.1. By Country

        20.5.2. By Technology

        20.5.3. By Place of Use

        20.5.4. By Product Type

        20.5.5. By Application

        20.5.6. By Door Type

        20.5.7. By Sales Channel

        20.5.8. By Mounting Type

    20.6. Drivers and Restraints - Impact Analysis

21. East Asia Market Analysis

    21.1. Introduction

    21.2. Pricing Analysis

    21.3. Historical Market Size and Volume Analysis By Market Segments, 2014 to 2021

    21.4. Market Size and Volume Forecast By Market Segments, 2022 to 2029

        21.4.1. By Country

            21.4.1.1. China

            21.4.1.2. Japan

            21.4.1.3. South Korea

        21.4.2. By Technology

        21.4.3. By Place of Use

        21.4.4. By Product Type

        21.4.5. By Application

        21.4.6. By Door Type

        21.4.7. By Sales Channel

        21.4.8. By Mounting Type

    21.5. Market Attractiveness Analysis

        21.5.1. By Country

        21.5.2. By Technology

        21.5.3. By Place of Use

        21.5.4. By Product Type

        21.5.5. By Application

        21.5.6. By Door Type

        21.5.7. By Sales Channel

        21.5.8. By Mounting Type

    21.6. Drivers and Restraints - Impact Analysis

22. Oceania Market Analysis

    22.1. Introduction

    22.2. Pricing Analysis

    22.3. Historical Market Size and Volume Analysis By Market Segments, 2014 to 2021

    22.4. Market Size and Volume Forecast By Market Segments, 2022 to 2029

        22.4.1. By Country

            22.4.1.1. Australia

            22.4.1.2. New Zealand

        22.4.2. By Technology

        22.4.3. By Place of Use

        22.4.4. By Product Type

        22.4.5. By Application

        22.4.6. By Door Type

        22.4.7. By Sales Channel

        22.4.8. By Mounting Type

    22.5. Market Attractiveness Analysis

        22.5.1. By Country

        22.5.2. By Technology

        22.5.3. By Place of Use

        22.5.4. By Product Type

        22.5.5. By Application

        22.5.6. By Door Type

        22.5.7. By Sales Channel

        22.5.8. By Mounting Type

    22.6. Drivers and Restraints - Impact Analysis

23. Middle East and Africa (MEA) Market Analysis

    23.1. Introduction

    23.2. Pricing Analysis

    23.3. Historical Market Size and Volume Analysis By Market Segments, 2014 to 2021

    23.4. Market Size and Volume Forecast By Market Segments, 2022 to 2029

        23.4.1. By Country

            23.4.1.1. GCC Countries

            23.4.1.2. Turkey

            23.4.1.3. South Africa

            23.4.1.4. Rest of Middle East and Africa(MEA)

        23.4.2. By Technology

        23.4.3. By Place of Use

        23.4.4. By Product Type

        23.4.5. By Application

        23.4.6. By Door Type

        23.4.7. By Sales Channel

        23.4.8. By Mounting Type

    23.5. Market Attractiveness Analysis

        23.5.1. By Country

        23.5.2. By Technology

        23.5.3. By Place of Use

        23.5.4. By Product Type

        23.5.5. By Application

        23.5.6. By Door Type

        23.5.7. By Sales Channel

        23.5.8. By Mounting Type

    23.6. Drivers and Restraints - Impact Analysis

24. Emerging Countries Analysis

    24.1. Introduction

        24.1.1. Market Proportion Analysis 

        24.1.2. Global Vs. Country Growth Comparison

    24.2. China Market Analysis

        24.2.1. PEST Analysis

        24.2.2. Market Proportion Analysis By Market Taxonomy

        24.2.3. China Market Volume (Units) Analysis By Market Taxonomy

            24.2.3.1. By Technology

            24.2.3.2. By Place of Use

            24.2.3.3. By Product Type

            24.2.3.4. By Application

            24.2.3.5. By Door Type

            24.2.3.6. By Sales Channel

            24.2.3.7. By Mounting Type

        24.2.4. China Market Value (US$ Million) Analysis By Market Taxonomy

            24.2.4.1. By Technology

            24.2.4.2. By Place of Use

            24.2.4.3. By Product Type

            24.2.4.4. By Application

            24.2.4.5. By Door Type

            24.2.4.6. By Sales Channel

            24.2.4.7. By Mounting Type China 

    24.3. India Market Analysis

        24.3.1. PEST Analysis

        24.3.2. Market Proportion Analysis By Market Taxonomy

        24.3.3. India Market Volume (Units) Analysis By Market Taxonomy

            24.3.3.1. By Technology

            24.3.3.2. By Place of Use

            24.3.3.3. By Product Type

            24.3.3.4. By Application

            24.3.3.5. By Door Type

            24.3.3.6. By Sales Channel

            24.3.3.7. By Mounting Type 

        24.3.4. India Market Value (US$ Million) Analysis By Market Taxonomy

            24.3.4.1. By Technology

            24.3.4.2. By Place of Use

            24.3.4.3. By Product Type

            24.3.4.4. By Application

            24.3.4.5. By Door Type

            24.3.4.6. By Sales Channel

            24.3.4.7. By Mounting Type 

25. Market Structure Analysis

    25.1. Tier Structure Analysis

    25.2. Market Concentration

26. Competition Analysis

    26.1. Competition Dashboard

    26.2. Competition Deep Dive 

        26.2.1. Danfoss A/S

            26.2.1.1. Overview

            26.2.1.2. Product Portfolio

            26.2.1.3. Production Footprint

            26.2.1.4. Sales Footprint

            26.2.1.5. Strategy

                26.2.1.5.1. Marketing Strategy

                26.2.1.5.2. Product Strategy

                26.2.1.5.3. Channel Strategy

        26.2.2. Panasonic Corporation (Hussmann Corporation)

            26.2.2.1. Overview

            26.2.2.2. Product Portfolio

            26.2.2.3. Production Footprint

            26.2.2.4. Sales Footprint

            26.2.2.5. Strategy

                26.2.2.5.1. Marketing Strategy

                26.2.2.5.2. Product Strategy

                26.2.2.5.3. Channel Strategy

        26.2.3. Welbilt, Inc.

            26.2.3.1. Overview

            26.2.3.2. Product Portfolio

            26.2.3.3. Production Footprint

            26.2.3.4. Sales Footprint

            26.2.3.5. Strategy

                26.2.3.5.1. Marketing Strategy

                26.2.3.5.2. Product Strategy

                26.2.3.5.3. Channel Strategy

        26.2.4. Standex International Corporation

            26.2.4.1. Overview

            26.2.4.2. Product Portfolio

            26.2.4.3. Production Footprint

            26.2.4.4. Sales Footprint

            26.2.4.5. Strategy

                26.2.4.5.1. Marketing Strategy

                26.2.4.5.2. Product Strategy

                26.2.4.5.3. Channel Strategy

        26.2.5. Viessmann Refrigeration Systems Oy

            26.2.5.1. Overview

            26.2.5.2. Product Portfolio

            26.2.5.3. Production Footprint

            26.2.5.4. Sales Footprint

            26.2.5.5. Strategy

                26.2.5.5.1. Marketing Strategy

                26.2.5.5.2. Product Strategy

                26.2.5.5.3. Channel Strategy

        26.2.6. Bally Refrigerated Boxes, Inc.

            26.2.6.1. Overview

            26.2.6.2. Product Portfolio

            26.2.6.3. Production Footprint

            26.2.6.4. Sales Footprint

            26.2.6.5. Strategy

                26.2.6.5.1. Marketing Strategy

                26.2.6.5.2. Product Strategy

                26.2.6.5.3. Channel Strategy

        26.2.7. Amerikooler Llc

            26.2.7.1. Overview

            26.2.7.2. Product Portfolio

            26.2.7.3. Production Footprint

            26.2.7.4. Sales Footprint

            26.2.7.5. Strategy

                26.2.7.5.1. Marketing Strategy

                26.2.7.5.2. Product Strategy

                26.2.7.5.3. Channel Strategy

        26.2.8. Systemes Norbec Inc.

            26.2.8.1. Overview

            26.2.8.2. Product Portfolio

            26.2.8.3. Production Footprint

            26.2.8.4. Sales Footprint

            26.2.8.5. Strategy

                26.2.8.5.1. Marketing Strategy

                26.2.8.5.2. Product Strategy

                26.2.8.5.3. Channel Strategy

        26.2.9. American Panel Corporation

            26.2.9.1. Overview

            26.2.9.2. Product Portfolio

            26.2.9.3. Production Footprint

            26.2.9.4. Sales Footprint

            26.2.9.5. Strategy

                26.2.9.5.1. Marketing Strategy

                26.2.9.5.2. Product Strategy

                26.2.9.5.3. Channel Strategy

        26.2.10. Huurre Finland Oy

            26.2.10.1. Overview

            26.2.10.2. Product Portfolio

            26.2.10.3. Production Footprint

            26.2.10.4. Sales Footprint

            26.2.10.5. Strategy

                26.2.10.5.1. Marketing Strategy

                26.2.10.5.2. Product Strategy

                26.2.10.5.3. Channel Strategy

        26.2.11. Arctic Industries Inc. 

            26.2.11.1. Overview

            26.2.11.2. Product Portfolio

            26.2.11.3. Production Footprint

            26.2.11.4. Sales Footprint

            26.2.11.5. Strategy

                26.2.11.5.1. Marketing Strategy

                26.2.11.5.2. Product Strategy

                26.2.11.5.3. Channel Strategy

        26.2.12. Tmp Manufacturing Company Inc.

            26.2.12.1. Overview

            26.2.12.2. Product Portfolio

            26.2.12.3. Production Footprint

            26.2.12.4. Sales Footprint

            26.2.12.5. Strategy

                26.2.12.5.1. Marketing Strategy

                26.2.12.5.2. Product Strategy

                26.2.12.5.3. Channel Strategy

        26.2.13. Refrigerator Manufacturers Llc

            26.2.13.1. Overview

            26.2.13.2. Product Portfolio

            26.2.13.3. Production Footprint

            26.2.13.4. Sales Footprint

            26.2.13.5. Strategy

                26.2.13.5.1. Marketing Strategy

                26.2.13.5.2. Product Strategy

                26.2.13.5.3. Channel Strategy

        26.2.14. Foster Refrigerators Enterprise, Inc. 

            26.2.14.1. Overview

            26.2.14.2. Product Portfolio

            26.2.14.3. Production Footprint

            26.2.14.4. Sales Footprint

            26.2.14.5. Strategy

                26.2.14.5.1. Marketing Strategy

                26.2.14.5.2. Product Strategy

                26.2.14.5.3. Channel Strategy

        26.2.15. ABN Refrigeration Manufacturing

            26.2.15.1. Overview

            26.2.15.2. Product Portfolio

            26.2.15.3. Production Footprint

            26.2.15.4. Sales Footprint

            26.2.15.5. Strategy

                26.2.15.5.1. Marketing Strategy

                26.2.15.5.2. Product Strategy

                26.2.15.5.3. Channel Strategy

        26.2.16. Industrial Refrigeration Private Limited

            26.2.16.1. Overview

            26.2.16.2. Product Portfolio

            26.2.16.3. Production Footprint

            26.2.16.4. Sales Footprint

            26.2.16.5. Strategy

                26.2.16.5.1. Marketing Strategy

                26.2.16.5.2. Product Strategy

                26.2.16.5.3. Channel Strategy

        26.2.17. U.S. Cooler

            26.2.17.1. Overview

            26.2.17.2. Product Portfolio

            26.2.17.3. Production Footprint

            26.2.17.4. Sales Footprint

            26.2.17.5. Strategy

                26.2.17.5.1. Marketing Strategy

                26.2.17.5.2. Product Strategy

                26.2.17.5.3. Channel Strategy

        26.2.18. SRC Refrigeration

            26.2.18.1. Overview

            26.2.18.2. Product Portfolio

            26.2.18.3. Production Footprint

            26.2.18.4. Sales Footprint

            26.2.18.5. Strategy

                26.2.18.5.1. Marketing Strategy

                26.2.18.5.2. Product Strategy

                26.2.18.5.3. Channel Strategy

        26.2.19. Thermo-Kool / Mid-South Industries, Inc.

            26.2.19.1. Overview

            26.2.19.2. Product Portfolio

            26.2.19.3. Production Footprint

            26.2.19.4. Sales Footprint

            26.2.19.5. Strategy

                26.2.19.5.1. Marketing Strategy

                26.2.19.5.2. Product Strategy

                26.2.19.5.3. Channel Strategy

        26.2.20. Commercial Cooling - Par Engineering, Inc

            26.2.20.1. Overview

            26.2.20.2. Product Portfolio

            26.2.20.3. Production Footprint

            26.2.20.4. Sales Footprint

            26.2.20.5. Strategy

                26.2.20.5.1. Marketing Strategy

                26.2.20.5.2. Product Strategy

                26.2.20.5.3. Channel Strategy

27. Research Methodology

28. Assumption & Acronyms

Don't pay for what you don't need

Customize your report by selecting specific countries or regions and save 30%!

List of Tables

Table 01: Global Market Value (US$ Million) and Volume (Units) Historical Data 2014 to 2021 and Forecast 2022 to 2029 by Technology

Table 02: Global Market Value (US$ Million) and Volume (Units) Historical Data 2014 to 2021 and Forecast 2022 to 2029 by Place of Use

Table 03: Global Market Value (US$ Million) and Volume (Units) Historical Data 2014 to 2021 and Forecast 2022 to 2029 by Product Type

Table 04: Global Market Value (US$ Million) and Volume (Units) Historical Data 2014 to 2021 and Forecast 2022 to 2029 by Door Type

Table 05: Global Market Volume (Units) Historical Data 2014 to 2021 and Forecast 2022 to 2029 by Application

Table 06: Global Market Value (US$ Million) Historical Data 2014 to 2021 and Forecast 2022 to 2029 by Application

Table 07: Global Market Value (US$ Million) and Volume (Units) Historical Data 2014 to 2021 and Forecast 2022 to 2029 by Sales Channel

Table 08: Global Market Value (US$ Million) and Volume (Units) Historical Data 2014 to 2021 and Forecast 2022 to 2029 by Mounting Type

Table 09: Global Market Size (US$ Million) and Volume (Units) Forecast by Region, 2014 to 2028

Table 10: North America Market Volume (Units) and Value (US$ Million) Forecast by Country, 2014 to 2029

Table 11: North America Market Value (US$ Million) and Volume (Units) Historical Data 2014 to 2021 and Forecast 2022 to 2029 by Technology

Table 12: North America Market Value (US$ Million) and Volume (Units) Historical Data 2014 to 2021 and Forecast 2022 to 2029 by Place of Use

Table 13: North America Market Value (US$ Million) and Volume (Units) Historical Data 2014 to 2021 and Forecast 2022 to 2029 by Product Type

Table 14: North America Market Volume (Units) Historical Data 2014 to 2021 and Forecast 2022 to 2029 by Application

Table 15: North America Market Value (US$ Million) Historical Data 2014 to 2021 and Forecast 2022 to 2029 by Application

Table 16: North America Market Value (US$ Million) and Volume (Units) Historical Data 2014 to 2021 and Forecast 2022 to 2029 by Door Type

Table 17: North America Market Value (US$ Million) and Volume (Units) Historical Data 2014 to 2021 and Forecast 2022 to 2029 by Sales Channel

Table 18: North America Market Value (US$ Million) and Volume (Units) Historical Data 2014 to 2021 and Forecast 2022 to 2029 by Mounting Type

Table 19: Latin America Market Volume (Units) and Value (US$ Million) Forecast by Country, 2014 to 2029

Table 20: Latin America Market Value (US$ Million) and Volume (Units) Historical Data 2014 to 2021 and Forecast 2022 to 2029 by Technology

Table 21: Latin America Market Value (US$ Million) and Volume (Units) Historical Data 2014 to 2021 and Forecast 2022 to 2029 by Place of Use

Table 22: Latin America Market Value (US$ Million) and Volume (Units) Historical Data 2014 to 2021 and Forecast 2022 to 2029 by Product Type

Table 23: Latin America Market Volume (Units) Historical Data 2014 to 2021 and Forecast 2022 to 2029 by Application

Table 24: Latin America Market Value (US$ Million) Historical Data 2014 to 2021 and Forecast 2022 to 2029 by Application

Table 25: Latin America Market Value (US$ Million) and Volume (Units) Historical Data 2014 to 2021 and Forecast 2022 to 2029 by Door Type

Table 26: Latin America Market Value (US$ Million) and Volume (Units) Historical Data 2014 to 2021 and Forecast 2022 to 2029 by Sales Channel

Table 27: Latin America Market Value (US$ Million) and Volume (Units) Historical Data 2014 to 2021 and Forecast 2022 to 2029 by Mounting Type

Table 28: Europe Market Volume (Units) and Value (US$ Million) Forecast by Country, 2014 to 2029

Table 29: Europe Market Value (US$ Million) and Volume (Units) Historical Data 2014 to 2021 and Forecast 2022 to 2029 by Technology

Table 30: Europe Market Value (US$ Million) and Volume (Units) Historical Data 2014 to 2021 and Forecast 2022 to 2029 by Place of Use

Table 31: Europe Market Value (US$ Million) and Volume (Units) Historical Data 2014 to 2021 and Forecast 2022 to 2029 by Product Type

Table 32: Europe Market Volume (Units) Historical Data 2014 to 2021 and Forecast 2022 to 2029 by Application

Table 33: Europe Market Value (US$ Million) Historical Data 2014 to 2021 and Forecast 2022 to 2029 by Application

Table 34: Europe Market Value (US$ Million) and Volume (Units) Historical Data 2014 to 2021 and Forecast 2022 to 2029 by Door Type

Table 35: Europe Market Value (US$ Million) and Volume (Units) Historical Data 2014 to 2021 and Forecast 2022 to 2029 by Sales Channel

Table 36: Europe Market Value (US$ Million) and Volume (Units) Historical Data 2014 to 2021 and Forecast 2022 to 2029 by Mounting Type

Table 37: South Asia Market Volume (Units) and Value (US$ Million) Forecast by Country, 2014 to 2029

Table 38: South Asia Market Value (US$ Million) and Volume (Units) Historical Data 2014 to 2021 and Forecast 2022 to 2029 by Technology

Table 39: South Asia Market Value (US$ Million) and Volume (Units) Historical Data 2014 to 2021 and Forecast 2022 to 2029 by Place of Use

Table 40: South Asia Market Value (US$ Million) and Volume (Units) Historical Data 2014 to 2021 and Forecast 2022 to 2029 by Product Type

Table 41: South Asia Market Volume (Units) Historical Data 2014 to 2021 and Forecast 2022 to 2029 by Application

Table 42: South Asia Market Value (US$ Million) Historical Data 2014 to 2021 and Forecast 2022 to 2029 by Application

Table 43: South Asia Market Value (US$ Million) and Volume (Units) Historical Data 2014 to 2021 and Forecast 2022 to 2029 by Door Type

Table 44: South Asia Market Value (US$ Million) and Volume (Units) Historical Data 2014 to 2021 and Forecast 2022 to 2029 by Sales Channel

Table 45: South Asia Market Value (US$ Million) and Volume (Units) Historical Data 2014 to 2021 and Forecast 2022 to 2029 by Mounting Type

Table 46: East Asia Market Volume (Units) and Value (US$ Million) Forecast by Country, 2014 to 2029

Table 47: East Asia Market Value (US$ Million) and Volume (Units) Historical Data 2014 to 2021 and Forecast 2022 to 2029 by Technology

Table 48: East Asia Market Value (US$ Million) and Volume (Units) Historical Data 2014 to 2021 and Forecast 2022 to 2029 by Place of Use

Table 49: East Asia Market Value (US$ Million) and Volume (Units) Historical Data 2014 to 2021 and Forecast 2022 to 2029 by Product Type

Table 50: East Asia Market Volume (Units) Historical Data 2014 to 2021 and Forecast 2022 to 2029 by Application

Table 51: East Asia Market Value (US$ Million) Historical Data 2014 to 2021 and Forecast 2022 to 2029 by Application

Table 52: East Asia Market Value (US$ Million) and Volume (Units) Historical Data 2014 to 2021 and Forecast 2022 to 2029 by Door Type

Table 53: East Asia Market Value (US$ Million) and Volume (Units) Historical Data 2014 to 2021 and Forecast 2022 to 2029 by Sales Channel

Table 54: East Asia Market Value (US$ Million) and Volume (Units) Historical Data 2014 to 2021 and Forecast 2022 to 2029 by Mounting Type

Table 55: Oceania Market Volume (Units) and Value (US$ Million) Forecast by Country, 2014 to 2029

Table 56: Oceania Market Value (US$ Million) and Volume (Units) Historical Data 2014 to 2021 and Forecast 2022 to 2029 by Technology

Table 57: Oceania Market Value (US$ Million) and Volume (Units) Historical Data 2014 to 2021 and Forecast 2022 to 2029 by Place of Use

Table 58: Oceania Market Value (US$ Million) and Volume (Units) Historical Data 2014 to 2021 and Forecast 2022 to 2029 by Product Type

Table 59: Oceania Market Value (US$ Million) Historical Data 2014 to 2021 and Forecast 2022 to 2029 by Application

Table 60: Oceania Market Volume (Units) Historical Data 2014 to 2021 and Forecast 2022 to 2029 by Application

Table 61: Oceania Market Value (US$ Million) and Volume (Units) Historical Data 2014 to 2021 and Forecast 2022 to 2029 by Door Type

Table 62: Oceania Market Value (US$ Million) and Volume (Units) Historical Data 2014 to 2021 and Forecast 2022 to 2029 by Sales Channel

Table 63: Oceania Market Value (US$ Million) and Volume (Units) Historical Data 2014 to 2021 and Forecast 2022 to 2029 by Mounting Type

Table 64: Middle East & Africa Market Volume (Units) and Value (US$ Million) Forecast by Country, 2014 to 2029

Table 65: Middle East & Africa Market Value (US$ Million) and Volume (Units) Historical Data 2014 to 2021 and Forecast 2022 to 2029 by Technology

Table 66: Middle East & Africa Market Value (US$ Million) and Volume (Units) Historical Data 2014 to 2021 and Forecast 2022 to 2029 by Place of Use

Table 67: Middle East & Africa Market Value (US$ Million) and Volume (Units) Historical Data 2014 to 2021 and Forecast 2022 to 2029 by Product Type

Table 68: Middle East & Africa Market Volume (Units) Historical Data 2014 to 2021 and Forecast 2022 to 2029 by Application

Table 69: Middle East & Africa Market Value (US$ Million) Historical Data 2014 to 2021 and Forecast 2022 to 2029 by Application

Table 70: Middle East & Africa Market Value (US$ Million) and Volume (Units) Historical Data 2014 to 2021 and Forecast 2022 to 2029 by Door Type

Table 71: Middle East & Africa Market Value (US$ Million) and Volume (Units) Historical Data 2014 to 2021 and Forecast 2022 to 2029 by Sales Channel

Table 72: Middle East & Africa Market Value (US$ Million) and Volume (Units) Historical Data 2014 to 2021 and Forecast 2022 to 2029 by Mounting Type

Table 73: China Market Value (US$ Million) and Volume (Units) Historical Data 2014 to 2021 and Forecast 2022 to 2029 by Technology

Table 74: China Market Value (US$ Million) and Volume (Units) Historical Data 2014 to 2021 and Forecast 2022 to 2029 by Place of Use

Table 75: China Market Value (US$ Million) and Volume (Units) Historical Data 2014 to 2021 and Forecast 2022 to 2029 by Product Type

Table 76: China Market Volume (Units) Historical Data 2014 to 2021 and Forecast 2022 to 2029 by Application

Table 77: China Market Value (US$ Million) Historical Data 2014 to 2021 and Forecast 2022 to 2029 by Application

Table 78: China Market Value (US$ Million) and Volume (Units) Historical Data 2014 to 2021 and Forecast 2022 to 2029 by Door Type

Table 79: China Market Value (US$ Million) and Volume (Units) Historical Data 2014 to 2021 and Forecast 2022 to 2029 by Sales Channel

Table 80: China Market Value (US$ Million) and Volume (Units) Historical Data 2014 to 2021 and Forecast 2022 to 2029 by Mounting Type

Table 81: India Market Value (US$ Million) and Volume (Units) Historical Data 2014 to 2021 and Forecast 2022 to 2029 by Technology

Table 82: India Market Value (US$ Million) and Volume (Units) Historical Data 2014 to 2021 and Forecast 2022 to 2029 by Place of Use

Table 83: India Market Value (US$ Million) and Volume (Units) Historical Data 2014 to 2021 and Forecast 2022 to 2029 by Product Type

Table 84: India Market Volume (Units) Historical Data 2014 to 2021 and Forecast 2022 to 2029 by Application

Table 85: India Market Value (US$ Million) Historical Data 2014 to 2021 and Forecast 2022 to 2029 by Application

Table 86: India Market Value (US$ Million) and Volume (Units) Historical Data 2014 to 2021 and Forecast 2022 to 2029 by Door Type

Table 87: India Market Value (US$ Million) and Volume (Units) Historical Data 2014 to 2021 and Forecast 2022 to 2029 by Sales Channel

Table 88: India Market Value (US$ Million) and Volume (Units) Historical Data 2014 to 2021 and Forecast 2022 to 2029 by Mounting Type
Nikhil Kaitwade
Nikhil Kaitwade

Principal Consultant

Talk to Analyst

Find your sweet spots for generating winning opportunities in this market.

List of Charts

Figure 01: Global Market Historical Volume (Units), 2014 to 2021

Figure 02: Global Market Forecasted Volume (units), 2021 to 2029

Figure 03: Global Market Pricing Analysis (By Product Type Segment, USD per Unit, 2021)

Figure 04: Global Market Price Deviation by Product Type Segment, 2021

Figure 05: Global Market Historical Value (US$ Million), 2014 to 2021

Figure 06: Global Market Value (US$ Million) Forecast & Y-o-Y Growth (%), 2022 to 2029

Figure 07: Global Market Absolute $ Opportunity, 2014 to 2029

Figure 08: Global Market Share and BPS Analysis by Technology– 2022 & 2029

Figure 09: Global Market Y-o-Y Growth Projections by Technology, 2021 to 2029

Figure 10: Global Market Attractiveness by Technology, 2022 to 2029

Figure 11: Global Market Absolute $ Opportunity by Self-contained Segment

Figure 12: Global Market Absolute $ Opportunity by Remote Condensing Segment

Figure 13: Global Market Absolute $ Opportunity by Multiplex Condensing  Segment

Figure 14: Global Market Share and BPS Analysis by Place of Use– 2022 & 2029

Figure 15: Global Market Y-o-Y Growth Projections by Place of Use, 2021 to 2029

Figure 16: Global Market Attractiveness by Place of Use, 2022 to 2029

Figure 17: Global Market Absolute $ Opportunity by Indoor Segment

Figure 18: Global Market Absolute $ Opportunity by Outdoor Segment

Figure 19: Global Market Share and BPS Analysis by Product Type– 2022 & 2029

Figure 20: Global Market Y-o-Y Growth Projections by Product Type, 2021 to 2029

Figure 21: Global Market Attractiveness by Product Type, 2022 to 2029

Figure 22: Global Market Absolute $ Opportunity by Walk-In Cooler Segment

Figure 23: Global Market Absolute $ Opportunity by Walk-In Freezer Segment

Figure 24: Global Market Absolute $ Opportunity by Combo (Freezer + Cooler) Segment

Figure 25: Global Market Share and BPS Analysis by Door Type– 2022 & 2029

Figure 26: Global Market Y-o-Y Growth Projections by Door Type, 2021 to 2029

Figure 27: Global Market Attractiveness by Door Type, 2022 to 2029

Figure 28: Global Market Absolute $ Opportunity by Hinged Door Segment

Figure 29: Global Market Absolute $ Opportunity by Power Sliding (Electric-Based) Segment

Figure 30: Global Market Absolute $ Opportunity by Manual Sliding Segment

Figure 31: Global Market Share and BPS Analysis by Application– 2022 & 2029

Figure 32: Global Market Y-o-Y Growth Projections by Application, 2021 to 2029

Figure 33: Global Market Attractiveness by Application, 2022 to 2029

Figure 34: Global Market Absolute $ Opportunity by Cold Storage Warehouses Segment

Figure 35: Global Market Absolute $ Opportunity by Breweries Segment

Figure 36: Global Market Absolute $ Opportunity by Commercial Kitchen and Restaurants Segment

Figure 37: Global Market Absolute $ Opportunity by Floral Storage Segment

Figure 38: Global Market Absolute $ Opportunity by Retail Food & Beverage Sector Segment

Figure 39: Global Market Absolute $ Opportunity by Pharmaceuticals Segment

Figure 40: Global Market Absolute $ Opportunity by Chemicals Segment

Figure 41: Global Market Absolute $ Opportunity by Research Laboratories Segment

Figure 42: Global Market Absolute $ Opportunity by Hospitals and Mortuaries Segment

Figure 43: Global Market Absolute $ Opportunity by Mobile Refrigeration System Segment

Figure 44: Global Market Share and BPS Analysis by Sales Channel– 2022 & 2029

Figure 45: Global Market Y-o-Y Growth Projections by Sales Channel, 2021 to 2029

Figure 46: Global Market Attractiveness by Sales Channel, 2022 to 2029

Figure 47: Global Market Absolute $ Opportunity by OEM Segment

Figure 48: Global Market Absolute $ Opportunity by Aftermarket Segment

Figure 49: Global Market Share and BPS Analysis by Mounting Type– 2022 & 2029

Figure 50: Global Market Y-o-Y Growth Projections by Mounting Type, 2021 to 2029

Figure 51: Global Market Attractiveness by Mounting Type, 2022 to 2029

Figure 52: Global Market Absolute $ Opportunity by Floor-Based Segment

Figure 53: Global Market Absolute $ Opportunity by Non-floor Based Segment

Figure 54: Global Market Share and BPS Analysis by Region

Figure 55: Global Market Y-o-Y Growth Projections by Region, 2021 – 2029

Figure 56: Global Market Attractiveness Analysis by Region, 2022 to 2029

Figure 57: Global Market Absolute $ Opportunity by North America, 2014 to 2022 and 2029

Figure 58: Global Market Absolute $ Opportunity by Latin America, 2014 to 2022 and 2029

Figure 59: Global Market Absolute $ Opportunity by Europe, 2014 to 2022 and 2029

Figure 60: Global Market Absolute $ Opportunity by East Asia a, 2014 to 2022 and 2029

Figure 61: Global Market Absolute $ Opportunity by South Asia, 2014 to 2022 and 2029

Figure 62: Global Market Absolute $ Opportunity by Oceania, 2014 to 2022 and 2029

Figure 63: Global Market Absolute $ Opportunity by Middle East & Africa, 2014 to 2022 and 2029

Figure 64: North America Market Share and BPS Analysis by Country – 2022 & 2029

Figure 65: North America Market, Y-o-Y Growth Projections by Country, 2022 to 2029

Figure 66: North America Market Attractiveness Analysis by Country, 2022 to 2029

Figure 67: North America Absolute $ Opportunity (US$ Million) by U.S. Segment, 2014 to 2029

Figure 68: North America Absolute $ Opportunity (US$ Million) by Canada Segment, 2014 to 2029

Figure 69: North America Market Share and BPS Analysis by Technology– 2022 & 2029

Figure 70: North America Market Y-o-Y Growth Projections by Technology, 2021 to 2029

Figure 71: North America Market Attractiveness by Technology, 2022 to 2029

Figure 72: North America Market Share and BPS Analysis by Place of Use– 2022 & 2029

Figure 73: North America Market Y-o-Y Growth Projections by Place of Use, 2021 to 2029

Figure 74: North America Market Attractiveness by Place of Use, 2022 to 2029

Figure 75: North America Market Share and BPS Analysis by Product Type– 2022 & 2029

Figure 76: North America Market Y-o-Y Growth Projections by Product Type, 2021 to 2029

Figure 77: North America Market Attractiveness by Product Type, 2022 to 2029

Figure 78: North America Market Share and BPS Analysis by Application– 2022 & 2029

Figure 79: North America Market Y-o-Y Growth Projections by Application, 2021 to 2029

Figure 80: North America Market Attractiveness by Application, 2022 to 2029

Figure 81: North America Market Share and BPS Analysis by Door Type– 2022 & 2029

Figure 82: North America Market Y-o-Y Growth Projections by Door Type, 2021 to 2029

Figure 83: North America Market Attractiveness by Door Type, 2022 to 2029

Figure 84: North America Market Share and BPS Analysis by Sales Channel– 2022 & 2029

Figure 85: North America Market Y-o-Y Growth Projections by Sales Channel, 2021 to 2029

Figure 86: North America Market Attractiveness by Sales Channel, 2022 to 2029

Figure 87: North America Market Share and BPS Analysis by Mounting Type– 2022 & 2029

Figure 88: North America Market Y-o-Y Growth Projections by Mounting Type, 2021 to 2029

Figure 89: North America Market Attractiveness by Mounting Type, 2022 to 2029

Figure 90: Latin America Market Share and BPS Analysis by Country – 2022 & 2029

Figure 91: Latin America Market, Y-o-Y Growth Projections by Country, 2022 to 2029

Figure 92: Latin America Market Attractiveness Analysis by Country, 2022 to 2029

Figure 93: Latin America Absolute $ Opportunity (US$ Million) by Brazil Segment, 2014 to 2029

Figure 94: Latin America Absolute $ Opportunity (US$ Million) by Mexico Segment, 2014 to 2029

Figure 95: Latin America Absolute $ Opportunity (US$ Million) by Rest of Latin America Segment, 2014 to 2029

Figure 96: Latin America Market Share and BPS Analysis by Technology– 2022 & 2029

Figure 97: Latin America Market Y-o-Y Growth Projections by Technology, 2021 to 2029

Figure 98: Latin America Market Attractiveness by Technology, 2022 to 2029

Figure 99: Latin America Market Share and BPS Analysis by Place of Use– 2022 & 2029

Figure 100: Latin America Market Y-o-Y Growth Projections by Place of Use, 2021 to 2029

Figure 101: Latin America Market Attractiveness by Place of Use, 2022 to 2029

Figure 102: Latin America Market Share and BPS Analysis by Product Type– 2022 & 2029

Figure 103: Latin America Market Y-o-Y Growth Projections by Product Type, 2021 to 2029

Figure 104: Latin America Market Attractiveness by Product Type, 2022 to 2029

Figure 105: Latin America Market Share and BPS Analysis by Application– 2022 & 2029

Figure 106: Latin America Market Y-o-Y Growth Projections by Application, 2021 to 2029

Figure 107: Latin America Market Attractiveness by Application, 2022 to 2029

Figure 108: Latin America Market Share and BPS Analysis by Door Type– 2022 & 2029

Figure 109: Latin America Market Y-o-Y Growth Projections by Door Type, 2021 to 2029

Figure 110: Latin America Market Attractiveness by Door Type, 2022 to 2029

Figure 111: Latin America Market Share and BPS Analysis by Sales Channel– 2022 & 2029

Figure 112: Latin America Market Y-o-Y Growth Projections by Sales Channel, 2021 to 2029

Figure 113: Latin America Market Attractiveness by Sales Channel, 2022 to 2029

Figure 114: Latin America Market Share and BPS Analysis by Mounting Type– 2022 & 2029

Figure 115: Latin America Market Y-o-Y Growth Projections by Mounting Type, 2021 to 2029

Figure 116: Latin America Market Attractiveness by Mounting Type, 2022 to 2029

Figure 117: Europe Market Share and BPS Analysis by Country – 2022 & 2029

Figure 118: Europe Market, Y-o-Y Growth Projections by Country, 2022 to 2029

Figure 119: Europe Market Attractiveness Analysis by Country, 2022 to 2029

Figure 120: Europe Absolute $ Opportunity (US$ Million) by Germany Segment, 2014 to 2029

Figure 121: Europe Absolute $ Opportunity (US$ Million) by Italy Segment, 2014 to 2029

Figure 122: Europe Absolute $ Opportunity (US$ Million) by France Segment, 2014 to 2029

Figure 123: Europe Absolute $ Opportunity (US$ Million) by U.K. Segment, 2014 to 2029

Figure 124: Europe Absolute $ Opportunity (US$ Million) by Spain Segment, 2014 to 2029

Figure 125: Europe Absolute $ Opportunity (US$ Million) by BENELUX Segment, 2014 to 2029

Figure 126: Europe Absolute $ Opportunity (US$ Million) by Nordic Segment, 2014 to 2029

Figure 127: Europe Absolute $ Opportunity (US$ Million) by Russia Segment, 2014 to 2029

Figure 128: Europe Absolute $ Opportunity (US$ Million) by Rest of Europe Segment, 2014 to 2029

Figure 129: Europe Market Share and BPS Analysis by Technology– 2022 & 2029

Figure 130: Europe Market Y-o-Y Growth Projections by Technology, 2021 to 2029

Figure 131: Europe Market Attractiveness by Technology, 2022 to 2029

Figure 132: Europe Market Share and BPS Analysis by Place of Use– 2022 & 2029

Figure 133: Europe Market Y-o-Y Growth Projections by Place of Use, 2021 to 2029

Figure 134: Europe Market Attractiveness by Place of Use, 2022 to 2029

Figure 135: Europe Market Share and BPS Analysis by Product Type– 2022 & 2029

Figure 136: Europe Market Y-o-Y Growth Projections by Product Type, 2021 to 2029

Figure 137: Europe Market Attractiveness by Product Type, 2022 to 2029

Figure 138: Europe Market Share and BPS Analysis by Application– 2022 & 2029

Figure 139: Europe Market Y-o-Y Growth Projections by Application, 2021 to 2029

Figure 140: Europe Market Attractiveness by Application, 2022 to 2029

Figure 141: Europe Market Share and BPS Analysis by Door Type– 2022 & 2029

Figure 142: Europe Market Y-o-Y Growth Projections by Door Type, 2021 to 2029

Figure 143: Europe Market Attractiveness by Door Type, 2022 to 2029

Figure 144: Europe Market Share and BPS Analysis by Sales Channel– 2022 & 2029

Figure 145: Europe Market Y-o-Y Growth Projections by Sales Channel, 2021 to 2029

Figure 146: Europe Market Attractiveness by Sales Channel, 2022 to 2029

Figure 147: Europe Market Share and BPS Analysis by Mounting Type– 2022 & 2029

Figure 148: Europe Market Y-o-Y Growth Projections by Mounting Type, 2021 to 2029

Figure 149: Europe Market Attractiveness by Mounting Type, 2022 to 2029

Figure 150: South Asia Market Share and BPS Analysis by Country – 2022 & 2029

Figure 151: South Asia Market, Y-o-Y Growth Projections by Country, 2022 to 2029

Figure 152: South Asia Market Attractiveness Analysis by Country, 2022 to 2029

Figure 153: South Asia Absolute $ Opportunity (US$ Million) by India Segment, 2014 to 2029

Figure 154: South Asia Absolute $ Opportunity (US$ Million) by Thailand Segment, 2014 to 2029

Figure 155: South Asia Absolute $ Opportunity (US$ Million) by Malaysia Segment, 2014 to 2029

Figure 156: South Asia Absolute $ Opportunity (US$ Million) by Philippines Segment, 2014 to 2029

Figure 157: South Asia Absolute $ Opportunity (US$ Million) by Rest of South Asia Segment, 2014 to 2029

Figure 158: South Asia Market Share and BPS Analysis by Technology– 2022 & 2029

Figure 159: South Asia Market Y-o-Y Growth Projections by Technology, 2021 to 2029

Figure 160: South Asia Market Attractiveness by Technology, 2022 to 2029

Figure 161: South Asia Market Share and BPS Analysis by Place of Use– 2022 & 2029

Figure 162: South Asia Market Y-o-Y Growth Projections by Place of Use, 2021 to 2029

Figure 163: South Asia Market Attractiveness by Place of Use, 2022 to 2029

Figure 164: South Asia Market Share and BPS Analysis by Product Type– 2022 & 2029

Figure 165: South Asia Market Y-o-Y Growth Projections by Product Type, 2021 to 2029

Figure 166: South Asia Market Attractiveness by Product Type, 2022 to 2029

Figure 167: South Asia Market Share and BPS Analysis by Application– 2022 & 2029

Figure 168: South Asia Market Y-o-Y Growth Projections by Application, 2021 to 2029

Figure 169: South Asia Market Attractiveness by Application, 2022 to 2029

Figure 170: South Asia Market Share and BPS Analysis by Door Type– 2022 & 2029

Figure 171: South Asia Market Y-o-Y Growth Projections by Door Type, 2021 to 2029

Figure 172: South Asia Market Attractiveness by Door Type, 2022 to 2029

Figure 173: South Asia Market Share and BPS Analysis by Sales Channel– 2022 & 2029

Figure 174: South Asia Market Y-o-Y Growth Projections by Sales Channel, 2021 to 2029

Figure 175: South Asia Market Attractiveness by Sales Channel, 2022 to 2029

Figure 176: South Asia Market Share and BPS Analysis by Mounting Type– 2022 & 2029

Figure 177: South Asia Market Y-o-Y Growth Projections by Mounting Type, 2021 to 2029

Figure 178: South Asia Market Attractiveness by Mounting Type, 2022 to 2029

Figure 179: East Asia Market Share and BPS Analysis by Country – 2022 & 2029

Figure 180: East Asia Market, Y-o-Y Growth Projections by Country, 2022 to 2029

Figure 181: East Asia Market Attractiveness Analysis by Country, 2022 to 2029

Figure 182: East Asia Absolute $ Opportunity (US$ Million) by Japan Segment, 2014 to 2029

Figure 183: East Asia Absolute $ Opportunity (US$ Million) by China Segment, 2014 to 2029

Figure 184: East Asia Absolute $ Opportunity (US$ Million) by South Korea Segment, 2014 to 2029

Figure 185: East Asia Market Share and BPS Analysis by Technology– 2022 & 2029

Figure 186: East Asia Market Y-o-Y Growth Projections by Technology, 2021 to 2029

Figure 187: East Asia Market Attractiveness by Technology, 2022 to 2029

Figure 188: East Asia Market Share and BPS Analysis by Place of Use– 2022 & 2029

Figure 189: East Asia Market Y-o-Y Growth Projections by Place of Use, 2021 to 2029

Figure 190: East Asia Market Attractiveness by Place of Use, 2022 to 2029

Figure 191: East Asia Market Share and BPS Analysis by Product Type– 2022 & 2029

Figure 192: East Asia Market Y-o-Y Growth Projections by Product Type, 2021 to 2029

Figure 193: East Asia Market Attractiveness by Product Type, 2022 to 2029

Figure 194: East Asia Market Share and BPS Analysis by Application– 2022 & 2029

Figure 195: East Asia Market Y-o-Y Growth Projections by Application, 2021 to 2029

Figure 196: East Asia Market Attractiveness by Application, 2022 to 2029

Figure 197: East Asia Market Share and BPS Analysis by Door Type– 2022 & 2029

Figure 198: East Asia Market Y-o-Y Growth Projections by Door Type, 2021 to 2029

Figure 199: East Asia Market Attractiveness by Door Type, 2022 to 2029

Figure 200: East Asia Market Share and BPS Analysis by Sales Channel– 2022 & 2029

Figure 201: East Asia Market Y-o-Y Growth Projections by Sales Channel, 2021 to 2029

Figure 202: East Asia Market Attractiveness by Sales Channel, 2022 to 2029

Figure 203: East Asia Market Share and BPS Analysis by Mounting Type– 2022 & 2029

Figure 204: East Asia Market Y-o-Y Growth Projections by Mounting Type, 2021 to 2029

Figure 205: East Asia Market Attractiveness by Mounting Type, 2022 to 2029

Figure 206: Oceania Market Share and BPS Analysis by Country – 2022 & 2029

Figure 207: Oceania Market, Y-o-Y Growth Projections by Country, 2022 to 2029

Figure 208: Oceania Market Attractiveness Analysis by Country, 2022 to 2029

Figure 209: Oceania Absolute $ Opportunity (US$ Million) by Australia Segment, 2014 to 2029

Figure 210: Oceania Absolute $ Opportunity (US$ Million) by New Zealand Segment, 2014 to 2029

Figure 211: Oceania Market Share and BPS Analysis by Technology– 2022 & 2029

Figure 212: Oceania Market Y-o-Y Growth Projections by Technology, 2021 to 2029

Figure 213: Oceania Market Attractiveness by Technology, 2022 to 2029

Figure 214: Oceania Market Share and BPS Analysis by Place of Use– 2022 & 2029

Figure 215: Oceania Market Y-o-Y Growth Projections by Place of Use, 2021 to 2029

Figure 216: Oceania Market Attractiveness by Place of Use, 2022 to 2029

Figure 217: Oceania Market Share and BPS Analysis by Product Type– 2022 & 2029

Figure 218: Oceania Market Y-o-Y Growth Projections by Product Type, 2021 to 2029

Figure 219: Oceania Market Attractiveness by Product Type, 2022 to 2029

Figure 220: Oceania Market Share and BPS Analysis by Application– 2022 & 2029

Figure 221: Oceania Market Y-o-Y Growth Projections by Application, 2021 to 2029

Figure 222: Oceania Market Attractiveness by Application, 2022 to 2029

Figure 223: Oceania Market Share and BPS Analysis by Door Type– 2022 & 2029

Figure 224: Oceania Market Y-o-Y Growth Projections by Door Type, 2021 to 2029

Figure 225: Oceania Market Attractiveness by Door Type, 2022 to 2029

Figure 226: Oceania Market Share and BPS Analysis by Sales Channel– 2022 & 2029

Figure 227: Oceania Market Y-o-Y Growth Projections by Sales Channel, 2021 to 2029

Figure 228: Oceania Market Attractiveness by Sales Channel, 2022 to 2029

Figure 229: Oceania Market Share and BPS Analysis by Mounting Type– 2022 & 2029

Figure 230: Oceania Market Y-o-Y Growth Projections by Mounting Type, 2021 to 2029

Figure 231: Oceania Market Attractiveness by Mounting Type, 2022 to 2029

Figure 232: Middle East & Africa Market Share and BPS Analysis by Country – 2022 & 2029

Figure 233: Middle East & Africa Market, Y-o-Y Growth Projections by Country, 2022 to 2029

Figure 234: Middle East & Africa Market Attractiveness Analysis by Country, 2022 to 2029

Figure 235: Middle East & Africa Absolute $ Opportunity (US$ Million) by GCC Countries Segment, 2014 to 2029

Figure 236: Middle East & Africa Absolute $ Opportunity (US$ Million) by Turkey Segment, 2014 to 2029

Figure 237: Middle East & Africa Absolute $ Opportunity (US$ Million) by South Africa Segment, 2014 to 2029

Figure 238: Middle East & Africa Absolute $ Opportunity (US$ Million) by Rest of MEA Segment, 2014 to 2029

Figure 239: Middle East & Africa Market Share and BPS Analysis by Technology– 2022 & 2029

Figure 240: Middle East & Africa Market Y-o-Y Growth Projections by Technology, 2021 to 2029

Figure 241: Middle East & Africa Market Attractiveness by Technology, 2022 to 2029

Figure 242: Middle East & Africa Market Share and BPS Analysis by Place of Use– 2022 & 2029

Figure 243: Middle East & Africa Market Y-o-Y Growth Projections by Place of Use, 2021 to 2029

Figure 244: Middle East & Africa Market Attractiveness by Place of Use, 2022 to 2029

Figure 245: Middle East & Africa Market Share and BPS Analysis by Product Type– 2022 & 2029

Figure 246: Middle East & Africa Market Y-o-Y Growth Projections by Product Type, 2021 to 2029

Figure 247: Middle East & Africa Market Attractiveness by Product Type, 2022 to 2029

Figure 248: Middle East & Africa Market Share and BPS Analysis by Application– 2022 & 2029

Figure 249: Middle East & Africa Market Y-o-Y Growth Projections by Application, 2021 to 2029

Figure 250: Middle East & Africa Market Attractiveness by Application, 2022 to 2029

Figure 251: Middle East & Africa Market Share and BPS Analysis by Door Type– 2022 & 2029

Figure 252: Middle East & Africa Market Y-o-Y Growth Projections by Door Type, 2021 to 2029

Figure 253: Middle East & Africa Market Attractiveness by Door Type, 2022 to 2029

Figure 254: Middle East & Africa Market Share and BPS Analysis by Sales Channel– 2022 & 2029

Figure 255: Middle East & Africa Market Y-o-Y Growth Projections by Sales Channel, 2021 to 2029

Figure 256: Middle East & Africa Market Attractiveness by Sales Channel, 2022 to 2029

Figure 257: Middle East & Africa Market Share and BPS Analysis by Mounting Type– 2022 & 2029

Figure 258: Middle East & Africa Market Y-o-Y Growth Projections by Mounting Type, 2021 to 2029

Figure 259: Middle East & Africa Market Attractiveness by Mounting Type, 2022 to 2029

Figure 260: Emerging Markets Market Share by Country, 2019E

Figure 261: Global Market Share by Region, 2019E

Figure 262: Global & Emerging Countries Market Y-o-Y Growth Projections, 2021 to 2029

Figure 263: Global & Emerging Countries Market Share and BPS Analysis – 2022 & 2029

Recommendations

Industrial Automation

Combi Cooler Market

Published : July 2023

Industrial Automation

Refrigeration Coolers Market

Published : May 2023

Explore Industrial Automation Insights

View Reports

Walk-in Coolers and Freezers Market