

- Market Size (2026)
- USD 14.8 Bn
- Forecast (2036)
- USD 26.9 Bn
- CAGR (2026 to 2036)
- 6.2%
How big is the water softening systems market in 2026?
The water softening systems market was valued at USD 13.9 billion in 2025 and is expected to reach USD 14.8 billion in 2026, before growing at a 6.2% CAGR to USD 26.9 billion by 2036. Demand spans households, commercial premises and industrial facilities, where incoming water hardness and consumption determine the treatment capacity required. The growth outlook therefore combines new equipment demand with the continuing installation, replenishment and maintenance needs of operating systems.
Established configurations retain a substantial position in the 2026 market. Electric systems account for 65.0% of operation-type demand, salt-based softeners represent 58.0% of product demand, and twin-cylinder systems hold 44.0% of the design category. Residential applications form the largest application segment at 37.6%, with purchasing decisions influenced by the water quality maintained between service events and the recurring costs of regeneration, salt use and discharge management.
Among the markets profiled, the United States has the highest forecast CAGR at 6.5%, followed by the European Union at 6.3%, while South Korea, Japan and the United Kingdom range from 6.0% to 6.2%. Competition among suppliers such as Culligan, A.O. Smith, EcoWater, Kinetico and Pentair consequently extends beyond equipment specifications to system sizing and dependable local support. Alternative adsorbent research offers a further development opportunity, while installation and service capabilities remain central to the commercial proposition of established systems.
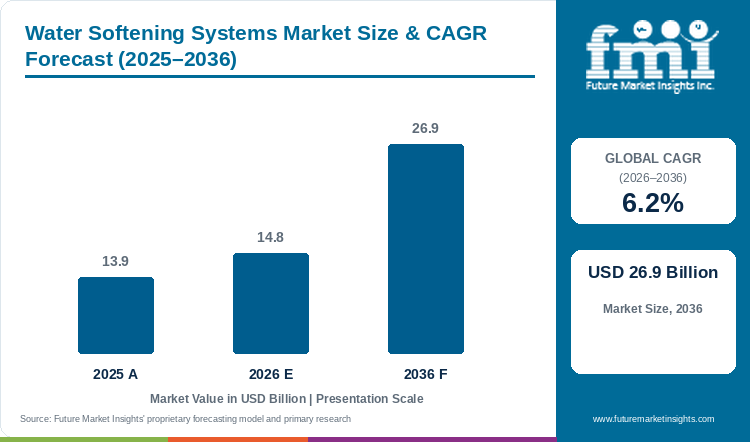
Key Market Trends & Insights
- The Electric segment is projected to account for 65.0% of operation type demand in 2026.
- The Residential segment is projected to account for 37.6% of application type demand in 2026.
- Twin Cylinder is projected to account for 44.0% of design demand in 2026.
- Salt Based Water Softeners is projected to account for 58.0% of product demand in 2026.
Regional Highlights
- United States records the highest profiled forecast at 6.5% CAGR from 2026 to 2036.
- United Kingdom is forecast at 6.0% CAGR over the same period. Country and combined-market rates are analyst estimates.
Market Size & Forecast
Table 1: Market Size and Forecast for Water Softening Systems Market, 2026 to 2036
| Metric | Value |
|---|---|
| 2025 market value | USD 13.9 billion |
| 2026 market estimate | USD 14.8 billion |
| 2036 market forecast | USD 26.9 billion |
| CAGR, 2026 to 2036 | 6.2% |
Purchasing Evidence and Operating Requirements
Table 2: Purchasing Evidence and Operating Requirements
| Source | Date | Evidence | Coverage |
|---|---|---|---|
| Nazeer and colleagues | 2025-09-20 | Adsorbent synthesis and batch tests | Laboratory research published September 2025.[1] |
| Danesh and colleagues | 2026-02-14 | Continuous fixed-bed adsorption experiment | Laboratory column experiments published February 2026.[2] |
| ELsayed and colleagues | 2026-02-10 | Batch and continuous tests with real groundwater | Groundwater and column experiments reported in 2026.[3] |
| Madison Metropolitan Sewerage District | 2025-04-02 | Limited retrofit pilot programme | Programme launch April 2025; two-month participant test.[4] |
Analyst Perspective
Measured hardness and consumption provide the starting point for softener capacity, while regeneration settings and service determine how the result is maintained in everyday use. Customers can assess operating value more clearly when the proposal explains replenishment, target water quality and the practical requirements of the installed system.
- Nikhil Kaitwade, Principal Analyst at Future Market Insights
How is the water softening systems market segmented?
By operation type, the categories are Electric, Non-Electric. By application type, the categories are Residential, Industrial, Commercial. By design, the categories are Twin Cylinder, Mono Cylinder, Multi-Cylinder. By product, the categories are Salt Based Water Softeners, Salt Free Water Softeners, Portable Water Softeners, Industrial Water Softeners. By technology, the categories are Ion Exchange Technology, Salt Free Technology, Smart Technology, Energy Efficiency Technology. By end use, the categories are Households, Commercial Establishments, Industrial Facilities, Municipal Authorities. By distribution channel, the categories are Direct Sales, Distributors and Dealers, Online Sales.
Why does the Electric segment account for 65.0% of operation type demand in 2026?
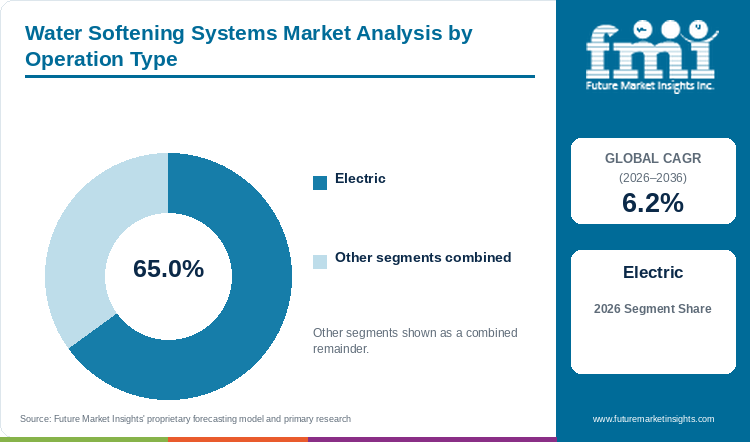
Electric systems hold 65.0% of operation type demand in 2026, using controllers to manage timed or demand-based functions within the installed softening arrangement.
Table 3: Operation Type Share for Water Softening Systems Market, 2026
| Operation Type | Share (2026) |
|---|---|
| Electric | 65.0% |
| Other operation type segments | 35.0% |
| Total | 100.0% |
An electric controller can schedule regeneration or respond to demand, but the useful result follows the settings chosen for the water being treated. Recovery after a power interruption also needs to be understood, particularly where a lost programme could alter the operating cycle. Access for salt replenishment and routine servicing remains necessary around those automated functions, giving installers a reason to explain the complete arrangement and maintenance schedule before a customer compares controller features with the performance expected at the tap.
- The Electric segment accounts for 65.0% of operation type demand in 2026.
- Electrical controls need settings appropriate to the installed water demand.
Why does the Residential segment account for 37.6% of application type demand in 2026?
Residential installations represent 37.6% of application type demand in 2026, with household consumption and incoming hardness setting the capacity and regeneration requirement.
Table 4: Application Type Share for Water Softening Systems Market, 2026
| Application Type | Share (2026) |
|---|---|
| Residential | 37.6% |
| Other application type segments | 62.4% |
| Total | 100.0% |
Oversizing a household softener or using unsuitable regeneration settings can add operating burdens without improving the water the resident needs. A water analysis and consumption estimate therefore establish the treatment duty, with target hardness allowing a customer to compare the result maintained across the operating cycle. Demonstrated removal of calcium and magnesium provides a defined measure for that comparison, while replenishment and service requirements show what the household must do to preserve it after installation.
- The Residential segment accounts for 37.6% of application type demand in 2026.
- Residential sizing should reflect measured hardness and consumption.
What are the drivers, restraints, and opportunities in the water softening systems market?
Driver: Hardness creates an application-specific treatment requirement
Measured feedwater and the equipment it serves determine whether softening belongs in a commercial or industrial treatment train. Reverse osmosis pumps provide pressure for another stage where membranes are used, making the combined process's materials, operating conditions and target water quality important when the complete arrangement is specified.
Restraint: Regeneration and discharge affect operating costs
Salt replenishment and regeneration create recurring requirements for ion-exchange systems, while Middleton's 2025 programme proposed blending valves for compatible existing units.[4] The intended reduction in salt discharge still required trial evidence, with settings and the volume needing treatment determining whether the revised arrangement could meet the customer's water-quality objective.
Opportunity: Alternative media create a development opportunity
Polymer and modified-zeolite studies explore hardness removal in small-scale tests, providing directions that need further qualification for commercial use.[1][2] Defined feedwater applications offer a basis for that development, with cooling compressors and district heating creating wider thermal-system contexts where water characterization by analytical equipment can inform treatment choices.
Which country and market growth rates are profiled?
Table 5: Country CAGR Comparison for Water Softening Systems Market, 2026 to 2036
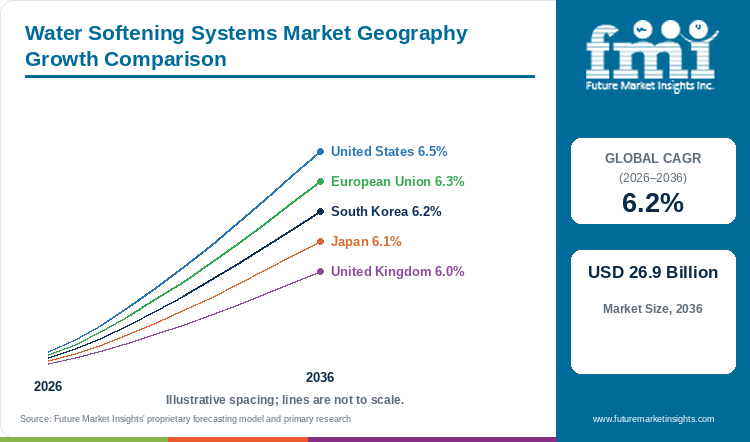
| Country | CAGR |
|---|---|
| United States | 6.5% |
| European Union | 6.3% |
| South Korea | 6.2% |
| Japan | 6.1% |
| United Kingdom | 6.0% |
Growth rates in the table are FMI analyst forecasts.
Country-wise Analysis
United States
Middleton's 2025 blending-valve programme offered 48 packages to eligible homeowners for a limited retrofit trial, identifying one United States route into systems already installed.[4] The programme's proposed work and two-month participant test need to remain distinct from completed salt savings or nationwide rebate availability. The broader market is forecast at 6.5% CAGR for 2026 to 2036, including household installations and recurring service where the customer's hardness target determines whether a retrofit or another treatment arrangement is appropriate.
European Union
Local water characteristics and discharge conditions give a European Union household its own softener-sizing problem, even where the equipment is sold across several markets. Capacity and regeneration need to be compared at the actual hardness and consumption level, with service and replenishment included in the ownership assessment. Across the combined-market forecast of 6.3% CAGR over 2026 to 2036, suppliers can make the offer clearer by stating the water quality maintained and the operating requirements needed to sustain it.
South Korea
South Korean residential customers and process-water users can require different flows and target qualities, making one general treatment claim a poor basis for selecting equipment. Settings and accessible service help establish a practical installed offer, while an alternative medium demonstrated in research still requires the qualification relevant to its proposed use. Demand is projected at 6.2% CAGR during 2026 to 2036. The equipment comparison consequently needs a defined treatment duty before laboratory performance can inform a commercial household or industrial decision.
Japan
A compact system can suit the available space in a Japanese property while still leaving too little access for the maintenance or replenishment it requires. The customer needs to understand the treated-water result across the cycle as well as the space occupied by the housing, with the installation designed around both. Japan's 6.1% CAGR forecast for 2026 to 2036 includes these ownership decisions, where an accessible, correctly sized arrangement can serve the household more usefully than extra controller features alone.
United Kingdom
The United Kingdom outlook is 6.0% CAGR over 2026 to 2036, with local hardness and the quality required at the point of use setting the treatment objective for households and businesses. Dealer assessment can establish whether full softening, blending or bypass arrangements suit that objective, while salt replenishment and the available service schedule determine the continuing work and cost attached to the chosen system. Those details allow the customer to compare the installed result with the practical requirements of owning it.
Who are the notable companies in the water softening systems market?
Culligan International; A.O. Smith; EcoWater Systems; Kinetico; Pentair
Culligan, EcoWater and Kinetico have direct softening and water-treatment exposure, while A.O. Smith and Pentair provide wider relevant portfolios. The proposed service package needs to identify installation and replenishment responsibilities, because the customer experience depends on local support as well as the treatment capacity of the unit supplied.
Competitive Benchmarking: Water Softening Systems Market
Table 6: Competitive Benchmarking
| Participant | Relevant portfolio | Purchasing comparison |
|---|---|---|
| Culligan International | Water treatment and softening | Local installation and service |
| A.O. Smith | Residential water-treatment products | System sizing and support |
| EcoWater Systems | Water softeners and treatment | Regeneration and maintenance |
| Kinetico | Water-softening systems | Configuration and service model |
| Pentair | Water-treatment equipment | Product scope and dealer support |
Key Developments in the Water Softening Systems Market
- Madison Metropolitan Sewerage District and Middleton announced a limited blending-valve trial in April 2025 for compatible existing household softeners.[4]
- A fixed-bed laboratory study examined modified zeolite and activated alumina under specified column conditions. Its removal results do not establish commercial throughput or drinking-water certification.[2]
Key Players in the Water Softening Systems Market
- Culligan International: Water treatment and softening.
- A.O. Smith: Residential water-treatment products.
- EcoWater Systems: Water softeners and treatment.
- Kinetico: Water-softening systems.
- Pentair: Water-treatment equipment.
Water Softening Systems Market - Report Scope
Table 7: Report Scope for Water Softening Systems Market
| Coverage field | Report scope |
|---|---|
| Market definition | Hardness-removal systems, alternative adsorbents, industrial softening and retrofits to reduce salt use; excludes treating scale control as mineral removal. |
| Historical reference year | 2025 |
| Market breakdown | operation type, application type, design, product, technology, end use, distribution channel |
| Quantitative Units | USD Billion |
| Regions covered | North America; Latin America; Western Europe; Eastern Europe; East Asia; South Asia and Pacific; Middle East and Africa |
| Countries profiled | United States; European Union; South Korea; Japan; United Kingdom |
| Forecast period | 2026 to 2036 |
| Key companies profiled | Culligan International; A.O. Smith; EcoWater Systems; Kinetico; Pentair |
Water Softening Systems Market - Research Methodology
Table 8: Research Methodology
| Method | Approach |
|---|---|
| Quantitative analysis | Market values, category shares and country forecasts are presented as FMI analyst estimates. |
| Desk research | Government records, public procurement and technical research establish application conditions and documented activity. |
| Evidence assessment | Awards are distinguished from tenders. Laboratory and modeled results retain their stated operating limits. |
| Segmentation framework | Shares use the stated segment axis as their denominator; country rates use the stated forecast period. |
Water Softening Systems Market by Segments
Operation Type
- Electric
- Non-Electric
Application Type
- Residential
- Industrial
- Commercial
Design
- Twin Cylinder
- Mono Cylinder
- Multi-Cylinder
Product
- Salt Based Water Softeners
- Salt Free Water Softeners
- Portable Water Softeners
- Industrial Water Softeners
Technology
- Ion Exchange Technology
- Salt Free Technology
- Smart Technology
- Energy Efficiency Technology
End Use
- Households
- Commercial Establishments
- Industrial Facilities
- Municipal Authorities
Distribution Channel
- Direct Sales
- Distributors and Dealers
- Online Sales
Water Softening Systems Market by Region
- North America
- United States
- Canada
- Latin America
- Brazil
- Mexico
- Argentina
- Chile
- Western Europe
- Germany
- France
- United Kingdom
- Italy
- Spain
- Benelux
- Nordics
- Eastern Europe
- Poland
- Czech Republic
- Romania
- Hungary
- East Asia
- China
- Japan
- South Korea
- South Asia and Pacific
- India
- ASEAN
- Australia and New Zealand
- Middle East and Africa
- GCC Countries
- South Africa
- Türkiye
- Israel
Research Sources and Bibliography
- [1] Nazeer and colleagues; ACS Omega; NLM PubMed. (2025-09-20). Low-Cost and Eco-Friendly Fabrication of Diphenylamine-Based Hyper-Cross-Linked Polymer for Water Softening
- [2] Danesh and colleagues; Scientific Reports; NLM PubMed. (2026-02-14). Investigation of water softening using ceramic adsorbents in a continuous adsorption process
- [3] ELsayed and colleagues; Scientific Reports; NLM PubMed. (2026-02-10). Sustainable hard water treatment using talc derived magnesium silicate zeolite evaluated by statistical physics and field validation in Siwa Oasis
- [4] Madison Metropolitan Sewerage District; City of Middleton. (2025-04-02). New program offers free blending valves to Middleton residents
- Future Market Insights. (2026). Water Softening Systems Market: Global industry analysis and opportunity assessment 2036.
This Report Answers
- How large is the water softening systems market in 2026?
- What market value is forecast for 2036?
- Which operation type category leads in 2026?
- Why does Residential lead its category?
- Which profiled market has the highest forecast growth?
- Which companies participate in the water softening systems market?
Frequently Asked Questions
How large is the water softening systems market in 2026?
The market is estimated at USD 14.8 billion in 2026, compared with USD 13.9 billion in 2025.
What market value is forecast for 2036?
The forecast is USD 26.9 billion in 2036 at a 6.2% CAGR from 2026 to 2036.
Which operation type category leads in 2026?
The Electric segment is projected to account for 65.0% of operation type demand in 2026.
Why does Residential lead its category?
Residential systems are selected around household consumption and incoming hardness.
Which profiled market has the highest forecast growth?
United States has the highest profiled rate at 6.5% CAGR during 2026 to 2036.
Which companies participate in the water softening systems market?
Culligan International; A.O. Smith; EcoWater Systems; Kinetico; Pentair.
Preview the report firsthand - request a free sample
Get SampleGet the brochure for pricing and purchase details.
Get PDFTable of Content
- Key Takeaways
- Market Size and CAGR
- Top Growth Driver
- Fastest Growing Segment
- Leading Region
- Key Companies
- Emerging Opportunities
- Executive Summary
- Global Market Outlook
- Demand-side Trends
- Supply-side Trends
- Technology Roadmap Analysis
- Analysis and Recommendations
- Analyst Perspective (What is happening? Why now? What should investors know?)
- Key Questions Answered
- How large is the market?
- What is the CAGR?
- What are key trends?
- Which region dominates?
- Who are the leaders?
- Market Overview
- Market Coverage / Taxonomy
- Market Definition / Scope / Limitations
- Research Methodology
- Chapter Orientation
- Analytical Lens and Working Hypotheses
- Market Structure, Signals, and Trend Drivers
- Benchmarking and Cross-market Comparability
- Market Sizing, Forecasting, and Opportunity Mapping
- Research Design and Evidence Framework
- Desk Research Programme (Secondary Evidence)
- Expert Input and Fieldwork (Primary Evidence)
- Tooling, Models, and Reference Databases
- Data Engineering and Model Build
- Quality Assurance and Audit Trail
- Market Background
- Market Dynamics (Drivers, Restraints, Opportunity, Trends)
- Scenario Forecast (Optimistic, Likely, Conservative)
- Impact Analysis
- AI Impact
- Sustainability Impact
- Regulatory Impact
- Technology Impact
- Consumer / Buyer Analysis
- Purchase Drivers
- Adoption Barriers
- Buyer Journey
- Opportunity Map Analysis
- Product Life Cycle Analysis
- Supply Chain Analysis
- Investment Feasibility Matrix
- Value Chain Analysis
- PESTLE and Porter's Analysis
- Regulatory Landscape
- Regional Parent Market Outlook
- Production and Consumption Statistics
- Import and Export Statistics
- Global Market Analysis and Forecast, 2021 to 2036
- Historical Market Size Value (USD Billion) Analysis, 2021 to 2025
- Current and Future Market Size Value (USD Billion) Projections, 2026 to 2036
- Y-o-Y Growth Trend Analysis
- Absolute $ Opportunity Analysis
- Global Market Pricing Analysis, 2021 to 2036
- Global Market Analysis and Forecast, By Operation Type, 2021 to 2036
- Introduction / Key Findings
- Historical Market Size Value (USD Billion) Analysis By Operation Type, 2021 to 2025
- Current and Future Market Size Value (USD Billion) Analysis and Forecast By Operation Type, 2026 to 2036
- Electric
- Non-Electric
- Y-o-Y Growth Trend Analysis By Operation Type, 2021 to 2025
- Absolute $ Opportunity Analysis By Operation Type, 2026 to 2036
- Global Market Analysis and Forecast, By Application Type, 2021 to 2036
- Introduction / Key Findings
- Historical Market Size Value (USD Billion) Analysis By Application Type, 2021 to 2025
- Current and Future Market Size Value (USD Billion) Analysis and Forecast By Application Type, 2026 to 2036
- Residential
- Industrial
- Commercial
- Y-o-Y Growth Trend Analysis By Application Type, 2021 to 2025
- Absolute $ Opportunity Analysis By Application Type, 2026 to 2036
- Global Market Analysis and Forecast, By Design, 2021 to 2036
- Introduction / Key Findings
- Historical Market Size Value (USD Billion) Analysis By Design, 2021 to 2025
- Current and Future Market Size Value (USD Billion) Analysis and Forecast By Design, 2026 to 2036
- Twin Cylinder
- Mono Cylinder
- Multi-Cylinder
- Y-o-Y Growth Trend Analysis By Design, 2021 to 2025
- Absolute $ Opportunity Analysis By Design, 2026 to 2036
- Global Market Analysis and Forecast, By Product, 2021 to 2036
- Introduction / Key Findings
- Historical Market Size Value (USD Billion) Analysis By Product, 2021 to 2025
- Current and Future Market Size Value (USD Billion) Analysis and Forecast By Product, 2026 to 2036
- Salt Based Water Softeners
- Salt Free Water Softeners
- Portable Water Softeners
- Industrial Water Softeners
- Y-o-Y Growth Trend Analysis By Product, 2021 to 2025
- Absolute $ Opportunity Analysis By Product, 2026 to 2036
- Global Market Analysis and Forecast, By Technology, 2021 to 2036
- Introduction / Key Findings
- Historical Market Size Value (USD Billion) Analysis By Technology, 2021 to 2025
- Current and Future Market Size Value (USD Billion) Analysis and Forecast By Technology, 2026 to 2036
- Ion Exchange Technology
- Salt Free Technology
- Smart Technology
- Energy Efficiency Technology
- Y-o-Y Growth Trend Analysis By Technology, 2021 to 2025
- Absolute $ Opportunity Analysis By Technology, 2026 to 2036
- Global Market Analysis and Forecast, By End Use, 2021 to 2036
- Introduction / Key Findings
- Historical Market Size Value (USD Billion) Analysis By End Use, 2021 to 2025
- Current and Future Market Size Value (USD Billion) Analysis and Forecast By End Use, 2026 to 2036
- Households
- Commercial Establishments
- Industrial Facilities
- Municipal Authorities
- Y-o-Y Growth Trend Analysis By End Use, 2021 to 2025
- Absolute $ Opportunity Analysis By End Use, 2026 to 2036
- Global Market Analysis and Forecast, By Distribution Channel, 2021 to 2036
- Introduction / Key Findings
- Historical Market Size Value (USD Billion) Analysis By Distribution Channel, 2021 to 2025
- Current and Future Market Size Value (USD Billion) Analysis and Forecast By Distribution Channel, 2026 to 2036
- Direct Sales
- Distributors and Dealers
- Online Sales
- Y-o-Y Growth Trend Analysis By Distribution Channel, 2021 to 2025
- Absolute $ Opportunity Analysis By Distribution Channel, 2026 to 2036
- Global Market Analysis and Forecast, By Region, 2021 to 2036
- Introduction
- Historical Market Size Value (USD Billion) Analysis By Region, 2021 to 2025
- Current Market Size Value (USD Billion) Analysis and Forecast By Region, 2026 to 2036
- North America
- Latin America
- Western Europe
- Eastern Europe
- East Asia
- South Asia and Pacific
- Middle East and Africa
- Market Attractiveness Analysis By Region
- North America Market Analysis and Forecast, By Country, 2021 to 2036
- Historical Market Size Value (USD Billion) Trend Analysis By Market Taxonomy, 2021 to 2025
- Market Size Value (USD Billion) Forecast By Market Taxonomy, 2026 to 2036
- By Country
- United States
- Canada
- By Operation Type
- By Application Type
- By Design
- By Product
- By Technology
- By End Use
- By Distribution Channel
- By Country
- Market Attractiveness Analysis
- By Country
- By Operation Type
- By Application Type
- By Design
- By Product
- By Technology
- By End Use
- By Distribution Channel
- Key Takeaways
- Latin America Market Analysis and Forecast, By Country
- Historical Market Size Value (USD Billion) Trend Analysis By Market Taxonomy, 2021 to 2025
- Market Size Value (USD Billion) Forecast By Market Taxonomy, 2026 to 2036
- By Country
- Brazil
- Mexico
- Argentina
- Chile
- By Operation Type
- By Application Type
- By Design
- By Product
- By Technology
- By End Use
- By Distribution Channel
- By Country
- Market Attractiveness Analysis
- By Country
- By Operation Type
- By Application Type
- By Design
- By Product
- By Technology
- By End Use
- By Distribution Channel
- Key Takeaways
- Western Europe Market Analysis and Forecast, By Country
- Historical Market Size Value (USD Billion) Trend Analysis By Market Taxonomy, 2021 to 2025
- Market Size Value (USD Billion) Forecast By Market Taxonomy, 2026 to 2036
- By Country
- Germany
- France
- United Kingdom
- Italy
- Spain
- Benelux
- Nordics
- By Operation Type
- By Application Type
- By Design
- By Product
- By Technology
- By End Use
- By Distribution Channel
- By Country
- Market Attractiveness Analysis
- By Country
- By Operation Type
- By Application Type
- By Design
- By Product
- By Technology
- By End Use
- By Distribution Channel
- Key Takeaways
- Eastern Europe Market Analysis and Forecast, By Country
- Historical Market Size Value (USD Billion) Trend Analysis By Market Taxonomy, 2021 to 2025
- Market Size Value (USD Billion) Forecast By Market Taxonomy, 2026 to 2036
- By Country
- Poland
- Czech Republic
- Romania
- Hungary
- By Operation Type
- By Application Type
- By Design
- By Product
- By Technology
- By End Use
- By Distribution Channel
- By Country
- Market Attractiveness Analysis
- By Country
- By Operation Type
- By Application Type
- By Design
- By Product
- By Technology
- By End Use
- By Distribution Channel
- Key Takeaways
- East Asia Market Analysis and Forecast, By Country
- Historical Market Size Value (USD Billion) Trend Analysis By Market Taxonomy, 2021 to 2025
- Market Size Value (USD Billion) Forecast By Market Taxonomy, 2026 to 2036
- By Country
- China
- Japan
- South Korea
- By Operation Type
- By Application Type
- By Design
- By Product
- By Technology
- By End Use
- By Distribution Channel
- By Country
- Market Attractiveness Analysis
- By Country
- By Operation Type
- By Application Type
- By Design
- By Product
- By Technology
- By End Use
- By Distribution Channel
- Key Takeaways
- South Asia and Pacific Market Analysis and Forecast, By Country
- Historical Market Size Value (USD Billion) Trend Analysis By Market Taxonomy, 2021 to 2025
- Market Size Value (USD Billion) Forecast By Market Taxonomy, 2026 to 2036
- By Country
- India
- ASEAN
- Australia and New Zealand
- By Operation Type
- By Application Type
- By Design
- By Product
- By Technology
- By End Use
- By Distribution Channel
- By Country
- Market Attractiveness Analysis
- By Country
- By Operation Type
- By Application Type
- By Design
- By Product
- By Technology
- By End Use
- By Distribution Channel
- Key Takeaways
- Middle East and Africa Market Analysis and Forecast, By Country
- Historical Market Size Value (USD Billion) Trend Analysis By Market Taxonomy, 2021 to 2025
- Market Size Value (USD Billion) Forecast By Market Taxonomy, 2026 to 2036
- By Country
- GCC Countries
- South Africa
- Türkiye
- Israel
- By Operation Type
- By Application Type
- By Design
- By Product
- By Technology
- By End Use
- By Distribution Channel
- By Country
- Market Attractiveness Analysis
- By Country
- By Operation Type
- By Application Type
- By Design
- By Product
- By Technology
- By End Use
- By Distribution Channel
- Key Takeaways
- Key Countries Market Analysis
- United States
- Pricing Analysis
- Market Share Analysis, 2025
- By Operation Type
- By Application Type
- By Design
- By Product
- By Technology
- By End Use
- By Distribution Channel
- Canada
- Pricing Analysis
- Market Share Analysis, 2025
- By Operation Type
- By Application Type
- By Design
- By Product
- By Technology
- By End Use
- By Distribution Channel
- Mexico
- Pricing Analysis
- Market Share Analysis, 2025
- By Operation Type
- By Application Type
- By Design
- By Product
- By Technology
- By End Use
- By Distribution Channel
- Brazil
- Pricing Analysis
- Market Share Analysis, 2025
- By Operation Type
- By Application Type
- By Design
- By Product
- By Technology
- By End Use
- By Distribution Channel
- Chile
- Pricing Analysis
- Market Share Analysis, 2025
- By Operation Type
- By Application Type
- By Design
- By Product
- By Technology
- By End Use
- By Distribution Channel
- Germany
- Pricing Analysis
- Market Share Analysis, 2025
- By Operation Type
- By Application Type
- By Design
- By Product
- By Technology
- By End Use
- By Distribution Channel
- United Kingdom
- Pricing Analysis
- Market Share Analysis, 2025
- By Operation Type
- By Application Type
- By Design
- By Product
- By Technology
- By End Use
- By Distribution Channel
- Italy
- Pricing Analysis
- Market Share Analysis, 2025
- By Operation Type
- By Application Type
- By Design
- By Product
- By Technology
- By End Use
- By Distribution Channel
- Spain
- Pricing Analysis
- Market Share Analysis, 2025
- By Operation Type
- By Application Type
- By Design
- By Product
- By Technology
- By End Use
- By Distribution Channel
- France
- Pricing Analysis
- Market Share Analysis, 2025
- By Operation Type
- By Application Type
- By Design
- By Product
- By Technology
- By End Use
- By Distribution Channel
- India
- Pricing Analysis
- Market Share Analysis, 2025
- By Operation Type
- By Application Type
- By Design
- By Product
- By Technology
- By End Use
- By Distribution Channel
- ASEAN
- Pricing Analysis
- Market Share Analysis, 2025
- By Operation Type
- By Application Type
- By Design
- By Product
- By Technology
- By End Use
- By Distribution Channel
- Australia and New Zealand
- Pricing Analysis
- Market Share Analysis, 2025
- By Operation Type
- By Application Type
- By Design
- By Product
- By Technology
- By End Use
- By Distribution Channel
- China
- Pricing Analysis
- Market Share Analysis, 2025
- By Operation Type
- By Application Type
- By Design
- By Product
- By Technology
- By End Use
- By Distribution Channel
- Japan
- Pricing Analysis
- Market Share Analysis, 2025
- By Operation Type
- By Application Type
- By Design
- By Product
- By Technology
- By End Use
- By Distribution Channel
- South Korea
- Pricing Analysis
- Market Share Analysis, 2025
- By Operation Type
- By Application Type
- By Design
- By Product
- By Technology
- By End Use
- By Distribution Channel
- Poland
- Pricing Analysis
- Market Share Analysis, 2025
- By Operation Type
- By Application Type
- By Design
- By Product
- By Technology
- By End Use
- By Distribution Channel
- Hungary
- Pricing Analysis
- Market Share Analysis, 2025
- By Operation Type
- By Application Type
- By Design
- By Product
- By Technology
- By End Use
- By Distribution Channel
- Türkiye
- Pricing Analysis
- Market Share Analysis, 2025
- By Operation Type
- By Application Type
- By Design
- By Product
- By Technology
- By End Use
- By Distribution Channel
- South Africa
- Pricing Analysis
- Market Share Analysis, 2025
- By Operation Type
- By Application Type
- By Design
- By Product
- By Technology
- By End Use
- By Distribution Channel
- European Union
- Pricing Analysis
- Market Share Analysis, 2025
- By Operation Type
- By Application Type
- By Design
- By Product
- By Technology
- By End Use
- By Distribution Channel
- United States
- Market Structure Analysis
- Competition Dashboard
- Competition Benchmarking
- Market Share Analysis of Top Players
- By Regional
- By Operation Type
- By Application Type
- By Design
- By Product
- By Technology
- By End Use
- By Distribution Channel
- Emerging Startups
- Innovation Benchmarking
- Competition Analysis
- Competition Deep Dive
- Culligan International
- Overview
- Product Portfolio
- Profitability by Market Segments
- Sales Footprint
- Strategy Overview
- Marketing Strategy
- Product Strategy
- Channel Strategy
- A.O. Smith
- EcoWater Systems
- Kinetico
- Pentair
- Culligan International: Water treatment and softening.
- A.O. Smith: Residential water-treatment products.
- EcoWater Systems: Water softeners and treatment.
- Kinetico: Water-softening systems.
- Pentair: Water-treatment equipment.
- Culligan International
- Case Studies
- Success Stories
- Recent Developments
- Competition Deep Dive
- Assumptions & Acronyms Used


