Zero Liquid Discharge System Market Size and Share Forecast Outlook From 2024 to 2034

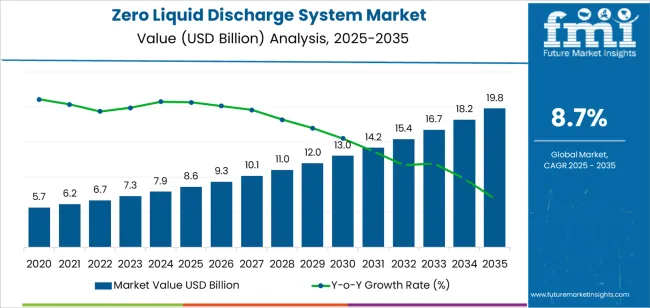
The zero liquid discharge system market is projected to be worth USD 7.9 billion in 2024. The market is anticipated to reach USD 18.1 billion by 2034. The market is further expected to surge at a CAGR of 8.7% during the forecast period 2024 to 2034.

Attributes Key Insights
Zero Liquid Discharge System Market Estimated Size in 2024 USD 7.9 billion
Projected Market Value in 2034 USD 18.1 billion
Value-based CAGR from 2024 to 2034 8.7%

Top Market Trends and Industry Highlights in the Zero Liquid Discharge System Sector

Increasingly stringent regulations regarding wastewater discharge and pollution control drive industries to adopt zero liquid discharge systems to comply with environmental standards. Governments worldwide are imposing strict guidelines to protect water bodies, creating a favorable environment for these systems.

  • Growing concerns over water scarcity, especially in regions facing droughts and water stress, are driving industries to implement water conservation measures like zero liquid discharge systems. The systems helps in recycling and reusing wastewater, thereby reducing the strain on freshwater sources.
  • Continuous advancements in zero liquid discharge technologies have improved their efficiency, affordability, and scalability. Innovations such as membrane based systems, evaporators, crystallizers, and hybrid the systems offer more effective solutions for wastewater treatment, making zero liquid discharge systems more attractive to industries.
  • Zero liquid discharge systems enable industries to recover valuable resources such as water, salts, and other chemicals from wastewater, reducing operational costs and enhancing sustainability. The potential for resource recovery makes zero liquid discharge systems economically viable for industries in the long run.

Comparison of Historical vs Future Outlook on Changing Consumer Trends for Zero Liquid Discharge Systems

The scope for zero liquid discharge system rose at an 11.2% CAGR between 2019 and 2023. The global market is anticipated to grow at a moderate CAGR of 8.7% over the forecast period 2024 to 2034.

Stringent environmental regulations regarding wastewater discharge and pollution control have been a primary driver of the zero liquid discharge market, during the historical period. Industries across various sectors have been compelled to adopt zero liquid discharge systems to meet regulatory standards and minimize environmental impact.

Advances in zero liquid discharge technologies, such as membrane based systems, evaporators, crystallizers, and hybrid solutions, have improved system efficiency, reliability, and cost effectiveness. The technological advancements have enhanced the attractiveness of zero liquid discharge systems to industries seeking sustainable wastewater treatment solutions.

Regulatory frameworks governing wastewater management and pollution control are expected to become even more stringent in the forecasted period. Governments worldwide are likely to impose stricter standards and enforcement measures, driving further adoption of zero liquid discharge systems across industries.

The forecasted period is expected to witness continued innovation and integration of advanced technologies into zero liquid discharge systems. Technologies such as artificial intelligence, IoT sensors, and automation will enable more efficient operation, monitoring, and optimization of zero liquid discharge processes, driving market growth and adoption.

Factors Driving the Demand for Zero Liquid Discharge Systems

Rapid industrialization, especially in emerging economies, leads to increased industrial wastewater generation. Industries such as power generation, chemicals, textiles, pharmaceuticals, and mining are adopting zero liquid discharge systems to manage their wastewater effectively and sustainably.

  • Growing public awareness regarding environmental issues and corporate responsibility towards sustainability are driving industries to adopt eco friendly practices, including zero liquid discharge systems. Companies that demonstrate commitment to environmental stewardship gain reputational benefits and consumer trust.
  • Governments and regulatory bodies may offer incentives, subsidies, or tax benefits to encourage industries to invest in sustainable wastewater treatment technologies like ZLD systems. The financial incentives can significantly reduce the initial capital investment required for implementing zero liquid discharge systems.
  • The expanding zero liquid discharge market offers opportunities for technology providers, engineering firms, and consultants involved in designing, installing, and maintaining zero liquid discharge systems. Partnerships and collaborations between technology providers and end users can drive innovation and market growth.

Factors Restraining the Growth of the Zero Liquid Discharge System Market

The implementation of zero liquid discharge systems requires substantial initial capital investment due to the cost of equipment, installation, and infrastructure upgrades. For some industries, especially smaller enterprises or those operating in regions with limited financial resources, the high upfront costs may act as a barrier to adoption.

  • Zero liquid discharge systems involve complex engineering processes and specialized technologies for wastewater treatment, including membrane filtration, evaporation, and crystallization. Implementing and operating these systems require technical expertise and ongoing maintenance, which may pose challenges for some industries lacking the necessary knowledge and resources.
  • Many technologies, such as thermal evaporation and membrane filtration, are energy intensive processes. The high energy consumption associated with operating zero liquid discharge systems can result in significant operational costs and environmental impact, particularly if the energy source is not renewable or efficient.
  • The successful operation and maintenance of zero liquid discharge systems require a skilled workforce with expertise in water treatment technologies, process optimization, and regulatory compliance. There may be a shortage of qualified professionals trained in zero liquid discharge system design, operation, and troubleshooting, which can impede market growth.

Analysis of Top Countries, Implementing and Operating Zero Liquid Discharge Solutions

The below table showcases revenues in terms of the top 5 leading countries, spearheaded by Korea and Japan. The countries are expected to lead the market through 2034.

Countries Forecast CAGRs from 2024 to 2034
The United States 9.0%
China 9.5%
The United Kingdom 10.0%
Japan 10.2%
Korea 11.1%

Stringent Environmental Regulations Driving the Market in the United States

The zero liquid discharge system market in the United States expected to expand at a CAGR of 9.0% through 2034. The country has stringent environmental regulations governing wastewater discharge and pollution control.

Compliance with these regulations, including the Clean Water Act and state specific standards, drives the adoption of zero liquid discharge systems by industries to achieve zero liquid discharge and minimize environmental impact.

Water scarcity is a growing concern in many parts of the United States, particularly in arid and water stressed regions such as the Southwest. The systems offer industries a sustainable solution for managing water resources by recycling and reusing wastewater, thereby reducing reliance on freshwater sources and mitigating water scarcity risks.

Industrial Activities and Infrastructure to Accelerate Market Growth in the United Kingdom

The zero liquid discharge system market in the United Kingdom is anticipated to expand at a CAGR of 10.0% through 2034. The country has a diverse industrial base, including sectors such as manufacturing, chemicals, pharmaceuticals, food and beverage, and energy production.

The expansion of industrial activities and infrastructure drives the demand for zero liquid discharge systems to treat and manage wastewater streams effectively, ensuring compliance with regulatory standards and environmental objectives.

The United Kingdom is a hub for technological innovation and research in environmental engineering, water treatment, and sustainability. Ongoing advancements in zero liquid discharge technologies, including membrane filtration, evaporation, crystallization, and hybrid systems, enhance treatment efficiency, reliability, and cost effectiveness, driving adoption across industries.

Investments in Infrastructure and Technology Spearhead the Market in China

Zero liquid discharge system trends in China are taking a turn for the better. A 9.5% CAGR is forecast for the country from 2024 to 2034. The investments in infrastructure development, technology innovation, and industrial modernization in the country support the adoption of advanced wastewater treatment technologies, including zero liquid discharge systems.

Investments in research and development initiatives drive technological advancements and enhance the performance and efficiency of zero liquid discharge systems.

Collaboration between Chinese companies, international technology providers, and government agencies facilitates knowledge transfer, technology exchange, and capacity building in water treatment and environmental management. International partnerships support the development and adoption of zero liquid discharge systems tailored to specific industrial and environmental needs in China.

Advanced Technology and Innovation Fueling the Market in Japan

The zero liquid discharge system market in Japan is poised to expand at a CAGR of 10.2% through 2034. The country is known for its technological innovation and expertise in environmental engineering and water treatment.

Ongoing advancements in zero liquid discharge technologies, including membrane filtration, evaporation, crystallization, and hybrid systems, enhance treatment efficiency, reliability, and cost effectiveness, driving adoption across industries.

Japan has a diverse industrial base, including sectors such as manufacturing, chemicals, pharmaceuticals, electronics, and food processing. The expansion of industrial activities and infrastructure drives the demand for the systems to treat and manage wastewater streams effectively, ensuring compliance with regulatory standards and environmental objectives.

Energy Efficiency and Resource Recovery Driving the Demand in Korea

The zero liquid discharge system market in Korea is anticipated to expand at a CAGR of 11.1% through 2034. The systems offer opportunities for energy recovery and resource recovery from wastewater streams, contributing to energy efficiency and resource conservation goals in Korea.

The zero liquid discharge systems support circular economy principles and promote sustainable resource management practices, by extracting energy and valuable resources from wastewater.

The green growth and sustainable development initiatives in Korea prioritize environmental protection, renewable energy, and resource conservation. Zero liquid discharge systems align with these initiatives by minimizing water pollution, reducing carbon emissions, and promoting sustainable water management practices across industries and sectors.

Zero Liquid Discharge System Industry Analysis by Top Investment Segments

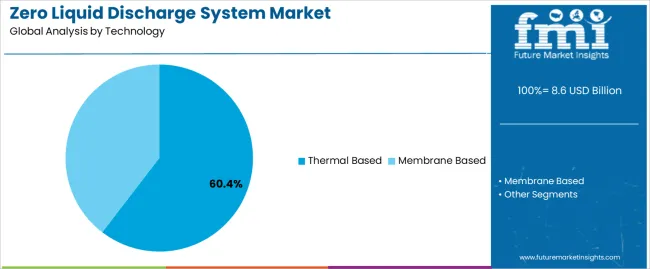
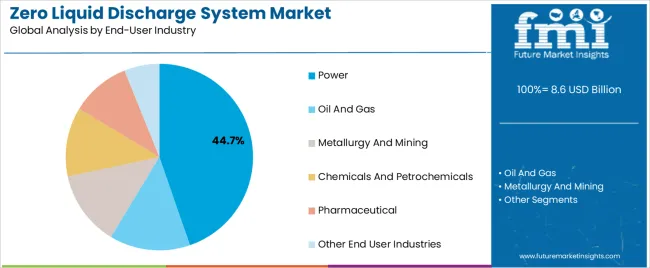
The below table highlights how thermal based segment is projected to lead the market in terms of technology, and is expected to account for a CAGR of 8.5% through 2034. Based on end user industry, the power segment is expected to account for a CAGR of 8.3% through 2034.

Category CAGR from 2024 to 2034
Thermal Based 8.5%
Power 8.3%

Thermal Based Claims High Demand for Zero Liquid Discharge System

Based on technology, the thermal based segment is expected to continue dominating the zero liquid discharge system market. Thermal based zero liquid discharge systems, such as thermal evaporation and crystallization, are highly effective in concentrating brine and other wastewater streams to achieve zero liquid discharge.

The systems utilize heat to evaporate water from the wastewater, leaving behind concentrated brine that can be further processed or disposed of in an environmentally sustainable manner.

Thermal based zero liquid discharge systems are versatile and applicable across a wide range of industries, including power generation, oil and gas, chemical processing, mining, and textiles. They can treat diverse wastewater streams with varying compositions, temperatures, and contaminants, making them suitable for different industrial applications.

Zero Liquid Discharge System extensive utilized for Power Generation

In terms of end user industry, the power segment is expected to continue dominating the zero liquid discharge system market. The power generation industry is subject to strict environmental regulations governing wastewater discharge and pollution control.

Compliance with these regulations necessitates the adoption of advanced wastewater treatment solutions like zero liquid discharge systems, which enable power plants to achieve zero liquid discharge and minimize environmental impact.

Power plants require large quantities of water for cooling and other operational processes. Power plants can recycle and reuse wastewater streams, by implementing zero liquid discharge systems, thereby conserving water resources and reducing freshwater consumption. Zero liquid discharge systems enable power plants to optimize water usage and enhance water resource management practices.
Key Players and Market Concentration in the Zero Liquid Discharge System Industry

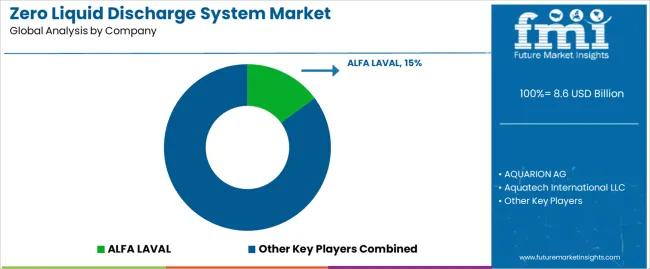
The zero liquid discharge system market is characterized by a competitive landscape shaped by various factors including technological advancements, regulatory requirements, market dynamics, and the presence of key players across different regions.

Company Portfolio

  • ALFA LAVAL provides comprehensive solutions for zero liquid discharge systems, offering a range of technologies and equipment including evaporators, crystallizers, membrane filtration systems, and thermal separation units. Their solutions are designed to efficiently treat industrial wastewater streams, enabling clients to achieve environmental compliance and resource recovery goals.
  • AQUARION AG specializes in custom designed zero liquid discharge systems tailored to the specific needs of industrial clients. Their portfolio includes advanced membrane technologies, thermal processes, and evaporative techniques to achieve complete water reuse and minimal liquid waste generation. The solutions are renowned for their efficiency, reliability, and environmental sustainability.

Key Shifting Preferences Covered in the Zero Liquid Discharge System Market Report

Attribute Details
Estimated Market Size in 2024 USD 7.9 billion
Projected Market Valuation in 2034 USD 18.1 billion
Value-based CAGR 2024 to 2034 8.7%
Forecast Period 2024 to 2034
Historical Data Available for 2019 to 2023
Market Analysis Value in USD billion
Key Regions Covered North America; Latin America; Western Europe; Eastern Europe; South Asia and Pacific; East Asia; The Middle East & Africa
Key Market Segments Covered Technology, End User Industry, Region
Key Countries Profiled The United States, Canada, Brazil, Mexico, Germany, France, France, Spain, Italy, Russia, Poland, Czech Republic, Romania, India, Bangladesh, Australia, New Zealand, China, Japan, South Korea, GCC countries, South Africa, Israel
Key Companies Profiled ALFA LAVAL; AQUARION AG; Aquatech International LLC; Evoqua Water Technologies LLC; GEA Group Aktiengesellschaft; H2O GmbH; IDE Water Technologies.; Mitsubishi Power Ltd; Praj Industries; SafBon Water Technology.

Top Segments Studied in the Zero Liquid Discharge System Market

By Technology:

  • Thermal Based
  • Membrane Based

By End-User Industry:

  • Power
  • Oil and Gas
  • Metallurgy and Mining
  • Chemicals and Petrochemicals
  • Pharmaceutical
  • Other End User Industries

By Region:

  • North America
  • Latin America
  • Western Europe
  • Eastern Europe
  • South Asia and Pacific
  • East Asia
  • The Middle East and Africa

Table of Content

  • 1. Executive Summary
  • 2. Market Overview
  • 3. Market Background
  • 4. Global Market Analysis 2019 to 2023 and Forecast, 2024 to 2034
  • 5. Global Market Analysis 2019 to 2023 and Forecast 2024 to 2034, By Technology
    • 5.1. Thermal-based
    • 5.2. Membrane-based
  • 6. Global Market Analysis 2019 to 2023 and Forecast 2024 to 2034, By End-user Industry
    • 6.1. Power
    • 6.2. Oil and Gas
    • 6.3. Metallurgy and Mining
    • 6.4. Chemicals and Petrochemicals
    • 6.5. Pharmaceutical
    • 6.6. Other End-user Industries
  • 7. Global Market Analysis 2019 to 2023 and Forecast 2024 to 2034, By Region
    • 7.1. North America
    • 7.2. Latin America
    • 7.3. Europe
    • 7.4. East Asia
    • 7.5. South Asia
    • 7.6. Oceania
    • 7.7. MEA
  • 8. North America Market Analysis 2019 to 2023 and Forecast 2024 to 2034, By Country
  • 9. Latin America Market Analysis 2019 to 2023 and Forecast 2024 to 2034, By Country
  • 10. Europe Market Analysis 2019 to 2023 and Forecast 2024 to 2034, By Country
  • 11. East Asia Market Analysis 2019 to 2023 and Forecast 2024 to 2034, By Country
  • 12. South Asia Market Analysis 2019 to 2023 and Forecast 2024 to 2034, By Country
  • 13. Oceania Market Analysis 2019 to 2023 and Forecast 2024 to 2034, By Country
  • 14. MEA Market Analysis 2019 to 2023 and Forecast 2024 to 2034, By Country
  • 15. Key Countries Market Analysis
  • 16. Market Structure Analysis
  • 17. Competition Analysis
    • 17.1. ALFA LAVAL
    • 17.2. AQUARION AG
    • 17.3. Aquatech International LLC
    • 17.4. Evoqua Water Technologies LLC
    • 17.5. GEA Group Aktiengesellschaft
    • 17.6. H2O GmbH
    • 17.7. IDE Water Technologies
    • 17.8. Mitsubishi Power Ltd
    • 17.9. Praj Industries
    • 17.10. SafBon Water Technology
  • 18. Assumptions & Acronyms Used
  • 19. Research Methodology

List of Tables

Table 1: Global Market Value (US$ Million) Forecast by Region, 2019 to 2034

Table 2: Global Market Volume (Units) Forecast by Region, 2019 to 2034

Table 3: Global Market Value (US$ Million) Forecast by Technology, 2019 to 2034

Table 4: Global Market Volume (Units) Forecast by Technology, 2019 to 2034

Table 5: Global Market Value (US$ Million) Forecast by End-user Industry, 2019 to 2034

Table 6: Global Market Volume (Units) Forecast by End-user Industry, 2019 to 2034

Table 7: North America Market Value (US$ Million) Forecast by Country, 2019 to 2034

Table 8: North America Market Volume (Units) Forecast by Country, 2019 to 2034

Table 9: North America Market Value (US$ Million) Forecast by Technology, 2019 to 2034

Table 10: North America Market Volume (Units) Forecast by Technology, 2019 to 2034

Table 11: North America Market Value (US$ Million) Forecast by End-user Industry, 2019 to 2034

Table 12: North America Market Volume (Units) Forecast by End-user Industry, 2019 to 2034

Table 13: Latin America Market Value (US$ Million) Forecast by Country, 2019 to 2034

Table 14: Latin America Market Volume (Units) Forecast by Country, 2019 to 2034

Table 15: Latin America Market Value (US$ Million) Forecast by Technology, 2019 to 2034

Table 16: Latin America Market Volume (Units) Forecast by Technology, 2019 to 2034

Table 17: Latin America Market Value (US$ Million) Forecast by End-user Industry, 2019 to 2034

Table 18: Latin America Market Volume (Units) Forecast by End-user Industry, 2019 to 2034

Table 19: Europe Market Value (US$ Million) Forecast by Country, 2019 to 2034

Table 20: Europe Market Volume (Units) Forecast by Country, 2019 to 2034

Table 21: Europe Market Value (US$ Million) Forecast by Technology, 2019 to 2034

Table 22: Europe Market Volume (Units) Forecast by Technology, 2019 to 2034

Table 23: Europe Market Value (US$ Million) Forecast by End-user Industry, 2019 to 2034

Table 24: Europe Market Volume (Units) Forecast by End-user Industry, 2019 to 2034

Table 25: East Asia Market Value (US$ Million) Forecast by Country, 2019 to 2034

Table 26: East Asia Market Volume (Units) Forecast by Country, 2019 to 2034

Table 27: East Asia Market Value (US$ Million) Forecast by Technology, 2019 to 2034

Table 28: East Asia Market Volume (Units) Forecast by Technology, 2019 to 2034

Table 29: East Asia Market Value (US$ Million) Forecast by End-user Industry, 2019 to 2034

Table 30: East Asia Market Volume (Units) Forecast by End-user Industry, 2019 to 2034

Table 31: South Asia Market Value (US$ Million) Forecast by Country, 2019 to 2034

Table 32: South Asia Market Volume (Units) Forecast by Country, 2019 to 2034

Table 33: South Asia Market Value (US$ Million) Forecast by Technology, 2019 to 2034

Table 34: South Asia Market Volume (Units) Forecast by Technology, 2019 to 2034

Table 35: South Asia Market Value (US$ Million) Forecast by End-user Industry, 2019 to 2034

Table 36: South Asia Market Volume (Units) Forecast by End-user Industry, 2019 to 2034

Table 37: Oceania Market Value (US$ Million) Forecast by Country, 2019 to 2034

Table 38: Oceania Market Volume (Units) Forecast by Country, 2019 to 2034

Table 39: Oceania Market Value (US$ Million) Forecast by Technology, 2019 to 2034

Table 40: Oceania Market Volume (Units) Forecast by Technology, 2019 to 2034

Table 41: Oceania Market Value (US$ Million) Forecast by End-user Industry, 2019 to 2034

Table 42: Oceania Market Volume (Units) Forecast by End-user Industry, 2019 to 2034

Table 43: MEA Market Value (US$ Million) Forecast by Country, 2019 to 2034

Table 44: MEA Market Volume (Units) Forecast by Country, 2019 to 2034

Table 45: MEA Market Value (US$ Million) Forecast by Technology, 2019 to 2034

Table 46: MEA Market Volume (Units) Forecast by Technology, 2019 to 2034

Table 47: MEA Market Value (US$ Million) Forecast by End-user Industry, 2019 to 2034

Table 48: MEA Market Volume (Units) Forecast by End-user Industry, 2019 to 2034

List of Figures

Figure 1: Global Market Value (US$ Million) by Technology, 2024 to 2034

Figure 2: Global Market Value (US$ Million) by End-user Industry, 2024 to 2034

Figure 3: Global Market Value (US$ Million) by Region, 2024 to 2034

Figure 4: Global Market Value (US$ Million) Analysis by Region, 2019 to 2034

Figure 5: Global Market Volume (Units) Analysis by Region, 2019 to 2034

Figure 6: Global Market Value Share (%) and BPS Analysis by Region, 2024 to 2034

Figure 7: Global Market Y-o-Y Growth (%) Projections by Region, 2024 to 2034

Figure 8: Global Market Value (US$ Million) Analysis by Technology, 2019 to 2034

Figure 9: Global Market Volume (Units) Analysis by Technology, 2019 to 2034

Figure 10: Global Market Value Share (%) and BPS Analysis by Technology, 2024 to 2034

Figure 11: Global Market Y-o-Y Growth (%) Projections by Technology, 2024 to 2034

Figure 12: Global Market Value (US$ Million) Analysis by End-user Industry, 2019 to 2034

Figure 13: Global Market Volume (Units) Analysis by End-user Industry, 2019 to 2034

Figure 14: Global Market Value Share (%) and BPS Analysis by End-user Industry, 2024 to 2034

Figure 15: Global Market Y-o-Y Growth (%) Projections by End-user Industry, 2024 to 2034

Figure 16: Global Market Attractiveness by Technology, 2024 to 2034

Figure 17: Global Market Attractiveness by End-user Industry, 2024 to 2034

Figure 18: Global Market Attractiveness by Region, 2024 to 2034

Figure 19: North America Market Value (US$ Million) by Technology, 2024 to 2034

Figure 20: North America Market Value (US$ Million) by End-user Industry, 2024 to 2034

Figure 21: North America Market Value (US$ Million) by Country, 2024 to 2034

Figure 22: North America Market Value (US$ Million) Analysis by Country, 2019 to 2034

Figure 23: North America Market Volume (Units) Analysis by Country, 2019 to 2034

Figure 24: North America Market Value Share (%) and BPS Analysis by Country, 2024 to 2034

Figure 25: North America Market Y-o-Y Growth (%) Projections by Country, 2024 to 2034

Figure 26: North America Market Value (US$ Million) Analysis by Technology, 2019 to 2034

Figure 27: North America Market Volume (Units) Analysis by Technology, 2019 to 2034

Figure 28: North America Market Value Share (%) and BPS Analysis by Technology, 2024 to 2034

Figure 29: North America Market Y-o-Y Growth (%) Projections by Technology, 2024 to 2034

Figure 30: North America Market Value (US$ Million) Analysis by End-user Industry, 2019 to 2034

Figure 31: North America Market Volume (Units) Analysis by End-user Industry, 2019 to 2034

Figure 32: North America Market Value Share (%) and BPS Analysis by End-user Industry, 2024 to 2034

Figure 33: North America Market Y-o-Y Growth (%) Projections by End-user Industry, 2024 to 2034

Figure 34: North America Market Attractiveness by Technology, 2024 to 2034

Figure 35: North America Market Attractiveness by End-user Industry, 2024 to 2034

Figure 36: North America Market Attractiveness by Country, 2024 to 2034

Figure 37: Latin America Market Value (US$ Million) by Technology, 2024 to 2034

Figure 38: Latin America Market Value (US$ Million) by End-user Industry, 2024 to 2034

Figure 39: Latin America Market Value (US$ Million) by Country, 2024 to 2034

Figure 40: Latin America Market Value (US$ Million) Analysis by Country, 2019 to 2034

Figure 41: Latin America Market Volume (Units) Analysis by Country, 2019 to 2034

Figure 42: Latin America Market Value Share (%) and BPS Analysis by Country, 2024 to 2034

Figure 43: Latin America Market Y-o-Y Growth (%) Projections by Country, 2024 to 2034

Figure 44: Latin America Market Value (US$ Million) Analysis by Technology, 2019 to 2034

Figure 45: Latin America Market Volume (Units) Analysis by Technology, 2019 to 2034

Figure 46: Latin America Market Value Share (%) and BPS Analysis by Technology, 2024 to 2034

Figure 47: Latin America Market Y-o-Y Growth (%) Projections by Technology, 2024 to 2034

Figure 48: Latin America Market Value (US$ Million) Analysis by End-user Industry, 2019 to 2034

Figure 49: Latin America Market Volume (Units) Analysis by End-user Industry, 2019 to 2034

Figure 50: Latin America Market Value Share (%) and BPS Analysis by End-user Industry, 2024 to 2034

Figure 51: Latin America Market Y-o-Y Growth (%) Projections by End-user Industry, 2024 to 2034

Figure 52: Latin America Market Attractiveness by Technology, 2024 to 2034

Figure 53: Latin America Market Attractiveness by End-user Industry, 2024 to 2034

Figure 54: Latin America Market Attractiveness by Country, 2024 to 2034

Figure 55: Europe Market Value (US$ Million) by Technology, 2024 to 2034

Figure 56: Europe Market Value (US$ Million) by End-user Industry, 2024 to 2034

Figure 57: Europe Market Value (US$ Million) by Country, 2024 to 2034

Figure 58: Europe Market Value (US$ Million) Analysis by Country, 2019 to 2034

Figure 59: Europe Market Volume (Units) Analysis by Country, 2019 to 2034

Figure 60: Europe Market Value Share (%) and BPS Analysis by Country, 2024 to 2034

Figure 61: Europe Market Y-o-Y Growth (%) Projections by Country, 2024 to 2034

Figure 62: Europe Market Value (US$ Million) Analysis by Technology, 2019 to 2034

Figure 63: Europe Market Volume (Units) Analysis by Technology, 2019 to 2034

Figure 64: Europe Market Value Share (%) and BPS Analysis by Technology, 2024 to 2034

Figure 65: Europe Market Y-o-Y Growth (%) Projections by Technology, 2024 to 2034

Figure 66: Europe Market Value (US$ Million) Analysis by End-user Industry, 2019 to 2034

Figure 67: Europe Market Volume (Units) Analysis by End-user Industry, 2019 to 2034

Figure 68: Europe Market Value Share (%) and BPS Analysis by End-user Industry, 2024 to 2034

Figure 69: Europe Market Y-o-Y Growth (%) Projections by End-user Industry, 2024 to 2034

Figure 70: Europe Market Attractiveness by Technology, 2024 to 2034

Figure 71: Europe Market Attractiveness by End-user Industry, 2024 to 2034

Figure 72: Europe Market Attractiveness by Country, 2024 to 2034

Figure 73: East Asia Market Value (US$ Million) by Technology, 2024 to 2034

Figure 74: East Asia Market Value (US$ Million) by End-user Industry, 2024 to 2034

Figure 75: East Asia Market Value (US$ Million) by Country, 2024 to 2034

Figure 76: East Asia Market Value (US$ Million) Analysis by Country, 2019 to 2034

Figure 77: East Asia Market Volume (Units) Analysis by Country, 2019 to 2034

Figure 78: East Asia Market Value Share (%) and BPS Analysis by Country, 2024 to 2034

Figure 79: East Asia Market Y-o-Y Growth (%) Projections by Country, 2024 to 2034

Figure 80: East Asia Market Value (US$ Million) Analysis by Technology, 2019 to 2034

Figure 81: East Asia Market Volume (Units) Analysis by Technology, 2019 to 2034

Figure 82: East Asia Market Value Share (%) and BPS Analysis by Technology, 2024 to 2034

Figure 83: East Asia Market Y-o-Y Growth (%) Projections by Technology, 2024 to 2034

Figure 84: East Asia Market Value (US$ Million) Analysis by End-user Industry, 2019 to 2034

Figure 85: East Asia Market Volume (Units) Analysis by End-user Industry, 2019 to 2034

Figure 86: East Asia Market Value Share (%) and BPS Analysis by End-user Industry, 2024 to 2034

Figure 87: East Asia Market Y-o-Y Growth (%) Projections by End-user Industry, 2024 to 2034

Figure 88: East Asia Market Attractiveness by Technology, 2024 to 2034

Figure 89: East Asia Market Attractiveness by End-user Industry, 2024 to 2034

Figure 90: East Asia Market Attractiveness by Country, 2024 to 2034

Figure 91: South Asia Market Value (US$ Million) by Technology, 2024 to 2034

Figure 92: South Asia Market Value (US$ Million) by End-user Industry, 2024 to 2034

Figure 93: South Asia Market Value (US$ Million) by Country, 2024 to 2034

Figure 94: South Asia Market Value (US$ Million) Analysis by Country, 2019 to 2034

Figure 95: South Asia Market Volume (Units) Analysis by Country, 2019 to 2034

Figure 96: South Asia Market Value Share (%) and BPS Analysis by Country, 2024 to 2034

Figure 97: South Asia Market Y-o-Y Growth (%) Projections by Country, 2024 to 2034

Figure 98: South Asia Market Value (US$ Million) Analysis by Technology, 2019 to 2034

Figure 99: South Asia Market Volume (Units) Analysis by Technology, 2019 to 2034

Figure 100: South Asia Market Value Share (%) and BPS Analysis by Technology, 2024 to 2034

Figure 101: South Asia Market Y-o-Y Growth (%) Projections by Technology, 2024 to 2034

Figure 102: South Asia Market Value (US$ Million) Analysis by End-user Industry, 2019 to 2034

Figure 103: South Asia Market Volume (Units) Analysis by End-user Industry, 2019 to 2034

Figure 104: South Asia Market Value Share (%) and BPS Analysis by End-user Industry, 2024 to 2034

Figure 105: South Asia Market Y-o-Y Growth (%) Projections by End-user Industry, 2024 to 2034

Figure 106: South Asia Market Attractiveness by Technology, 2024 to 2034

Figure 107: South Asia Market Attractiveness by End-user Industry, 2024 to 2034

Figure 108: South Asia Market Attractiveness by Country, 2024 to 2034

Figure 109: Oceania Market Value (US$ Million) by Technology, 2024 to 2034

Figure 110: Oceania Market Value (US$ Million) by End-user Industry, 2024 to 2034

Figure 111: Oceania Market Value (US$ Million) by Country, 2024 to 2034

Figure 112: Oceania Market Value (US$ Million) Analysis by Country, 2019 to 2034

Figure 113: Oceania Market Volume (Units) Analysis by Country, 2019 to 2034

Figure 114: Oceania Market Value Share (%) and BPS Analysis by Country, 2024 to 2034

Figure 115: Oceania Market Y-o-Y Growth (%) Projections by Country, 2024 to 2034

Figure 116: Oceania Market Value (US$ Million) Analysis by Technology, 2019 to 2034

Figure 117: Oceania Market Volume (Units) Analysis by Technology, 2019 to 2034

Figure 118: Oceania Market Value Share (%) and BPS Analysis by Technology, 2024 to 2034

Figure 119: Oceania Market Y-o-Y Growth (%) Projections by Technology, 2024 to 2034

Figure 120: Oceania Market Value (US$ Million) Analysis by End-user Industry, 2019 to 2034

Figure 121: Oceania Market Volume (Units) Analysis by End-user Industry, 2019 to 2034

Figure 122: Oceania Market Value Share (%) and BPS Analysis by End-user Industry, 2024 to 2034

Figure 123: Oceania Market Y-o-Y Growth (%) Projections by End-user Industry, 2024 to 2034

Figure 124: Oceania Market Attractiveness by Technology, 2024 to 2034

Figure 125: Oceania Market Attractiveness by End-user Industry, 2024 to 2034

Figure 126: Oceania Market Attractiveness by Country, 2024 to 2034

Figure 127: MEA Market Value (US$ Million) by Technology, 2024 to 2034

Figure 128: MEA Market Value (US$ Million) by End-user Industry, 2024 to 2034

Figure 129: MEA Market Value (US$ Million) by Country, 2024 to 2034

Figure 130: MEA Market Value (US$ Million) Analysis by Country, 2019 to 2034

Figure 131: MEA Market Volume (Units) Analysis by Country, 2019 to 2034

Figure 132: MEA Market Value Share (%) and BPS Analysis by Country, 2024 to 2034

Figure 133: MEA Market Y-o-Y Growth (%) Projections by Country, 2024 to 2034

Figure 134: MEA Market Value (US$ Million) Analysis by Technology, 2019 to 2034

Figure 135: MEA Market Volume (Units) Analysis by Technology, 2019 to 2034

Figure 136: MEA Market Value Share (%) and BPS Analysis by Technology, 2024 to 2034

Figure 137: MEA Market Y-o-Y Growth (%) Projections by Technology, 2024 to 2034

Figure 138: MEA Market Value (US$ Million) Analysis by End-user Industry, 2019 to 2034

Figure 139: MEA Market Volume (Units) Analysis by End-user Industry, 2019 to 2034

Figure 140: MEA Market Value Share (%) and BPS Analysis by End-user Industry, 2024 to 2034

Figure 141: MEA Market Y-o-Y Growth (%) Projections by End-user Industry, 2024 to 2034

Figure 142: MEA Market Attractiveness by Technology, 2024 to 2034

Figure 143: MEA Market Attractiveness by End-user Industry, 2024 to 2034

Figure 144: MEA Market Attractiveness by Country, 2024 to 2034

Frequently Asked Questions

What is the anticipated value of the Zero Liquid Discharge System market in 2024?

The zero liquid discharge system market is projected to reach a valuation of USD 7.9 billion in 2024.

What is the expected CAGR for the Zero Liquid Discharge System market until 2034?

The zero liquid discharge system industry is set to expand by a CAGR of 8.7% through 2034.

How much valuation is projected for the Zero Liquid Discharge System market in 2034?

The zero liquid discharge system market is forecast to reach USD 18.1 billion by 2034.

Which country is projected to lead the Zero Liquid Discharge System market?

Korea is expected to be the top performing market, exhibiting a CAGR of 11.1% through 2034.

Which is the dominant technology in the Zero Liquid Discharge System domain?

Thermal based segment is preferred, and is expected to account for a CAGR of 8.5% through 2034.

Explore Similar Insights

Future Market Insights

Zero Liquid Discharge System Market