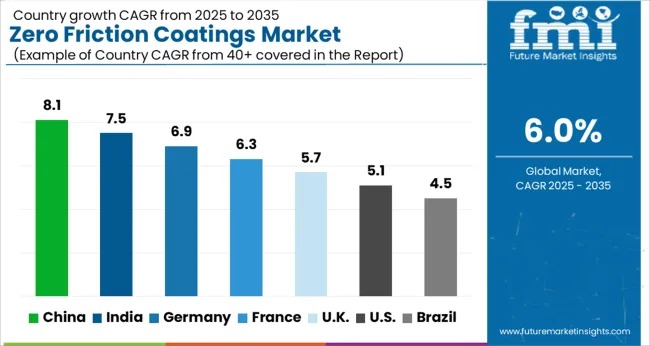
The Zero Friction Coatings Market is estimated to be valued at USD 987.6 million in 2025 and is projected to reach USD 1768.7 million by 2035, registering a compound annual growth rate (CAGR) of 6.0% over the forecast period.
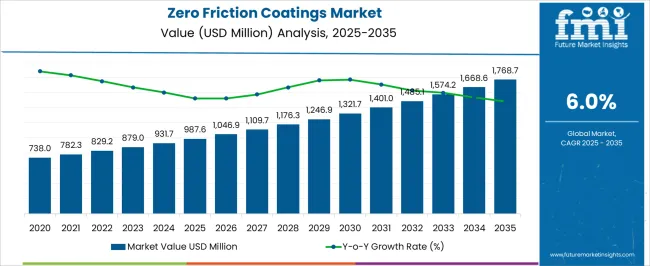
| Metric | Value |
|---|---|
| Zero Friction Coatings Market Estimated Value in (2025 E) | USD 987.6 million |
| Zero Friction Coatings Market Forecast Value in (2035 F) | USD 1768.7 million |
| Forecast CAGR (2025 to 2035) | 6.0% |
The zero friction coatings market is gaining traction due to rising performance demands across automotive, industrial, and aerospace applications where surface efficiency, wear resistance, and energy savings are critical. These coatings enhance mechanical component life by reducing friction, minimizing heat generation, and optimizing lubrication-free operations.
Increasing emphasis on reducing carbon emissions and improving fuel efficiency is pushing automotive and transportation sectors to adopt advanced surface solutions. Additionally, technological advancements in thin-film and dry-lubricant chemistry are allowing these coatings to be tailored for a wide range of substrates and operating environments.
Regulatory encouragement for low emission solutions and demand for cost-effective maintenance in heavy-use industries are further contributing to growth. As OEMs and component manufacturers seek sustainable and high-performance surface technologies, the market for zero friction coatings is poised for consistent expansion driven by material innovation and performance optimization needs.
The market is segmented by Type, Formulation, and End Use and region. By Type, the market is divided into Polytetrafluoroethylene, Molybdenum Disulfide, and Others. In terms of Formulation, the market is classified into Solvent-based Coatings, Water-based Coatings, and Powder Coatings. Based on End Use, the market is segmented into Automobile & Transportation, Aerospace, General Engineering, Food & Healthcare, Energy, and Others. Regionally, the market is classified into North America, Latin America, Western Europe, Eastern Europe, Balkan & Baltic Countries, Russia & Belarus, Central Asia, East Asia, South Asia & Pacific, and the Middle East & Africa.
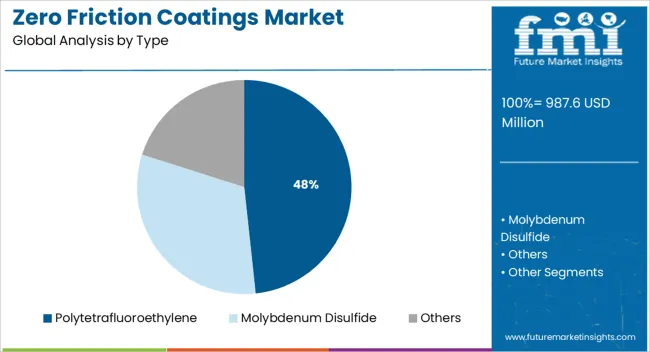
The polytetrafluoroethylene type segment is expected to represent 48.30% of the total market share by 2025, making it the leading material type. This is due to its exceptional nonstick properties, chemical resistance, and low coefficient of friction, which make it suitable for extreme environments and demanding mechanical applications.
Its thermal stability and electrical insulation capabilities further broaden its utility in both industrial machinery and electronic systems. Industries have favored polytetrafluoroethylene for its ability to reduce operational wear and extend equipment lifespan, especially in systems operating under continuous or high-load conditions.
Continued advancements in PTFE dispersion techniques and processing have made it more accessible for diverse industrial applications, reinforcing its dominance within the type segment.
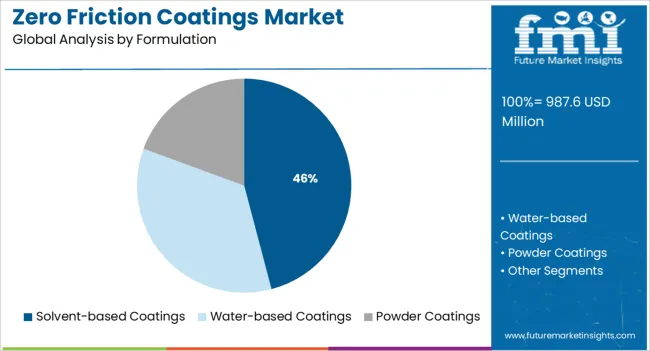
The solvent based coatings segment is projected to contribute 45.90% of the overall market by 2025, positioning it as the leading formulation type. This preference stems from its superior film forming properties, adhesion capabilities, and performance consistency in harsh operational conditions.
Solvent based formulations are particularly suited for applications requiring high durability, temperature tolerance, and resistance to corrosion or abrasion. Industries favor these coatings for their fast drying characteristics and compatibility with metal substrates commonly found in automotive, manufacturing, and aerospace sectors.
As formulation chemistries evolve to meet environmental compliance standards while retaining high performance, solvent based coatings continue to lead in terms of application volume and technical reliability.
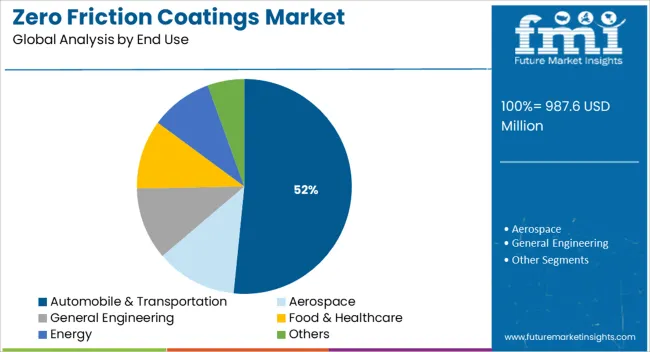
The automobile and transportation segment is anticipated to hold 51.60% of total market share by 2025, establishing it as the most dominant end use category. This segment's growth is fueled by increasing demand for fuel efficiency, emission reduction, and extended vehicle service intervals.
Components such as engine parts, bearings, and drivetrain systems benefit significantly from zero friction coatings by reducing mechanical wear, lowering maintenance needs, and improving operational smoothness. With the global automotive industry undergoing transitions to electric and hybrid platforms, the importance of thermal and friction management technologies has increased.
Moreover, OEMs and tier suppliers are adopting advanced coating technologies to meet performance and durability standards under stringent regulatory frameworks. This sustained adoption across vehicle manufacturing and aftermarket services solidifies the automobile and transportation sector’s leadership within the end use landscape.
The global zero friction coatings market garnered USD 987.6 Million in 2025, expanding at a historical CAGR of 4.6%. The growth is attributed to the expansion in various end-use industries especially the healthcare sector coupled with demand for medical device coatings.
The rising application of PTFE-based low friction coatings as a raw material by the various end-user verticals such as the automobile and transportation industry, aerospace industry, general engineering, food and healthcare, energy, oil and gas, power, and others will also propel growth in the market.
In the years to come, rising industrialization is projected to lead to an increased focus of the manufacturers on the development of new and efficient zero-friction coatings. The estimation reveals that the industry is projected to secure a market value of USD 1,575.59 Million by 2035.
Growing Technological Advancements to Aid Market Growth
Properties of zero friction coatings such as vacuum & radiation resistance, dry and clean lubrication that is not affected by dust, non-flammability, and no oxidation are predicted to foster the product demand over the forecast period.
The ability to improve the properties of surfaces like wettability, corrosion resistance, adhesion, and wear resistance is increasingly popularizing zero friction coatings.
Low friction coatings can also avoid noises thus making them suitable for use on any kind of material. The product improves performance, safety, and reliability by extending lubrication intervals, controlling wear and friction, preventing component failures, and reducing operating and production costs; these coatings are generally applied at 10-20 µm dry film thickness. Zero friction coatings are applied either by dipping, spraying, or using paint drums and centrifuges depending on the nature of the component being treated.
The method of making a zero-friction coating on the metal surface includes various steps such as forming an encapsulated powder that has grains made from a core of solid lubricants that includes at least MoS2 & graphite and a thin shell of fusible soft metal like copper, zinc, nickel, or others.
Further, a coating of uniform thickness of about 25-175 micrometers is then formed. As a result, a low coefficient of friction coating is used to improve the metal cutting and shaping tools.
Limitations on the Use of a Few Compounds to Hinder Market Growth
High friction at low loads and a high coefficient of friction under humidity are likely to act as restraining factors in the market. In addition to this, fluctuation in the prices of raw materials will pose a major challenge to the growth rate. Also, limitations on the use of a few compounds such as perfluorooctanoic acid will further restrict the scope of growth for this market.
Presence of Key in the Region to Increase Consumer Demand
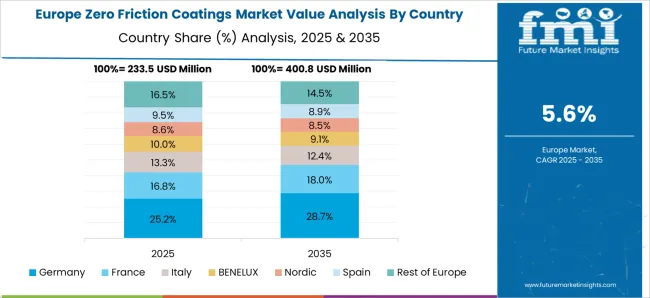
Europe accounted for a revenue share of 16.8% in 2025 and is predicted to witness a CAGR of 5.5% over the forecast period. According to the European Automobile Manufacturers Association, the commercial production of vehicles in Europe grew by 4.9% in 2025 despite supply chain constraints.
The United Kingdom was a leading country in the exports of commercial vehicles from the region in 2025 accounting for a market share of around 29.5%. The automotive sector contributes around 7% of the GDP of the European Union. The growing automobile sector in the country is expected to bolster the demand for zero-friction coatings in the region in the near future. Some of the leading automotive manufacturers in the region include Volkswagen, Daimler, BMW, and Stellantis.
Increasing Investments in Automobile Industry to Boost Regional Market
Asia Pacific dominated the region and accounted for a revenue share of 49.0% in 2025. The growth is attributed to the presence of automotive manufacturing industries in countries such as Japan, South Korea, and China. The Association of Southeast Asian Nations is the seventh largest automotive manufacturing hub across the world and produced around 931.7 million vehicles in 2024.
The region has a presence of some of the leading automotive manufacturers including Honda, Toyota, Ford, BMW, and others. The growing automobile industry in the region is predicted to fuel the demand for zero friction coatings in the predicted years, fuelling the market for ultra-low friction coatings along with anti-friction coating for steel, and low friction coating for plastic.
According to the International Trade Administration, China is the largest automotive market across the globe with domestic production of vehicles expected to reach 987.6 million by 2025. The motor vehicle imports of the country have decreased from 1,246,800 in 2020 to 927,632 in 2024. This is likely to foster the domestic production of vehicles thereby having a positive impact on the market in the coming years.
Molybdenum Disulfide (MoS2) Segment to Dominate the Category
The molybdenum disulfide (MoS2) segment dominated the market with a revenue share of over 50% in 2025. The growth is attributed to properties such as high load-carrying capacity and excellent adhesion. MoS2 is a dry film lubricant that prevents galling, fretting, and seizing to extend the wear life when operating at temperatures in the range of -350°F and +500°F. The coefficient of friction of this type of coating is 0.07. MoS2 coating solution is used for critical equipment and parts and is widely used in corrosion management as it is unreactive to most corrosive agents.
Polytetrafluoroethylene (PTFE) was the second-largest segment and accounted for a revenue share of over 30% in 2025 and is predicted to witness a CAGR of 5.4% in the coming years. The growth is attributed to its properties such as high dielectric strength, heat tolerance, non-sticks, and chemical resistance. The temperature tolerance of PTFE ranges from -518°F to 599°F thus making it suitable for use in bakeware applications. The carbon-fluorine bonds of PTFE are extremely flexible and non-reactive which makes it an excellent electrical insulator. These coatings find applications in the medical field in the manufacturing of medications, in the tech sector for producing high-tech parts and tools, and in other industrial applications.
The solvent Based Segment Leads the Formulation Segment and is Projected to Dominate the Market
The solvent-based segment dominated the market and accounted for a revenue share of over 40% in 2025. The growth is attributed to the less susceptibility of these coatings to environmental conditions including humidity and temperature during the curing phase.
The water-based coating was the second-largest segment and accounted for a revenue share of over 35.0% in 2025 and is predicted to witness a CAGR of 6.1% in the coming years. The growth is attributed to low volatile organic compound (VOC) content, resilience against accelerated aging exposures, and the ability to be pigmented. It also shows lower friction along with extended weathering.
The automobile and Transportation Segment is Projected to Dominate the Market
The automobile and transportation segment dominated the market and accounted for a revenue share of 35.0% in 2025. This is attributed to their ability to reduce noise making them ideal for automotive applications where they are used to reduce cabin noise which is a priority in cars these days. The growing sales of automobiles across the globe coupled with the rising adoption of electric vehicles are anticipated to drive the growth of the automotive industry which in turn is likely to have a positive impact on the zero friction coatings market.
Food and healthcare was the second-largest segment and accounted for a revenue share of 20.0% in 2025. The growth is attributed due to the increased need for coatings for parts used on food packaging and processing equipment for providing non-stick, wear-resistant, and non-wetting surfaces. In the healthcare sector, low-friction coatings are used in analytical and surgical instrumentation, autoclave and sterilization equipment, and packaging of pharmaceutical products.
The energy segment accounted for a revenue share of 17.0% in 2025 and is expected to witness a CAGR of 5.7% in the predicted years. The growth is attributed to the exposure of materials to extremely harsh environments in the oil and gas industry. Properties of the product including temperature resistance, corrosion resistance, UV protection, chemical protection, and others are likely to foster its demand in the energy sector over the forecast period.
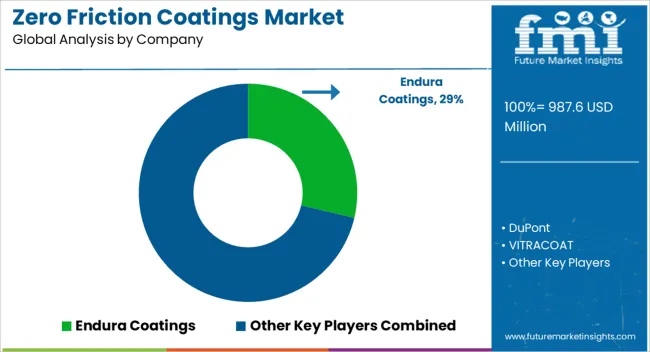
The players in the market are focusing to increase their global influence and adopt strategies such as; acquisition, collaboration, and partnerships. Key players in the market include Endura Coatings; DuPont; VITRACOAT; Poeton; Bechem; ASV Multichemie Private Limited; GMM Coatings Private Limited; and IKV Tribology Ltd. Some of the recent key developments among key players are:
| Report Attributes | Details |
|---|---|
| Estimated Market Value in 2025 | USD 987.6 million |
| Estimated Market Value in 2035 | USD 1768.7 million |
| Projected Growth Rate | CAGR of 6% from 2025 to 2035 |
| Forecast Period | 2025 to 2035 |
| Historical Data available for | 2020 to 2025 |
| Key Regions Covered | North America; Latin America; Europe; Asia Pacific; Middle East & Africa |
| Key Countries Covered | USA, Canada, Brazil, Mexico, Germany, United Kingdom, France, Spain, Italy, Indonesia, Singapore, Thailand, China, Japan, South Korea, Australia, New Zealand, GCC Countries, South Africa, Israel |
| Key Segments Covered | Type, Formulation, End-Use, Region |
| Key Companies Profiled | Endura Coatings; DuPont; VITRACOAT; Poeton; Bechem; ASV Multichemie Private Limited; GMM Coatings Private Limited; IKV Tribology Ltd.; Dow Corning; Whitmore Manufacturing |
| Pricing | Available upon Request |
The global zero friction coatings market is estimated to be valued at USD 987.6 million in 2025.
The market size for the zero friction coatings market is projected to reach USD 1,768.7 million by 2035.
The zero friction coatings market is expected to grow at a 6.0% CAGR between 2025 and 2035.
The key product types in zero friction coatings market are polytetrafluoroethylene, molybdenum disulfide and others.
In terms of formulation, solvent-based coatings segment to command 45.9% share in the zero friction coatings market in 2025.


Our Research Products

The "Full Research Suite" delivers actionable market intel, deep dives on markets or technologies, so clients act faster, cut risk, and unlock growth.

The Leaderboard benchmarks and ranks top vendors, classifying them as Established Leaders, Leading Challengers, or Disruptors & Challengers.

Locates where complements amplify value and substitutes erode it, forecasting net impact by horizon

We deliver granular, decision-grade intel: market sizing, 5-year forecasts, pricing, adoption, usage, revenue, and operational KPIs—plus competitor tracking, regulation, and value chains—across 60 countries broadly.

Spot the shifts before they hit your P&L. We track inflection points, adoption curves, pricing moves, and ecosystem plays to show where demand is heading, why it is changing, and what to do next across high-growth markets and disruptive tech

Real-time reads of user behavior. We track shifting priorities, perceptions of today’s and next-gen services, and provider experience, then pace how fast tech moves from trial to adoption, blending buyer, consumer, and channel inputs with social signals (#WhySwitch, #UX).

Partner with our analyst team to build a custom report designed around your business priorities. From analysing market trends to assessing competitors or crafting bespoke datasets, we tailor insights to your needs.
Supplier Intelligence
Discovery & Profiling
Capacity & Footprint
Performance & Risk
Compliance & Governance
Commercial Readiness
Who Supplies Whom
Scorecards & Shortlists
Playbooks & Docs
Category Intelligence
Definition & Scope
Demand & Use Cases
Cost Drivers
Market Structure
Supply Chain Map
Trade & Policy
Operating Norms
Deliverables
Buyer Intelligence
Account Basics
Spend & Scope
Procurement Model
Vendor Requirements
Terms & Policies
Entry Strategy
Pain Points & Triggers
Outputs
Pricing Analysis
Benchmarks
Trends
Should-Cost
Indexation
Landed Cost
Commercial Terms
Deliverables
Brand Analysis
Positioning & Value Prop
Share & Presence
Customer Evidence
Go-to-Market
Digital & Reputation
Compliance & Trust
KPIs & Gaps
Outputs
Full Research Suite comprises of:
Market outlook & trends analysis
Interviews & case studies
Strategic recommendations
Vendor profiles & capabilities analysis
5-year forecasts
8 regions and 60+ country-level data splits
Market segment data splits
12 months of continuous data updates
DELIVERED AS:
PDF EXCEL ONLINE
Zero Liquid Discharge System Market Size and Share Forecast Outlook 2025 to 2035
Zero-Waste Packaging Technologies Market Size and Share Forecast Outlook 2025 to 2035
Zero Emission Aircraft Market Size and Share Forecast Outlook 2025 to 2035
Zero-Waste Refill Packaging Market Analysis - Size, Share, and Forecast Outlook 2025 to 2035
Zero-Fishmeal Feed Market Analysis - Size and Share Forecast Outlook 2025 to 2035
Zero Trust Security Market Size and Share Forecast Outlook 2025 to 2035
Zero Emission Vehicle Market Growth - Trends & Forecast 2025 to 2035
Zero-Touch Provisioning (ZTP) Market - Growth & Demand 2025 to 2035
Zero Calorie Chips Market Outlook - Growth, Demand & Forecast 2025 to 2035
Zero Sugar Beverages Market Analysis by Product Type and Sales Channel Through 2035
Zero-Waste Packaging Market Report – Sustainable Growth & Trends 2023-2033
Africa’s Zero Liquid Discharge System Market - Size, Share, and Forecast 2025 to 2035
Nanoscale Zero-Valent Iron Market Size and Share Forecast Outlook 2025 to 2035
Friction Roller Conveyor Market Size and Share Forecast Outlook 2025 to 2035
Friction Pendulum Bearings Market Size and Share Forecast Outlook 2025 to 2035
Frictionless Remote Monitoring Devices Market Size and Share Forecast Outlook 2025 to 2035
Friction Modifiers Market Size and Share Forecast Outlook 2025 to 2035
Friction Tape Market Analysis Size and Share Forecast Outlook 2025 to 2035
Friction Modifier Additives Market Trends 2025 to 2035
High Friction Films Market Size and Share Forecast Outlook 2025 to 2035

Thank you!
You will receive an email from our Business Development Manager. Please be sure to check your SPAM/JUNK folder too.
Chat With
MaRIA