Reports

- Global Locations -

Headquarters

Future Market Insights, Inc.

Christiana Corporate, 200
Continental Drive, Suite 401,
Newark, Delaware - 19713,
United States

T: +1-845-579-5705

Americas

Future Market Insights, Inc.

616 Corporate Way, Suite 2-9018,
Valley Cottage, NY 10989, United States

T: +1-347-918-3531

MEA

Future Market Insights

1602-6 Jumeirah Bay X2 Tower, Plot No: JLT-PH2-X2A,
Jumeirah Lakes Towers, Dubai,
United Arab Emirates

Europe

Future Market Insights

3rd Floor, 207 Regent Street,
W1B 3HH London
United Kingdom

T: + 44 (0) 20 8123 9659
D: +44 (0) 20 3287 4268

Asia Pacific

Future Market Insights

IndiaLand Global Tech Park, Unit UG-1, Behind Grand HighStreet, Phase 1, Hinjawadi, MH, Pune – 411057, India

Agricultural Adjuvant Market Outlook (2023 to 2033)

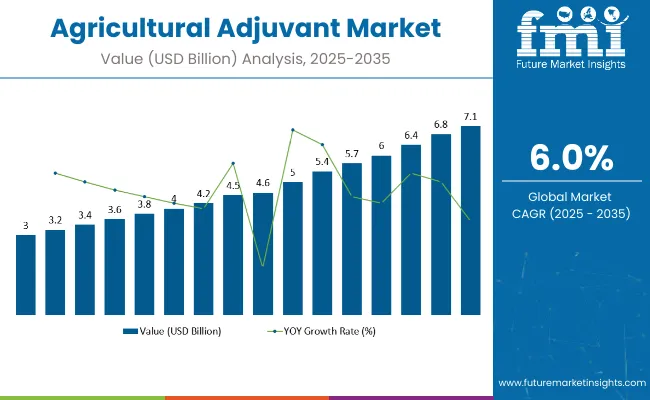
The global agricultural adjuvant market size is expected to reach a market valuation of US$ 6,518.4 million by 2033. The market is projected to expand at 6% CAGR over the forecast period. In 2023, the market is expected to expand to US$ 3,536 million.

As per FMI, the agricultural adjuvant market accounted for 5% of the total crop protection chemical market in 2022. The sales witnessed rapid growth as the inclination towards the use of new-age technology gained momentum.

Agricultural adjuvant reduces crop damage and increases production which is expected to spur demand in the market. FMI analysis indicates that utility adjuvants are expected to account for nearly 3/5th of sales in the global market in 2023. These adjuvants are added to the spray solution in the tank to improve its spray mechanism and minimize the amount of spray solution that drifts off-target.

Drivers Helping the Market Generate Higher Yield:

  • Increasing demand for better agricultural productivity to cater to surging food demand has led to a surge in the deployment of crop protection chemicals. This, in turn, has led to market growth.
  • Growing emphasis to drive better efficiency of crop protection chemicals in different climatic conditions. As a result, necessitates the requirement for new innovations for the adjuvants used in them.
  • Heightened awareness regarding the potential implications of the profuse use of pesticides on the environment has garnered high attention in the last decade. Thus, fueling the market growth.
  • Surge in the contamination of water bodies due to the drift of spray drops has led to increased adoption of agricultural adjuvant.
  • Spray-mix incompatibilities due to the combination of one or more agrochemicals are projected to push the demand for various adjuvants products.

Trends Influencing the Agricultural Adjuvant Industry:

  • Surging proclivity towards eco-friendly agricultural adjuvants is projected to propel market growth. In line with this, the heightened utilization of biological products is also supporting market growth.
  • Strict regulations for the production of GMO crops in regions like Europe, North America, and the Asia Pacific.
  • Heightened demand for sustainable pest management during agricultural operations in developed economies.
Attributes Details
Agricultural Adjuvant Market Size (2018) US$ 3,063.6 million
Agricultural Adjuvant Market Size (2022) US$ 3,400 million
Agricultural Adjuvant Market Size (2023) US$ 3,536 million
Agricultural Adjuvant Market Projected Size (2033) US$ 6,518.4 million
Agricultural Adjuvant Market Value-based CAGR (2023 to 2033) 6%
Agricultural Adjuvant Market Top 3 Countries Share 35%

Don't pay for what you don't need

Customize your report by selecting specific countries or regions and save 30%!

How are Advancements in Adjuvant Technology Influencing Sales?

Increasing technological advancements in the adjuvants industry are encouraging developments in the agriculture and crop protection market. Developments in biotechnology, advancement in farming practices, and change in the structuring of fertilizer companies are some factors propelling sales of agricultural adjuvants.

Manufacturers are focusing on developing formulations with new functions that mimic changes in crop protection formulations. Modernization of adjuvant technology that is more specific to certain crops is expected to boost the demand for agricultural adjuvant.

Many regulations across several countries are also affecting the growth of the market. For instance, in the United States, states like Washington and California need the adjuvants to be registered before the sale.

The Council of Producers & Distributors of Agrotechnology (CPDA) certifies adjuvants. CPDA is an organization of inert (or other) ingredient and adjuvant manufacturers that approves adjuvants. This is done so by creating certain minimum standards that must be fulfilled to get the CPDA stamp of certification.

Surface tension, volatility, solubility, droplet size, and penetration are some properties of pesticides that often affect the crop’s quality and cause huge losses to farmers due to the waste of crops.

The uses of agricultural adjuvants in pesticides overcome these shortcomings and enhance the effectiveness of pesticides sprayed on crops. The use of agricultural adjuvant also limits the wastage of pesticides and maximizes yield.

2018 to 2022 Agricultural Adjuvant Market Historic Outlook Vs Forecast for 2023 to 2033

Over the forecast period, the market is perceived to expand at a 6% CAGR. The market is projected to attain US$ 6,518.4 million by 2033, up from US$ 3,536 million in 2023.

From 2018 to 2022, the market grew at 2.6% CAGR. The market is projected to rise from US$ 3,063.6 million in 2018, to US$ 3,400 million in 2022.

The agricultural sector is going through a transition phase, where farmers are modernizing all the processes. Companies are investing heavily in research and development activities to improve crop yield to fulfill the surging demand for food. As a result, agricultural adjuvants are being adopted to improve the performance of pesticides sprayed on the crop to improve yield.

The use of chemical preservatives adversely affects soil quality and the environment. Rising awareness regarding chemical pesticides that have harmful effects on the human body is expected to boost the sale of organic adjuvants. These adjuvants eliminate the use of chemical formulations.

Manufacturers are focusing on improving the efficiency of agrochemicals to improve sales. Consumer's inclination towards organic food products has increased in multitude. This, in turn, is expected to boost the sale of organic agriculture adjuvants during the assessment period.

Nandini Roy Choudhury

Principal Consultant

Talk to Analyst

Find your sweet spots for generating winning opportunities in this market.

Comparative Analysis of Adjacent Markets

Agricultural Adjuvant Market:

Differentiating Aspects Agricultural Adjuvant Market
CAGR (Forecast Period) 6%
Market Valuation in 2023 US$ 3,536 million
Projected Market Value by 2033 US$ 6,518.4 million
Growth Factors Growing requirement for food crops
Trends Increasing popularity of silicone adjuvants
Opportunities Surging research studies to drive efficacy of agricultural adjuvant

Vaccine Adjuvant Market:

Differentiating Aspects Vaccine Adjuvant Market
CAGR (Forecast Period) 2%
Market Valuation in 2023 US$ 1.53 billion
Projected Market Value by 2033 US$ 1.87 billion
Growth Factors Growing pervasiveness of infectious diseases
Trends Surge in funds for research studies for infectious diseases and their vaccines
Opportunities Increasing partnerships and collaborations between market players to develop vaccine adjuvants

Agricultural Enzymes Market:

Differentiating Aspects Agricultural Enzymes Market
CAGR (Forecast Period) 10%
Market Valuation in 2023 US$ 440 million
Projected Market Value by 2033 US$ 1,141.25 million
Growth Factors Increasing awareness regarding biological agricultural goods among consumers
Trends Soaring demand for chemical-free goods to meet the increased global demand for food safety
Opportunities Rise in advertising initiatives by agricultural enzymes to drive sales

Country-wise Insights

Value CAGR (2023 to 2033):

Countries CAGR (2023 to 2033)
United Kingdom 8%
China 8.7%
India 6.7%

2022 Value share in Global Market:

Country/ Region Value Share (2022)
The United States 16.1%
Germany 8%
Japan 3%
Australia 0.7%

How is the United States Agricultural Adjuvant Market Faring?

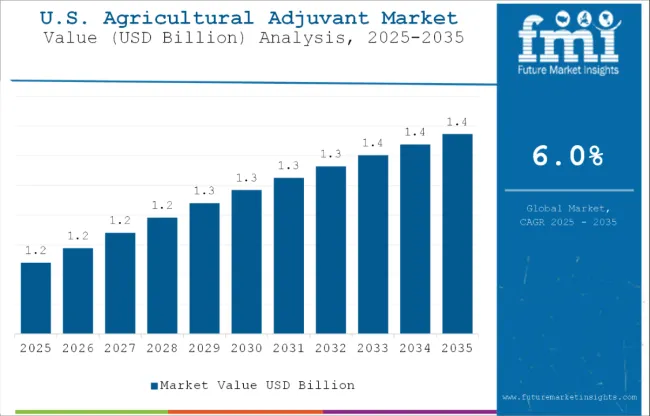
Farmers in the United States are adopting agricultural spray adjuvants to improve crop production. In 2022, the country attained a 16.1% market share of the global agricultural adjuvant market.

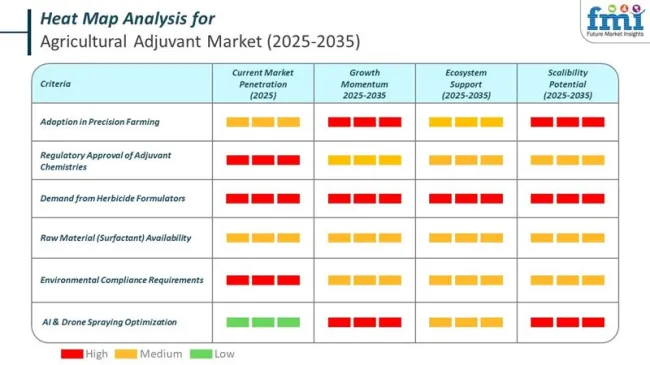
The United States is expected to emerge as a lucrative market owing to the increasing adoption of advanced agricultural practices. To increase production, farmers are undertaking precision farming using advanced crop technologies. This is expected to positively impact the demand for agricultural adjuvants, which enhances the effectiveness of chemicals sprayed on crops for better yield.

Investments in next-generation technologies aimed at introducing agricultural adjuvants that fulfill changing needs and unique requirements of modern agricultural operations are expected to spur demand in the market. As per FMI, the United States agriculture adjuvant market was valued at US$ 986 million in 2022.

Why is China Agricultural Adjuvant Market Considered Lucrative?

The growing adoption of adjuvant farming in China is projected to fuel market growth. Over the forecast period, the market is projected to expand at 8.7% CAGR.

The Asia Pacific is expected to create lucrative opportunities for the agriculture adjuvant market during the assessment year as it comprises vast agricultural land for cultivation. Industrialization has resulted in the reduction of cultivable land so farmers are on the lookout for chemical pesticides that are expected to ensure higher yields from small land sizes.

This is expected to boost sales in developing countries like China. Chinese farmers are pivoting towards technologically advanced practices to fulfill the high demand for food crops for local usage and exports.

What is the United Kingdom Agricultural Adjuvant Market Outlook?

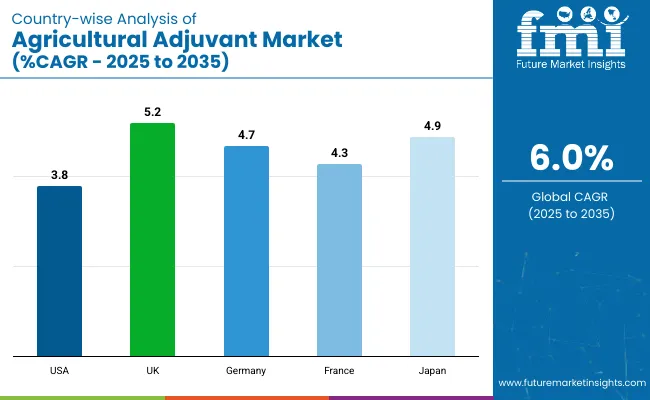
Surging demand for agricultural silicone adjuvants in the United Kingdom is projected to boost sales. As per FMI, the regional market is expected to register 8% CAGR over the forecast period.

Growing adoption of advanced technologies in the agriculture sector is expected to impact the sale of agricultural adjuvant in Europe during the forecast period. Key countries contributing to sales in the Europe agricultural adjuvant market are Germany and the United Kingdom.

Regional farmers are using GPS systems, variable-rate application technologies, and a variety of unmanned aerial vehicle (UAV) agricultural software. Precision farming is also gaining traction due to increased efficiency and good-quality agricultural output.

Surging adoption of precision farming is expected to boost the sale of agricultural adjuvants in the United Kingdom in the forthcoming years.

Get the data you need at a Fraction of the cost

Personalize your report by choosing insights you need
and save 40%!

Category-wise Insights

Which Segment is Projected to be the Top-selling Crop Type?

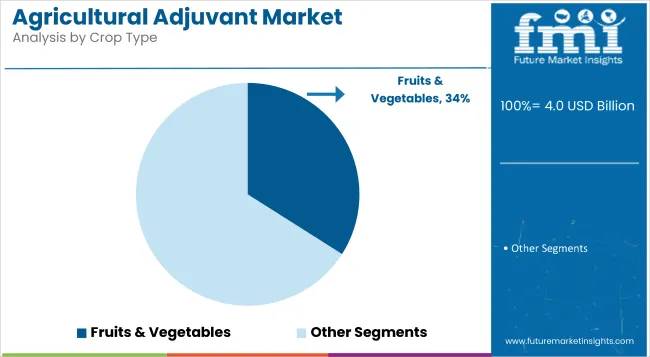
Based on the crop type, sales in the cereals segment are projected to account for almost 31.9% of the total agricultural adjuvant market share. A surging population and increasing consumer preference for healthy and nutritious food are projected to boost the demand for crop protection chemicals.

Increasing sales of packaged food products is also pushing sales of agricultural adjuvants for cereals. This segment is also expected to register an incremental growth of 2x during the forecast period.

Category Crop Type
Top Segment Cereals
Market Share 31.90%

Increasing Focus on Crop Protection is Propelling Sales of Herbicide Adjuvants

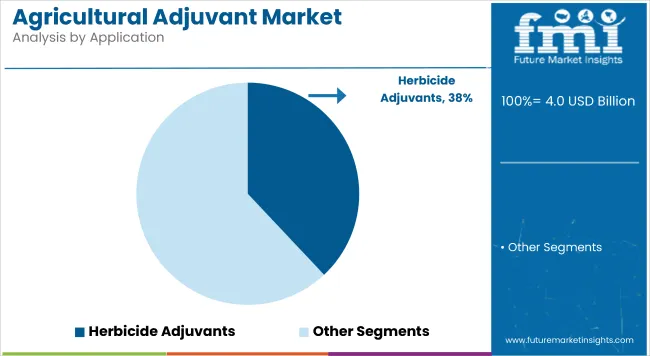
In terms of applications, the herbicide adjuvant segment is expected to account for a significant market share by 2033. The main problem faced by farmers is the growth of unwanted plants like weeds, and intrusive vegetation that absorbs useful nutrients from soil and damage seeds. Besides this, surging demand for grain crops worldwide is expected to boost sales in this segment over the forecast period.

Activator Adjuvants to Garner Maximum Market Share

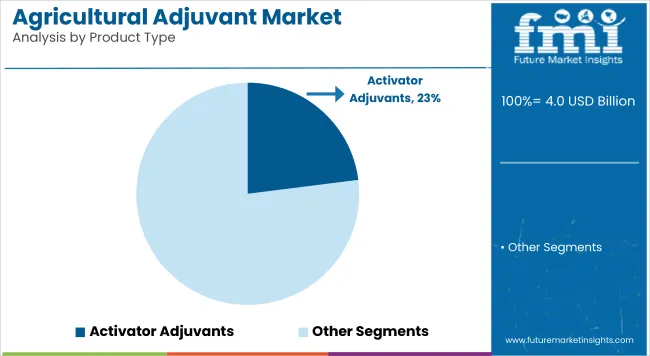
The activator adjuvants segment accounted for 34% market share in 2022. Surging demand for sustainable pesticides in developed countries like America and of Europe is propelling the market growth. The increasing deployment of crop protection chemicals in developing economies is pushing the demand for agricultural adjuvants. Growing demand for tools that help drive crop efficiency is expected to assist in the agricultural activator adjuvants market growth.

Use of surfactants in activator adjuvants is expected to be wide due to their relatively less cost and easy availability.

Category Product Type
Top Segment Activator Adjuvants
Market Share 34%

Agricultural Adjuvants Market Competitive Landscape

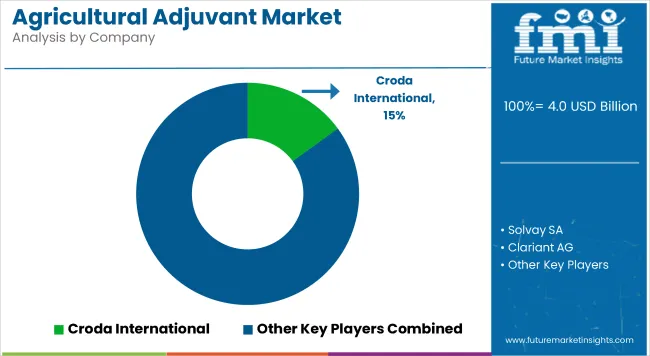
The competition in the agricultural adjuvants industry is intensifying. This can be attributed to the surging presence of several independent large- and small-scale manufacturers and suppliers. The small-scale players are mainly competing on the basis of price. The large-scale conglomerates are alternatively focusing on product development and innovation.

Market participants are entering partnerships and mergers to establish their market position. For instance, BASF obtained multiple assets and businesses from Bayer, which is an agricultural products manufacturer.

Agriculture adjuvant manufacturers are exploring new product development that fulfills consumer requirements. Additionally, manufacturers are tapping into consumer preference for sustainable products. By doing so, they can stand apart from the competition.

New Market Developments:

  • In April 2022, the Lamberti SPA obtained the United Kingdom-based Turftech International. The latter is a leading company that develops and sells special surfactants to be applied in turf and horticulture. The company is extending its product portfolio and market share in Europe via this acquisition.
  • In March 2020, Wilbur-Ellis Company Inc., a global leading distributor of agricultural supplies, animal nutrition, and specialty chemicals, introduced EMBRECE-EA. This is a new line of nonionic surfactants with a patented composition (NIS). The novel surfactant improves the efficacy of insecticides, and fungicides, by improving the spreading, and wetting of spray ingredients used in agricultural practices.

Manufacturers in the Agricultural Adjuvants are:

  • Brandt Consolidated
  • Lamberti SPA
  • Winfield Solutions, Llc
  • Dow Croning
  • Wilbur-Ellis Holdings, Inc.
  • Helena Chemical Company
  • Clariant International Ltd.
  • Croda Chemicals
  • Tanatex Chemicals
  • Momentive Performance Materials
  • Solvay SA
  • Adjuvant plus Inc.

Scope Of the Report

Attribute Details
Forecast Period 2023 to 2033
Historical Data Available for 2018 to 2022
Market Analysis US$ million for Value
Key Regions Covered North America, Latin America, Europe, East Asia, South Asia, Oceania, and the Middle East & Africa
Key Countries Covered The United States, Brazil, Mexico, Germany, the United Kingdom, China, India, Japan, Australia, and GCC Countries
Key Segments Covered Product Type, Application, Crop Type, and Region
Key Companies Profiled
  • Brandt Consolidated
  • Lamberti SPA
  • Winfield Solutions, Llc
  • Dow Croning
  • Wilbur-Ellis Holdings, Inc.
  • Helena Chemical Company
  • Clariant International Ltd.
  • Croda Chemicals
  • Tanatex Chemicals
  • Momentive Performance Materials
  • Solvay SA
  • Adjuvant Plus Inc.
Report Coverage Market Forecast, Company Share Analysis, Competition Intelligence, DROT Analysis, Market Dynamics and Challenges, and Strategic Growth Initiatives
Customization & Pricing Available upon Request

Agricultural Adjuvant Market by Category

By Product Type:

  • Activator Adjuvants
  • Oil Adjuvants
  • Surfactants
  • Utility Adjuvants

By Application:

  • Fungicide Adjuvants
  • Insecticide Adjuvants
  • Herbicide Adjuvants
  • Others

By Crop Type:

  • Cereals
  • Oilseeds
  • Fruits & Vegetables
  • Other Crops

By Region:

  • North America
  • Latin America
  • Europe
  • East Asia
  • South Asia
  • Oceania
  • Middle East Africa

Frequently Asked Questions

What is the Agricultural Adjuvant Market Size?

The agricultural adjuvant market size reaches US$ 3,536 million in 2023.

What Size is the Agricultural Adjuvant Market Expected to Reach by 2033?

The agricultural adjuvant market is set to surge at a robust 6% CAGR, reaching a noteworthy valuation of US$ 6,518.4 million by 2033.

What was the Agricultural Adjuvant Market's Past Record like?

Experiencing a 2.6% CAGR between 2018 and 2022, the agricultural adjuvant market expanded from US$ 3,063.6 million in 2018 to US$ 3,400 million in 2022.

Which Country Shows Promising Profitability for Agricultural Adjuvant?

The United States, with advanced farming practices and technology, holds promising profitability in the agricultural adjuvant market.

Which Segment could Generate the Maximum Revenue in the Agricultural Adjuvant Market Based on Services?

The cereals segment is likely to demonstrate significant expansion, obtaining 31.9% of the total agricultural adjuvant market revenue.

Table of Content

1. Executive Summary | Agricultural Adjuvant Market

    1.1. Global Market Outlook

    1.2. Demand-side Trends

    1.3. Supply-side Trends

    1.4. Technology Roadmap Analysis

    1.5. Analysis and Recommendations

2. Market Overview

    2.1. Market Coverage / Taxonomy

    2.2. Market Definition / Scope / Limitations

3. Market Background

    3.1. Market Dynamics

        3.1.1. Drivers

        3.1.2. Restraints

        3.1.3. Opportunity

        3.1.4. Trends

    3.2. Scenario Forecast

        3.2.1. Demand in Optimistic Scenario

        3.2.2. Demand in Likely Scenario

        3.2.3. Demand in Conservative Scenario

    3.3. Opportunity Map Analysis

    3.4. Product Life Cycle Analysis

    3.5. Supply Chain Analysis

        3.5.1. Supply Side Participants and their Roles

            3.5.1.1. Producers

            3.5.1.2. Mid-Level Participants (Traders/ Agents/ Brokers)

            3.5.1.3. Wholesalers and Distributors

        3.5.2. Value Added and Value Created at Node in the Supply Chain

        3.5.3. List of Raw Material Suppliers

        3.5.4. List of Existing and Potential Buyer’s

    3.6. Investment Feasibility Matrix

    3.7. Value Chain Analysis

        3.7.1. Profit Margin Analysis

        3.7.2. Wholesalers and Distributors

        3.7.3. Retailers

    3.8. PESTLE and Porter’s Analysis

    3.9. Regulatory Landscape

        3.9.1. By Key Regions

        3.9.2. By Key Countries

    3.10. Regional Parent Market Outlook

    3.11. Production and Consumption Statistics

    3.12. Import and Export Statistics

4. Global Market Analysis 2018 to 2022 and Forecast, 2023 to 2033

    4.1. Historical Market Size Value (US$ Million) & Volume (MT) Analysis, 2018 to 2022

    4.2. Current and Future Market Size Value (US$ Million) & Volume (MT) Projections, 2023 to 2033

        4.2.1. Y-o-Y Growth Trend Analysis

        4.2.2. Absolute $ Opportunity Analysis

5. Global Market Analysis 2018 to 2022 and Forecast 2023 to 2033, By Product Type

    5.1. Introduction / Key Findings

    5.2. Historical Market Size Value (US$ Million) & Volume (MT) Analysis By Product Type, 2018 to 2022

    5.3. Current and Future Market Size Value (US$ Million) & Volume (MT) Analysis and Forecast By Product Type, 2023 to 2033

        5.3.1. Activator Adjuvants

        5.3.2. Oil Adjuvants

        5.3.3. Surfactants

        5.3.4. Utility Adjuvants

    5.4. Y-o-Y Growth Trend Analysis By Product Type, 2018 to 2022

    5.5. Absolute $ Opportunity Analysis By Product Type, 2023 to 2033

6. Global Market Analysis 2018 to 2022 and Forecast 2023 to 2033, By Application

    6.1. Introduction / Key Findings

    6.2. Historical Market Size Value (US$ Million) & Volume (MT) Analysis By Application, 2018 to 2022

    6.3. Current and Future Market Size Value (US$ Million) & Volume (MT) Analysis and Forecast By Application, 2023 to 2033

        6.3.1. Fungicide Adjuvants

        6.3.2. Insecticide Adjuvants

        6.3.3. Herbicide Adjuvants

        6.3.4. Other Applications

    6.4. Y-o-Y Growth Trend Analysis By Application, 2018 to 2022

    6.5. Absolute $ Opportunity Analysis By Application, 2023 to 2033

7. Global Market Analysis 2018 to 2022 and Forecast 2023 to 2033, By Crop Type

    7.1. Introduction / Key Findings

    7.2. Historical Market Size Value (US$ Million) & Volume (MT) Analysis By Crop Type, 2018 to 2022

    7.3. Current and Future Market Size Value (US$ Million) & Volume (MT) Analysis and Forecast By Crop Type, 2023 to 2033

        7.3.1. Cereals

        7.3.2. Oilseeds

        7.3.3. Fruits & Vegetables

        7.3.4. Other Crops

    7.4. Y-o-Y Growth Trend Analysis By Crop Type, 2018 to 2022

    7.5. Absolute $ Opportunity Analysis By Crop Type, 2023 to 2033

8. Global Market Analysis 2018 to 2022 and Forecast 2023 to 2033, By Region

    8.1. Introduction

    8.2. Historical Market Size Value (US$ Million) & Volume (MT) Analysis By Region, 2018 to 2022

    8.3. Current Market Size Value (US$ Million) & Volume (MT) Analysis and Forecast By Region, 2023 to 2033

        8.3.1. North America

        8.3.2. Latin America

        8.3.3. Europe

        8.3.4. Asia Pacific

        8.3.5. MEA

    8.4. Market Attractiveness Analysis By Region

9. North America Market Analysis 2018 to 2022 and Forecast 2023 to 2033, By Country

    9.1. Historical Market Size Value (US$ Million) & Volume (MT) Trend Analysis By Market Taxonomy, 2018 to 2022

    9.2. Market Size Value (US$ Million) & Volume (MT) Forecast By Market Taxonomy, 2023 to 2033

        9.2.1. By Country

            9.2.1.1. U.S.

            9.2.1.2. Canada

        9.2.2. By Product Type

        9.2.3. By Application

        9.2.4. By Crop Type

    9.3. Market Attractiveness Analysis

        9.3.1. By Country

        9.3.2. By Product Type

        9.3.3. By Application

        9.3.4. By Crop Type

    9.4. Key Takeaways

10. Latin America Market Analysis 2018 to 2022 and Forecast 2023 to 2033, By Country

    10.1. Historical Market Size Value (US$ Million) & Volume (MT) Trend Analysis By Market Taxonomy, 2018 to 2022

    10.2. Market Size Value (US$ Million) & Volume (MT) Forecast By Market Taxonomy, 2023 to 2033

        10.2.1. By Country

            10.2.1.1. Brazil

            10.2.1.2. Mexico

            10.2.1.3. Rest of Latin America

        10.2.2. By Product Type

        10.2.3. By Application

        10.2.4. By Crop Type

    10.3. Market Attractiveness Analysis

        10.3.1. By Country

        10.3.2. By Product Type

        10.3.3. By Application

        10.3.4. By Crop Type

    10.4. Key Takeaways

11. Europe Market Analysis 2018 to 2022 and Forecast 2023 to 2033, By Country

    11.1. Historical Market Size Value (US$ Million) & Volume (MT) Trend Analysis By Market Taxonomy, 2018 to 2022

    11.2. Market Size Value (US$ Million) & Volume (MT) Forecast By Market Taxonomy, 2023 to 2033

        11.2.1. By Country

            11.2.1.1. Germany

            11.2.1.2. U.K.

            11.2.1.3. France

            11.2.1.4. Spain

            11.2.1.5. Italy

            11.2.1.6. Rest of Europe

        11.2.2. By Product Type

        11.2.3. By Application

        11.2.4. By Crop Type

    11.3. Market Attractiveness Analysis

        11.3.1. By Country

        11.3.2. By Product Type

        11.3.3. By Application

        11.3.4. By Crop Type

    11.4. Key Takeaways

12. Asia Pacific Market Analysis 2018 to 2022 and Forecast 2023 to 2033, By Country

    12.1. Historical Market Size Value (US$ Million) & Volume (MT) Trend Analysis By Market Taxonomy, 2018 to 2022

    12.2. Market Size Value (US$ Million) & Volume (MT) Forecast By Market Taxonomy, 2023 to 2033

        12.2.1. By Country

            12.2.1.1. China

            12.2.1.2. Japan

            12.2.1.3. South Korea

            12.2.1.4. Singapore

            12.2.1.5. Thailand

            12.2.1.6. Indonesia

            12.2.1.7. Australia

            12.2.1.8. New Zealand

            12.2.1.9. Rest of Asia Pacific

        12.2.2. By Product Type

        12.2.3. By Application

        12.2.4. By Crop Type

    12.3. Market Attractiveness Analysis

        12.3.1. By Country

        12.3.2. By Product Type

        12.3.3. By Application

        12.3.4. By Crop Type

    12.4. Key Takeaways

13. MEA Market Analysis 2018 to 2022 and Forecast 2023 to 2033, By Country

    13.1. Historical Market Size Value (US$ Million) & Volume (MT) Trend Analysis By Market Taxonomy, 2018 to 2022

    13.2. Market Size Value (US$ Million) & Volume (MT) Forecast By Market Taxonomy, 2023 to 2033

        13.2.1. By Country

            13.2.1.1. GCC Countries

            13.2.1.2. South Africa

            13.2.1.3. Israel

            13.2.1.4. Rest of MEA

        13.2.2. By Product Type

        13.2.3. By Application

        13.2.4. By Crop Type

    13.3. Market Attractiveness Analysis

        13.3.1. By Country

        13.3.2. By Product Type

        13.3.3. By Application

        13.3.4. By Crop Type

    13.4. Key Takeaways

14. Key Countries Market Analysis

    14.1. The USA

        14.1.1. Pricing Analysis

        14.1.2. Market Share Analysis, 2022

            14.1.2.1. By Product Type

            14.1.2.2. By Application

            14.1.2.3. By Crop Type

    14.2. Canada

        14.2.1. Pricing Analysis

        14.2.2. Market Share Analysis, 2022

            14.2.2.1. By Product Type

            14.2.2.2. By Application

            14.2.2.3. By Crop Type

    14.3. Brazil

        14.3.1. Pricing Analysis

        14.3.2. Market Share Analysis, 2022

            14.3.2.1. By Product Type

            14.3.2.2. By Application

            14.3.2.3. By Crop Type

    14.4. Mexico

        14.4.1. Pricing Analysis

        14.4.2. Market Share Analysis, 2022

            14.4.2.1. By Product Type

            14.4.2.2. By Application

            14.4.2.3. By Crop Type

    14.5. Germany

        14.5.1. Pricing Analysis

        14.5.2. Market Share Analysis, 2022

            14.5.2.1. By Product Type

            14.5.2.2. By Application

            14.5.2.3. By Crop Type

    14.6. U.K.

        14.6.1. Pricing Analysis

        14.6.2. Market Share Analysis, 2022

            14.6.2.1. By Product Type

            14.6.2.2. By Application

            14.6.2.3. By Crop Type

    14.7. France

        14.7.1. Pricing Analysis

        14.7.2. Market Share Analysis, 2022

            14.7.2.1. By Product Type

            14.7.2.2. By Application

            14.7.2.3. By Crop Type

    14.8. Spain

        14.8.1. Pricing Analysis

        14.8.2. Market Share Analysis, 2022

            14.8.2.1. By Product Type

            14.8.2.2. By Application

            14.8.2.3. By Crop Type

    14.9. Italy

        14.9.1. Pricing Analysis

        14.9.2. Market Share Analysis, 2022

            14.9.2.1. By Product Type

            14.9.2.2. By Application

            14.9.2.3. By Crop Type

    14.10. China

        14.10.1. Pricing Analysis

        14.10.2. Market Share Analysis, 2022

            14.10.2.1. By Product Type

            14.10.2.2. By Application

            14.10.2.3. By Crop Type

    14.11. Japan

        14.11.1. Pricing Analysis

        14.11.2. Market Share Analysis, 2022

            14.11.2.1. By Product Type

            14.11.2.2. By Application

            14.11.2.3. By Crop Type

    14.12. South Korea

        14.12.1. Pricing Analysis

        14.12.2. Market Share Analysis, 2022

            14.12.2.1. By Product Type

            14.12.2.2. By Application

            14.12.2.3. By Crop Type

    14.13. Singapore

        14.13.1. Pricing Analysis

        14.13.2. Market Share Analysis, 2022

            14.13.2.1. By Product Type

            14.13.2.2. By Application

            14.13.2.3. By Crop Type

    14.14. Thailand

        14.14.1. Pricing Analysis

        14.14.2. Market Share Analysis, 2022

            14.14.2.1. By Product Type

            14.14.2.2. By Application

            14.14.2.3. By Crop Type

    14.15. Indonesia

        14.15.1. Pricing Analysis

        14.15.2. Market Share Analysis, 2022

            14.15.2.1. By Product Type

            14.15.2.2. By Application

            14.15.2.3. By Crop Type

    14.16. Australia

        14.16.1. Pricing Analysis

        14.16.2. Market Share Analysis, 2022

            14.16.2.1. By Product Type

            14.16.2.2. By Application

            14.16.2.3. By Crop Type

    14.17. New Zealand

        14.17.1. Pricing Analysis

        14.17.2. Market Share Analysis, 2022

            14.17.2.1. By Product Type

            14.17.2.2. By Application

            14.17.2.3. By Crop Type

    14.18. GCC Countries

        14.18.1. Pricing Analysis

        14.18.2. Market Share Analysis, 2022

            14.18.2.1. By Product Type

            14.18.2.2. By Application

            14.18.2.3. By Crop Type

    14.19. South Africa

        14.19.1. Pricing Analysis

        14.19.2. Market Share Analysis, 2022

            14.19.2.1. By Product Type

            14.19.2.2. By Application

            14.19.2.3. By Crop Type

    14.20. Israel

        14.20.1. Pricing Analysis

        14.20.2. Market Share Analysis, 2022

            14.20.2.1. By Product Type

            14.20.2.2. By Application

            14.20.2.3. By Crop Type

15. Market Structure Analysis

    15.1. Competition Dashboard

    15.2. Competition Benchmarking

    15.3. Market Share Analysis of Top Players

        15.3.1. By Regional

        15.3.2. By Product Type

        15.3.3. By Application

        15.3.4. By Crop Type

16. Competition Analysis

    16.1. Competition Deep Dive

        16.1.1. Brandt Consolidated

            16.1.1.1. Overview

            16.1.1.2. Product Portfolio

            16.1.1.3. Profitability by Market Segments

            16.1.1.4. Sales Footprint

            16.1.1.5. Strategy Overview

                16.1.1.5.1. Marketing Strategy

                16.1.1.5.2. Product Strategy

                16.1.1.5.3. Channel Strategy

        16.1.2. Lamberti SPA

            16.1.2.1. Overview

            16.1.2.2. Product Portfolio

            16.1.2.3. Profitability by Market Segments

            16.1.2.4. Sales Footprint

            16.1.2.5. Strategy Overview

                16.1.2.5.1. Marketing Strategy

                16.1.2.5.2. Product Strategy

                16.1.2.5.3. Channel Strategy

        16.1.3. Winfield Solutions, LLC

            16.1.3.1. Overview

            16.1.3.2. Product Portfolio

            16.1.3.3. Profitability by Market Segments

            16.1.3.4. Sales Footprint

            16.1.3.5. Strategy Overview

                16.1.3.5.1. Marketing Strategy

                16.1.3.5.2. Product Strategy

                16.1.3.5.3. Channel Strategy

        16.1.4. Dow Croning

            16.1.4.1. Overview

            16.1.4.2. Product Portfolio

            16.1.4.3. Profitability by Market Segments

            16.1.4.4. Sales Footprint

            16.1.4.5. Strategy Overview

                16.1.4.5.1. Marketing Strategy

                16.1.4.5.2. Product Strategy

                16.1.4.5.3. Channel Strategy

        16.1.5. Wilbur-Ellis Holdings, Inc.

            16.1.5.1. Overview

            16.1.5.2. Product Portfolio

            16.1.5.3. Profitability by Market Segments

            16.1.5.4. Sales Footprint

            16.1.5.5. Strategy Overview

                16.1.5.5.1. Marketing Strategy

                16.1.5.5.2. Product Strategy

                16.1.5.5.3. Channel Strategy

        16.1.6. Helena Chemical Company

            16.1.6.1. Overview

            16.1.6.2. Product Portfolio

            16.1.6.3. Profitability by Market Segments

            16.1.6.4. Sales Footprint

            16.1.6.5. Strategy Overview

                16.1.6.5.1. Marketing Strategy

                16.1.6.5.2. Product Strategy

                16.1.6.5.3. Channel Strategy

        16.1.7. Clariant International Ltd.

            16.1.7.1. Overview

            16.1.7.2. Product Portfolio

            16.1.7.3. Profitability by Market Segments

            16.1.7.4. Sales Footprint

            16.1.7.5. Strategy Overview

                16.1.7.5.1. Marketing Strategy

                16.1.7.5.2. Product Strategy

                16.1.7.5.3. Channel Strategy

        16.1.8. Croda Chemicals

            16.1.8.1. Overview

            16.1.8.2. Product Portfolio

            16.1.8.3. Profitability by Market Segments

            16.1.8.4. Sales Footprint

            16.1.8.5. Strategy Overview

                16.1.8.5.1. Marketing Strategy

                16.1.8.5.2. Product Strategy

                16.1.8.5.3. Channel Strategy

        16.1.9. Tanatex Chemicals

            16.1.9.1. Overview

            16.1.9.2. Product Portfolio

            16.1.9.3. Profitability by Market Segments

            16.1.9.4. Sales Footprint

            16.1.9.5. Strategy Overview

                16.1.9.5.1. Marketing Strategy

                16.1.9.5.2. Product Strategy

                16.1.9.5.3. Channel Strategy

        16.1.10. Momentive Performance Materials

            16.1.10.1. Overview

            16.1.10.2. Product Portfolio

            16.1.10.3. Profitability by Market Segments

            16.1.10.4. Sales Footprint

            16.1.10.5. Strategy Overview

                16.1.10.5.1. Marketing Strategy

                16.1.10.5.2. Product Strategy

                16.1.10.5.3. Channel Strategy

        16.1.11. Solvay SA

            16.1.11.1. Overview

            16.1.11.2. Product Portfolio

            16.1.11.3. Profitability by Market Segments

            16.1.11.4. Sales Footprint

            16.1.11.5. Strategy Overview

                16.1.11.5.1. Marketing Strategy

                16.1.11.5.2. Product Strategy

                16.1.11.5.3. Channel Strategy

        16.1.12. Adjuvant plus Inc.

            16.1.12.1. Overview

            16.1.12.2. Product Portfolio

            16.1.12.3. Profitability by Market Segments

            16.1.12.4. Sales Footprint

            16.1.12.5. Strategy Overview

                16.1.12.5.1. Marketing Strategy

                16.1.12.5.2. Product Strategy

                16.1.12.5.3. Channel Strategy

17. Assumptions & Acronyms Used

18. Research Methodology

Don't pay for what you don't need

Customize your report by selecting specific countries or regions and save 30%!

List of Tables

Table 1: Global Market Value (US$ Million) Forecast by Region, 2018 to 2033

Table 2: Global Market Volume (MT) Forecast by Region, 2018 to 2033

Table 3: Global Market Value (US$ Million) Forecast by Product Type, 2018 to 2033

Table 4: Global Market Volume (MT) Forecast by Product Type, 2018 to 2033

Table 5: Global Market Value (US$ Million) Forecast by Application, 2018 to 2033

Table 6: Global Market Volume (MT) Forecast by Application, 2018 to 2033

Table 7: Global Market Value (US$ Million) Forecast by Crop Type, 2018 to 2033

Table 8: Global Market Volume (MT) Forecast by Crop Type, 2018 to 2033

Table 9: North America Market Value (US$ Million) Forecast by Country, 2018 to 2033

Table 10: North America Market Volume (MT) Forecast by Country, 2018 to 2033

Table 11: North America Market Value (US$ Million) Forecast by Product Type, 2018 to 2033

Table 12: North America Market Volume (MT) Forecast by Product Type, 2018 to 2033

Table 13: North America Market Value (US$ Million) Forecast by Application, 2018 to 2033

Table 14: North America Market Volume (MT) Forecast by Application, 2018 to 2033

Table 15: North America Market Value (US$ Million) Forecast by Crop Type, 2018 to 2033

Table 16: North America Market Volume (MT) Forecast by Crop Type, 2018 to 2033

Table 17: Latin America Market Value (US$ Million) Forecast by Country, 2018 to 2033

Table 18: Latin America Market Volume (MT) Forecast by Country, 2018 to 2033

Table 19: Latin America Market Value (US$ Million) Forecast by Product Type, 2018 to 2033

Table 20: Latin America Market Volume (MT) Forecast by Product Type, 2018 to 2033

Table 21: Latin America Market Value (US$ Million) Forecast by Application, 2018 to 2033

Table 22: Latin America Market Volume (MT) Forecast by Application, 2018 to 2033

Table 23: Latin America Market Value (US$ Million) Forecast by Crop Type, 2018 to 2033

Table 24: Latin America Market Volume (MT) Forecast by Crop Type, 2018 to 2033

Table 25: Europe Market Value (US$ Million) Forecast by Country, 2018 to 2033

Table 26: Europe Market Volume (MT) Forecast by Country, 2018 to 2033

Table 27: Europe Market Value (US$ Million) Forecast by Product Type, 2018 to 2033

Table 28: Europe Market Volume (MT) Forecast by Product Type, 2018 to 2033

Table 29: Europe Market Value (US$ Million) Forecast by Application, 2018 to 2033

Table 30: Europe Market Volume (MT) Forecast by Application, 2018 to 2033

Table 31: Europe Market Value (US$ Million) Forecast by Crop Type, 2018 to 2033

Table 32: Europe Market Volume (MT) Forecast by Crop Type, 2018 to 2033

Table 33: Asia Pacific Market Value (US$ Million) Forecast by Country, 2018 to 2033

Table 34: Asia Pacific Market Volume (MT) Forecast by Country, 2018 to 2033

Table 35: Asia Pacific Market Value (US$ Million) Forecast by Product Type, 2018 to 2033

Table 36: Asia Pacific Market Volume (MT) Forecast by Product Type, 2018 to 2033

Table 37: Asia Pacific Market Value (US$ Million) Forecast by Application, 2018 to 2033

Table 38: Asia Pacific Market Volume (MT) Forecast by Application, 2018 to 2033

Table 39: Asia Pacific Market Value (US$ Million) Forecast by Crop Type, 2018 to 2033

Table 40: Asia Pacific Market Volume (MT) Forecast by Crop Type, 2018 to 2033

Table 41: MEA Market Value (US$ Million) Forecast by Country, 2018 to 2033

Table 42: MEA Market Volume (MT) Forecast by Country, 2018 to 2033

Table 43: MEA Market Value (US$ Million) Forecast by Product Type, 2018 to 2033

Table 44: MEA Market Volume (MT) Forecast by Product Type, 2018 to 2033

Table 45: MEA Market Value (US$ Million) Forecast by Application, 2018 to 2033

Table 46: MEA Market Volume (MT) Forecast by Application, 2018 to 2033

Table 47: MEA Market Value (US$ Million) Forecast by Crop Type, 2018 to 2033

Table 48: MEA Market Volume (MT) Forecast by Crop Type, 2018 to 2033
Nandini Roy Choudhury

Principal Consultant

Talk to Analyst

Find your sweet spots for generating winning opportunities in this market.

List of Charts

Figure 1: Global Market Value (US$ Million) by Product Type, 2023 to 2033

Figure 2: Global Market Value (US$ Million) by Application, 2023 to 2033

Figure 3: Global Market Value (US$ Million) by Crop Type, 2023 to 2033

Figure 4: Global Market Value (US$ Million) by Region, 2023 to 2033

Figure 5: Global Market Value (US$ Million) Analysis by Region, 2018 to 2033

Figure 6: Global Market Volume (MT) Analysis by Region, 2018 to 2033

Figure 7: Global Market Value Share (%) and BPS Analysis by Region, 2023 to 2033

Figure 8: Global Market Y-o-Y Growth (%) Projections by Region, 2023 to 2033

Figure 9: Global Market Value (US$ Million) Analysis by Product Type, 2018 to 2033

Figure 10: Global Market Volume (MT) Analysis by Product Type, 2018 to 2033

Figure 11: Global Market Value Share (%) and BPS Analysis by Product Type, 2023 to 2033

Figure 12: Global Market Y-o-Y Growth (%) Projections by Product Type, 2023 to 2033

Figure 13: Global Market Value (US$ Million) Analysis by Application, 2018 to 2033

Figure 14: Global Market Volume (MT) Analysis by Application, 2018 to 2033

Figure 15: Global Market Value Share (%) and BPS Analysis by Application, 2023 to 2033

Figure 16: Global Market Y-o-Y Growth (%) Projections by Application, 2023 to 2033

Figure 17: Global Market Value (US$ Million) Analysis by Crop Type, 2018 to 2033

Figure 18: Global Market Volume (MT) Analysis by Crop Type, 2018 to 2033

Figure 19: Global Market Value Share (%) and BPS Analysis by Crop Type, 2023 to 2033

Figure 20: Global Market Y-o-Y Growth (%) Projections by Crop Type, 2023 to 2033

Figure 21: Global Market Attractiveness by Product Type, 2023 to 2033

Figure 22: Global Market Attractiveness by Application, 2023 to 2033

Figure 23: Global Market Attractiveness by Crop Type, 2023 to 2033

Figure 24: Global Market Attractiveness by Region, 2023 to 2033

Figure 25: North America Market Value (US$ Million) by Product Type, 2023 to 2033

Figure 26: North America Market Value (US$ Million) by Application, 2023 to 2033

Figure 27: North America Market Value (US$ Million) by Crop Type, 2023 to 2033

Figure 28: North America Market Value (US$ Million) by Country, 2023 to 2033

Figure 29: North America Market Value (US$ Million) Analysis by Country, 2018 to 2033

Figure 30: North America Market Volume (MT) Analysis by Country, 2018 to 2033

Figure 31: North America Market Value Share (%) and BPS Analysis by Country, 2023 to 2033

Figure 32: North America Market Y-o-Y Growth (%) Projections by Country, 2023 to 2033

Figure 33: North America Market Value (US$ Million) Analysis by Product Type, 2018 to 2033

Figure 34: North America Market Volume (MT) Analysis by Product Type, 2018 to 2033

Figure 35: North America Market Value Share (%) and BPS Analysis by Product Type, 2023 to 2033

Figure 36: North America Market Y-o-Y Growth (%) Projections by Product Type, 2023 to 2033

Figure 37: North America Market Value (US$ Million) Analysis by Application, 2018 to 2033

Figure 38: North America Market Volume (MT) Analysis by Application, 2018 to 2033

Figure 39: North America Market Value Share (%) and BPS Analysis by Application, 2023 to 2033

Figure 40: North America Market Y-o-Y Growth (%) Projections by Application, 2023 to 2033

Figure 41: North America Market Value (US$ Million) Analysis by Crop Type, 2018 to 2033

Figure 42: North America Market Volume (MT) Analysis by Crop Type, 2018 to 2033

Figure 43: North America Market Value Share (%) and BPS Analysis by Crop Type, 2023 to 2033

Figure 44: North America Market Y-o-Y Growth (%) Projections by Crop Type, 2023 to 2033

Figure 45: North America Market Attractiveness by Product Type, 2023 to 2033

Figure 46: North America Market Attractiveness by Application, 2023 to 2033

Figure 47: North America Market Attractiveness by Crop Type, 2023 to 2033

Figure 48: North America Market Attractiveness by Country, 2023 to 2033

Figure 49: Latin America Market Value (US$ Million) by Product Type, 2023 to 2033

Figure 50: Latin America Market Value (US$ Million) by Application, 2023 to 2033

Figure 51: Latin America Market Value (US$ Million) by Crop Type, 2023 to 2033

Figure 52: Latin America Market Value (US$ Million) by Country, 2023 to 2033

Figure 53: Latin America Market Value (US$ Million) Analysis by Country, 2018 to 2033

Figure 54: Latin America Market Volume (MT) Analysis by Country, 2018 to 2033

Figure 55: Latin America Market Value Share (%) and BPS Analysis by Country, 2023 to 2033

Figure 56: Latin America Market Y-o-Y Growth (%) Projections by Country, 2023 to 2033

Figure 57: Latin America Market Value (US$ Million) Analysis by Product Type, 2018 to 2033

Figure 58: Latin America Market Volume (MT) Analysis by Product Type, 2018 to 2033

Figure 59: Latin America Market Value Share (%) and BPS Analysis by Product Type, 2023 to 2033

Figure 60: Latin America Market Y-o-Y Growth (%) Projections by Product Type, 2023 to 2033

Figure 61: Latin America Market Value (US$ Million) Analysis by Application, 2018 to 2033

Figure 62: Latin America Market Volume (MT) Analysis by Application, 2018 to 2033

Figure 63: Latin America Market Value Share (%) and BPS Analysis by Application, 2023 to 2033

Figure 64: Latin America Market Y-o-Y Growth (%) Projections by Application, 2023 to 2033

Figure 65: Latin America Market Value (US$ Million) Analysis by Crop Type, 2018 to 2033

Figure 66: Latin America Market Volume (MT) Analysis by Crop Type, 2018 to 2033

Figure 67: Latin America Market Value Share (%) and BPS Analysis by Crop Type, 2023 to 2033

Figure 68: Latin America Market Y-o-Y Growth (%) Projections by Crop Type, 2023 to 2033

Figure 69: Latin America Market Attractiveness by Product Type, 2023 to 2033

Figure 70: Latin America Market Attractiveness by Application, 2023 to 2033

Figure 71: Latin America Market Attractiveness by Crop Type, 2023 to 2033

Figure 72: Latin America Market Attractiveness by Country, 2023 to 2033

Figure 73: Europe Market Value (US$ Million) by Product Type, 2023 to 2033

Figure 74: Europe Market Value (US$ Million) by Application, 2023 to 2033

Figure 75: Europe Market Value (US$ Million) by Crop Type, 2023 to 2033

Figure 76: Europe Market Value (US$ Million) by Country, 2023 to 2033

Figure 77: Europe Market Value (US$ Million) Analysis by Country, 2018 to 2033

Figure 78: Europe Market Volume (MT) Analysis by Country, 2018 to 2033

Figure 79: Europe Market Value Share (%) and BPS Analysis by Country, 2023 to 2033

Figure 80: Europe Market Y-o-Y Growth (%) Projections by Country, 2023 to 2033

Figure 81: Europe Market Value (US$ Million) Analysis by Product Type, 2018 to 2033

Figure 82: Europe Market Volume (MT) Analysis by Product Type, 2018 to 2033

Figure 83: Europe Market Value Share (%) and BPS Analysis by Product Type, 2023 to 2033

Figure 84: Europe Market Y-o-Y Growth (%) Projections by Product Type, 2023 to 2033

Figure 85: Europe Market Value (US$ Million) Analysis by Application, 2018 to 2033

Figure 86: Europe Market Volume (MT) Analysis by Application, 2018 to 2033

Figure 87: Europe Market Value Share (%) and BPS Analysis by Application, 2023 to 2033

Figure 88: Europe Market Y-o-Y Growth (%) Projections by Application, 2023 to 2033

Figure 89: Europe Market Value (US$ Million) Analysis by Crop Type, 2018 to 2033

Figure 90: Europe Market Volume (MT) Analysis by Crop Type, 2018 to 2033

Figure 91: Europe Market Value Share (%) and BPS Analysis by Crop Type, 2023 to 2033

Figure 92: Europe Market Y-o-Y Growth (%) Projections by Crop Type, 2023 to 2033

Figure 93: Europe Market Attractiveness by Product Type, 2023 to 2033

Figure 94: Europe Market Attractiveness by Application, 2023 to 2033

Figure 95: Europe Market Attractiveness by Crop Type, 2023 to 2033

Figure 96: Europe Market Attractiveness by Country, 2023 to 2033

Figure 97: Asia Pacific Market Value (US$ Million) by Product Type, 2023 to 2033

Figure 98: Asia Pacific Market Value (US$ Million) by Application, 2023 to 2033

Figure 99: Asia Pacific Market Value (US$ Million) by Crop Type, 2023 to 2033

Figure 100: Asia Pacific Market Value (US$ Million) by Country, 2023 to 2033

Figure 101: Asia Pacific Market Value (US$ Million) Analysis by Country, 2018 to 2033

Figure 102: Asia Pacific Market Volume (MT) Analysis by Country, 2018 to 2033

Figure 103: Asia Pacific Market Value Share (%) and BPS Analysis by Country, 2023 to 2033

Figure 104: Asia Pacific Market Y-o-Y Growth (%) Projections by Country, 2023 to 2033

Figure 105: Asia Pacific Market Value (US$ Million) Analysis by Product Type, 2018 to 2033

Figure 106: Asia Pacific Market Volume (MT) Analysis by Product Type, 2018 to 2033

Figure 107: Asia Pacific Market Value Share (%) and BPS Analysis by Product Type, 2023 to 2033

Figure 108: Asia Pacific Market Y-o-Y Growth (%) Projections by Product Type, 2023 to 2033

Figure 109: Asia Pacific Market Value (US$ Million) Analysis by Application, 2018 to 2033

Figure 110: Asia Pacific Market Volume (MT) Analysis by Application, 2018 to 2033

Figure 111: Asia Pacific Market Value Share (%) and BPS Analysis by Application, 2023 to 2033

Figure 112: Asia Pacific Market Y-o-Y Growth (%) Projections by Application, 2023 to 2033

Figure 113: Asia Pacific Market Value (US$ Million) Analysis by Crop Type, 2018 to 2033

Figure 114: Asia Pacific Market Volume (MT) Analysis by Crop Type, 2018 to 2033

Figure 115: Asia Pacific Market Value Share (%) and BPS Analysis by Crop Type, 2023 to 2033

Figure 116: Asia Pacific Market Y-o-Y Growth (%) Projections by Crop Type, 2023 to 2033

Figure 117: Asia Pacific Market Attractiveness by Product Type, 2023 to 2033

Figure 118: Asia Pacific Market Attractiveness by Application, 2023 to 2033

Figure 119: Asia Pacific Market Attractiveness by Crop Type, 2023 to 2033

Figure 120: Asia Pacific Market Attractiveness by Country, 2023 to 2033

Figure 121: MEA Market Value (US$ Million) by Product Type, 2023 to 2033

Figure 122: MEA Market Value (US$ Million) by Application, 2023 to 2033

Figure 123: MEA Market Value (US$ Million) by Crop Type, 2023 to 2033

Figure 124: MEA Market Value (US$ Million) by Country, 2023 to 2033

Figure 125: MEA Market Value (US$ Million) Analysis by Country, 2018 to 2033

Figure 126: MEA Market Volume (MT) Analysis by Country, 2018 to 2033

Figure 127: MEA Market Value Share (%) and BPS Analysis by Country, 2023 to 2033

Figure 128: MEA Market Y-o-Y Growth (%) Projections by Country, 2023 to 2033

Figure 129: MEA Market Value (US$ Million) Analysis by Product Type, 2018 to 2033

Figure 130: MEA Market Volume (MT) Analysis by Product Type, 2018 to 2033

Figure 131: MEA Market Value Share (%) and BPS Analysis by Product Type, 2023 to 2033

Figure 132: MEA Market Y-o-Y Growth (%) Projections by Product Type, 2023 to 2033

Figure 133: MEA Market Value (US$ Million) Analysis by Application, 2018 to 2033

Figure 134: MEA Market Volume (MT) Analysis by Application, 2018 to 2033

Figure 135: MEA Market Value Share (%) and BPS Analysis by Application, 2023 to 2033

Figure 136: MEA Market Y-o-Y Growth (%) Projections by Application, 2023 to 2033

Figure 137: MEA Market Value (US$ Million) Analysis by Crop Type, 2018 to 2033

Figure 138: MEA Market Volume (MT) Analysis by Crop Type, 2018 to 2033

Figure 139: MEA Market Value Share (%) and BPS Analysis by Crop Type, 2023 to 2033

Figure 140: MEA Market Y-o-Y Growth (%) Projections by Crop Type, 2023 to 2033

Figure 141: MEA Market Attractiveness by Product Type, 2023 to 2033

Figure 142: MEA Market Attractiveness by Application, 2023 to 2033

Figure 143: MEA Market Attractiveness by Crop Type, 2023 to 2033

Figure 144: MEA Market Attractiveness by Country, 2023 to 2033

Recommendations

Food and Beverage

Organic Food and Beverage Market

Published : March 2024

Food and Beverage

Organic Foods Market

Published : February 2023

Explore Food and Beverage Insights

View Reports

Agricultural Adjuvant Market