Conductive Inks Market Size and Share Forecast Outlook 2025 to 2035

The Conductive Inks Market is estimated to be valued at USD 3.6 billion in 2025 and is projected to reach USD 5.4 billion by 2035, registering a compound annual growth rate (CAGR) of 4.3% over the forecast period.
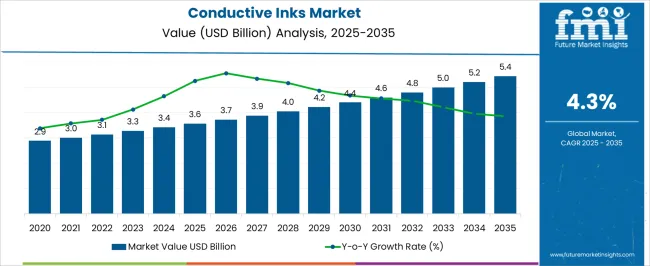
Quick Stats for Conductive Inks Market

  • Conductive Inks Market Value (2025): USD 3.6 billion
  • Conductive Inks Market Forecast Value (2035): USD 5.4 billion
  • Conductive Inks Market Forecast CAGR: 4.3%
  • Leading Segment in Conductive Inks Market in 2025: Silver Conductive Inks (24.6%)
  • Key Growth Regions in Conductive Inks Market: North America, Asia-Pacific, Europe
  • Top Key Players in Conductive Inks Market: Henkel AG & Co. KGaA, DuPont, Methode Electronics, Creative Materials Inc., Nano Dimension, Conductive Compounds, Inc., TEKRA, A Division of EIS, Inc., Sigma-Aldrich Co. LLC., Novacentrix, Inkron, TOYO INK GROUP
Conductive Inks Market Market Value Analysis

Conductive Inks Market Key Takeaways

Metric Value
Conductive Inks Market Estimated Value in (2025 E) USD 3.6 billion
Conductive Inks Market Forecast Value in (2035 F) USD 5.4 billion
Forecast CAGR (2025 to 2035) 4.3%

Why is the Conductive Inks Market Growing?

The conductive inks market is experiencing significant growth, driven by the increasing demand for flexible electronics, printed circuits, and energy-efficient solutions in multiple industries. Rising adoption of wearable devices, smart packaging, solar energy systems, and automotive electronics is accelerating the need for high-performance conductive materials. Technological advancements in ink formulation, such as enhanced conductivity, adhesion, and compatibility with diverse substrates, are further expanding application potential.

The market is also influenced by the push for sustainable and lightweight electronics that reduce material waste and production costs. Growing investments in renewable energy and portable electronics have reinforced demand for conductive inks that can support scalable and cost-effective manufacturing processes.

Additionally, the ability to integrate these inks into additive manufacturing and printing technologies is opening new opportunities in advanced electronics and IoT applications As industries continue to focus on miniaturization, energy efficiency, and flexible electronic solutions, the conductive inks market is expected to maintain steady growth, with innovative formulations enabling broader adoption across emerging and mature markets.

Segmental Analysis

The conductive inks market is segmented by type, application, and geographic regions. By type, conductive inks market is divided into Silver Conductive Inks, Carbon Conductive Inks, Silver Nano Inks, Silver Chloride Inks, Dielectric Inks, and Copper/ Copper Oxide Inks. In terms of application, conductive inks market is classified into Solar Panels, Sensors, Biosensors, Touch Screen, Antenna, Printed Heaters, Potentiometers And PCBs (Printed Circuit Board), and Electroluminescent (EL) Panel. Regionally, the conductive inks industry is classified into North America, Latin America, Western Europe, Eastern Europe, Balkan & Baltic Countries, Russia & Belarus, Central Asia, East Asia, South Asia & Pacific, and the Middle East & Africa.
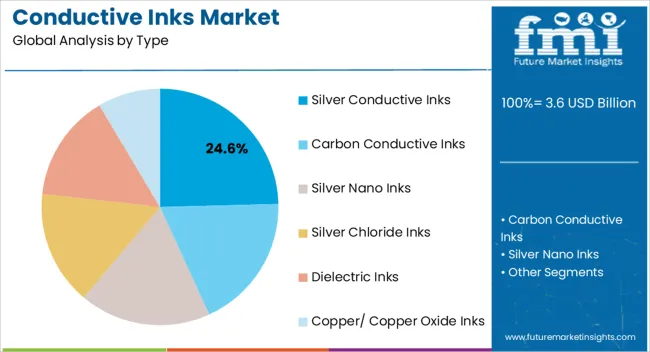
Insights into the Silver Conductive Inks Type Segment

Conductive Inks Market Analysis By Type

The silver conductive inks segment is projected to hold 24.6% of the conductive inks market revenue share in 2025, establishing it as a leading type in the market. Its dominance is being driven by superior electrical conductivity, excellent thermal stability, and reliable adhesion properties, which make it suitable for high-performance electronic applications. The segment is being increasingly adopted in printed circuit boards, RFID tags, sensors, and flexible electronics where consistent conductivity is critical.

Silver inks also support precision printing and high-resolution patterning, enabling the fabrication of compact and efficient electronic components. The high reliability and performance of silver conductive inks under varying environmental conditions have further reinforced their preference among manufacturers.

Ongoing developments in cost-effective formulations and nanoparticle-based dispersions are enhancing performance while addressing cost concerns As demand for high-efficiency electronic devices and advanced manufacturing techniques grows, silver conductive inks are expected to maintain a significant market position, driving innovation across multiple applications.
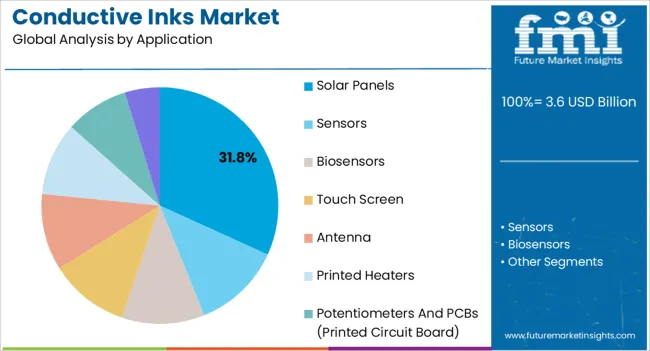
Insights into the Solar Panels Application Segment

Conductive Inks Market Analysis By Application

The solar panels application segment is expected to account for 31.8% of the conductive inks market revenue share in 2025, making it the leading application area. Its leadership is being influenced by the increasing global adoption of solar energy systems to support renewable energy goals and reduce carbon emissions. Conductive inks are being used extensively in solar cells for interconnections, electrode formation, and efficiency optimization.

The ability to print conductive patterns with precision reduces material consumption, production time, and overall manufacturing costs, enhancing their appeal to solar panel manufacturers. Ongoing improvements in ink formulations, including higher conductivity and compatibility with various photovoltaic substrates, are driving broader adoption.

Strong government initiatives and incentives to promote solar energy deployment in multiple regions are further stimulating demand for conductive inks in this application As solar installations continue to expand globally, the use of conductive inks for efficient and cost-effective solar panel manufacturing is expected to sustain the segment’s leadership in the market.

Market Overview

Conductive Inks Market Outlook

Growth in the demand for conductive inks is driven by:

  • The electronics industry's explosive growth
  • Product applications include polymer thick-film circuitry, electromagnetic interference (EMI) and radio frequency (RFI) shielding of polyimide flexible circuits, membrane switches, and coatings for tantalum capacitors.
  • The ever-increasing need for more compact and energy-efficient technological products

The ever-increasing price of silver has made it imperative to find alternatives to or significantly reduce reliance on the precious metal. Due to its unpredictable price, silver has been replaced by more affordable conductive metals like copper, graphene, and aluminum. Potential market expansion is hampered since the alternatives supplied cannot compete with silver's superior attributes. Limiting silver's use in silver-based inks may slow the market because of its expected price increase throughout the projection period.
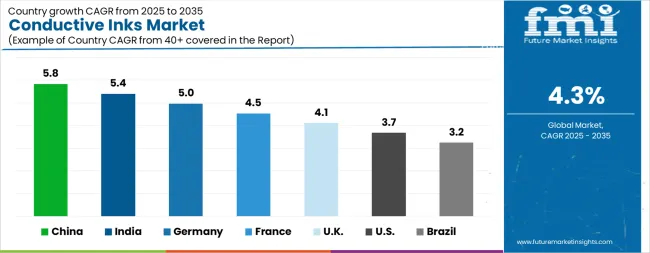
Analysis of Conductive Inks Market By Key Countries

Conductive Inks Market Cagr Analysis By Country
Country CAGR
China 5.8%
India 5.4%
Germany 5.0%
France 4.5%
UK 4.1%
USA 3.7%
Brazil 3.2%

Country-wise Analysis

The Conductive Inks Market is expected to register a CAGR of 4.3% during the forecast period, exhibiting varied country level momentum. China leads with the highest CAGR of 5.8%, followed by India at 5.4%. Developed markets such as Germany, France, and the UK continue to expand steadily, while the USA is likely to grow at consistent rates. Brazil posts the lowest CAGR at 3.2%, yet still underscores a broadly positive trajectory for the global Conductive Inks Market. In 2024, Germany held a dominant revenue in the Western Europe market and is expected to grow with a CAGR of 5.0%. The USA Conductive Inks Market is estimated to be valued at USD 1.3 billion in 2025 and is anticipated to reach a valuation of USD 1.9 billion by 2035. Sales are projected to rise at a CAGR of 3.7% over the forecast period between 2025 and 2035. While Japan and South Korea markets are estimated to be valued at USD 193.5 million and USD 123.5 million respectively in 2025.
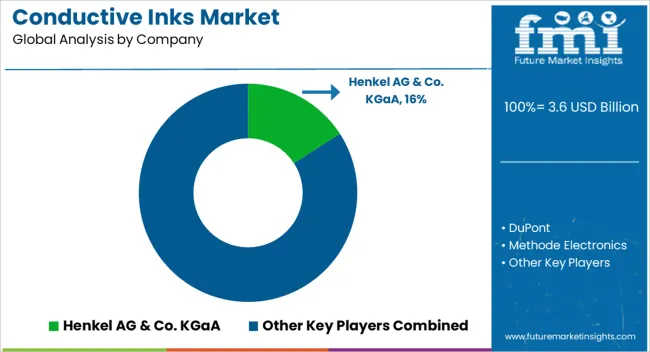
Key Players in the Conductive Inks Market

Conductive Inks Market Analysis By Company

  • Henkel AG & Co. KGaA
  • DuPont
  • Methode Electronics
  • Creative Materials Inc.
  • Nano Dimension
  • Conductive Compounds, Inc.
  • TEKRA, A Division of EIS, Inc.
  • Sigma-Aldrich Co. LLC.
  • Novacentrix
  • Inkron
  • TOYO INK GROUP

Scope of the Report

Item Value
Quantitative Units USD 3.6 Billion
Type Silver Conductive Inks, Carbon Conductive Inks, Silver Nano Inks, Silver Chloride Inks, Dielectric Inks, and Copper/ Copper Oxide Inks
Application Solar Panels, Sensors, Biosensors, Touch Screen, Antenna, Printed Heaters, Potentiometers And PCBs (Printed Circuit Board), and Electroluminescent (EL) Panel
Regions Covered North America, Europe, Asia-Pacific, Latin America, Middle East & Africa
Country Covered United States, Canada, Germany, France, United Kingdom, China, Japan, India, Brazil, South Africa
Key Companies Profiled Henkel AG & Co. KGaA, DuPont, Methode Electronics, Creative Materials Inc., Nano Dimension, Conductive Compounds, Inc., TEKRA, A Division of EIS, Inc., Sigma-Aldrich Co. LLC., Novacentrix, Inkron, and TOYO INK GROUP

Conductive Inks Market by Segments

Type:

  • Silver Conductive Inks
  • Carbon Conductive Inks
  • Silver Nano Inks
  • Silver Chloride Inks
  • Dielectric Inks
  • Copper/ Copper Oxide Inks

Application:

  • Solar Panels
  • Sensors
  • Biosensors
  • Touch Screen
  • Antenna
  • Printed Heaters
  • Potentiometers And PCBs (Printed Circuit Board)
  • Electroluminescent (EL) Panel

Region:

  • North America
    • USA
    • Canada
    • Mexico
  • Latin America
    • Brazil
    • Chile
    • Rest of Latin America
  • Western Europe
    • Germany
    • UK
    • Italy
    • Spain
    • France
    • Nordic
    • BENELUX
    • Rest of Western Europe
  • Eastern Europe
    • Russia
    • Poland
    • Hungary
    • Balkan & Baltic
    • Rest of Eastern Europe
  • East Asia
    • China
    • Japan
    • South Korea
  • South Asia and Pacific
    • India
    • ASEAN
    • Australia & New Zealand
    • Rest of South Asia and Pacific
  • Middle East & Africa
    • Kingdom of Saudi Arabia
    • Other GCC Countries
    • Turkiye
    • South Africa
    • Other African Union
    • Rest of Middle East & Africa

Table of Content

  1. Executive Summary
    • Global Market Outlook
    • Demand-side Trends
    • Supply-side Trends
    • Technology Roadmap Analysis
    • Analysis and Recommendations
  2. Market Overview
    • Market Coverage / Taxonomy
    • Market Definition / Scope / Limitations
  3. Market Background
    • Market Dynamics
      • Drivers
      • Restraints
      • Opportunity
      • Trends
    • Scenario Forecast
      • Demand in Optimistic Scenario
      • Demand in Likely Scenario
      • Demand in Conservative Scenario
    • Opportunity Map Analysis
    • Product Life Cycle Analysis
    • Supply Chain Analysis
    • Investment Feasibility Matrix
    • Value Chain Analysis
    • PESTLE and Porter’s Analysis
    • Regulatory Landscape
    • Regional Parent Market Outlook
    • Production and Consumption Statistics
    • Import and Export Statistics
  4. Global Market Analysis 2020 to 2024 and Forecast, 2025 to 2035
    • Historical Market Size Value (USD Million) Analysis, 2020 to 2024
    • Current and Future Market Size Value (USD Million) Projections, 2025 to 2035
      • Y-o-Y Growth Trend Analysis
      • Absolute $ Opportunity Analysis
  5. Global Market Pricing Analysis 2020 to 2024 and Forecast 2025 to 2035
  6. Global Market Analysis 2020 to 2024 and Forecast 2025 to 2035, By Type
    • Introduction / Key Findings
    • Historical Market Size Value (USD Million) Analysis By Type , 2020 to 2024
    • Current and Future Market Size Value (USD Million) Analysis and Forecast By Type , 2025 to 2035
      • Silver Conductive Inks
      • Carbon Conductive Inks
      • Silver Nano Inks
      • Silver Chloride Inks
      • Dielectric Inks
      • Copper/ Copper Oxide Inks
    • Y-o-Y Growth Trend Analysis By Type , 2020 to 2024
    • Absolute $ Opportunity Analysis By Type , 2025 to 2035
  7. Global Market Analysis 2020 to 2024 and Forecast 2025 to 2035, By Application
    • Introduction / Key Findings
    • Historical Market Size Value (USD Million) Analysis By Application, 2020 to 2024
    • Current and Future Market Size Value (USD Million) Analysis and Forecast By Application, 2025 to 2035
      • Solar Panels
      • Sensors
      • Biosensors
      • Touch Screen
      • Antenna
      • Printed Heaters
      • Potentiometers And PCBs (Printed Circuit Board)
      • Electroluminescent (EL) Panel
    • Y-o-Y Growth Trend Analysis By Application, 2020 to 2024
    • Absolute $ Opportunity Analysis By Application, 2025 to 2035
  8. Global Market Analysis 2020 to 2024 and Forecast 2025 to 2035, By Region
    • Introduction
    • Historical Market Size Value (USD Million) Analysis By Region, 2020 to 2024
    • Current Market Size Value (USD Million) Analysis and Forecast By Region, 2025 to 2035
      • North America
      • Latin America
      • Western Europe
      • Eastern Europe
      • East Asia
      • South Asia and Pacific
      • Middle East & Africa
    • Market Attractiveness Analysis By Region
  9. North America Market Analysis 2020 to 2024 and Forecast 2025 to 2035, By Country
    • Historical Market Size Value (USD Million) Trend Analysis By Market Taxonomy, 2020 to 2024
    • Market Size Value (USD Million) Forecast By Market Taxonomy, 2025 to 2035
      • By Country
        • USA
        • Canada
        • Mexico
      • By Type
      • By Application
    • Market Attractiveness Analysis
      • By Country
      • By Type
      • By Application
    • Key Takeaways
  10. Latin America Market Analysis 2020 to 2024 and Forecast 2025 to 2035, By Country
    • Historical Market Size Value (USD Million) Trend Analysis By Market Taxonomy, 2020 to 2024
    • Market Size Value (USD Million) Forecast By Market Taxonomy, 2025 to 2035
      • By Country
        • Brazil
        • Chile
        • Rest of Latin America
      • By Type
      • By Application
    • Market Attractiveness Analysis
      • By Country
      • By Type
      • By Application
    • Key Takeaways
  11. Western Europe Market Analysis 2020 to 2024 and Forecast 2025 to 2035, By Country
    • Historical Market Size Value (USD Million) Trend Analysis By Market Taxonomy, 2020 to 2024
    • Market Size Value (USD Million) Forecast By Market Taxonomy, 2025 to 2035
      • By Country
        • Germany
        • UK
        • Italy
        • Spain
        • France
        • Nordic
        • BENELUX
        • Rest of Western Europe
      • By Type
      • By Application
    • Market Attractiveness Analysis
      • By Country
      • By Type
      • By Application
    • Key Takeaways
  12. Eastern Europe Market Analysis 2020 to 2024 and Forecast 2025 to 2035, By Country
    • Historical Market Size Value (USD Million) Trend Analysis By Market Taxonomy, 2020 to 2024
    • Market Size Value (USD Million) Forecast By Market Taxonomy, 2025 to 2035
      • By Country
        • Russia
        • Poland
        • Hungary
        • Balkan & Baltic
        • Rest of Eastern Europe
      • By Type
      • By Application
    • Market Attractiveness Analysis
      • By Country
      • By Type
      • By Application
    • Key Takeaways
  13. East Asia Market Analysis 2020 to 2024 and Forecast 2025 to 2035, By Country
    • Historical Market Size Value (USD Million) Trend Analysis By Market Taxonomy, 2020 to 2024
    • Market Size Value (USD Million) Forecast By Market Taxonomy, 2025 to 2035
      • By Country
        • China
        • Japan
        • South Korea
      • By Type
      • By Application
    • Market Attractiveness Analysis
      • By Country
      • By Type
      • By Application
    • Key Takeaways
  14. South Asia and Pacific Market Analysis 2020 to 2024 and Forecast 2025 to 2035, By Country
    • Historical Market Size Value (USD Million) Trend Analysis By Market Taxonomy, 2020 to 2024
    • Market Size Value (USD Million) Forecast By Market Taxonomy, 2025 to 2035
      • By Country
        • India
        • ASEAN
        • Australia & New Zealand
        • Rest of South Asia and Pacific
      • By Type
      • By Application
    • Market Attractiveness Analysis
      • By Country
      • By Type
      • By Application
    • Key Takeaways
  15. Middle East & Africa Market Analysis 2020 to 2024 and Forecast 2025 to 2035, By Country
    • Historical Market Size Value (USD Million) Trend Analysis By Market Taxonomy, 2020 to 2024
    • Market Size Value (USD Million) Forecast By Market Taxonomy, 2025 to 2035
      • By Country
        • Kingdom of Saudi Arabia
        • Other GCC Countries
        • Turkiye
        • South Africa
        • Other African Union
        • Rest of Middle East & Africa
      • By Type
      • By Application
    • Market Attractiveness Analysis
      • By Country
      • By Type
      • By Application
    • Key Takeaways
  16. Key Countries Market Analysis
    • USA
      • Pricing Analysis
      • Market Share Analysis, 2024
        • By Type
        • By Application
    • Canada
      • Pricing Analysis
      • Market Share Analysis, 2024
        • By Type
        • By Application
    • Mexico
      • Pricing Analysis
      • Market Share Analysis, 2024
        • By Type
        • By Application
    • Brazil
      • Pricing Analysis
      • Market Share Analysis, 2024
        • By Type
        • By Application
    • Chile
      • Pricing Analysis
      • Market Share Analysis, 2024
        • By Type
        • By Application
    • Germany
      • Pricing Analysis
      • Market Share Analysis, 2024
        • By Type
        • By Application
    • UK
      • Pricing Analysis
      • Market Share Analysis, 2024
        • By Type
        • By Application
    • Italy
      • Pricing Analysis
      • Market Share Analysis, 2024
        • By Type
        • By Application
    • Spain
      • Pricing Analysis
      • Market Share Analysis, 2024
        • By Type
        • By Application
    • France
      • Pricing Analysis
      • Market Share Analysis, 2024
        • By Type
        • By Application
    • India
      • Pricing Analysis
      • Market Share Analysis, 2024
        • By Type
        • By Application
    • ASEAN
      • Pricing Analysis
      • Market Share Analysis, 2024
        • By Type
        • By Application
    • Australia & New Zealand
      • Pricing Analysis
      • Market Share Analysis, 2024
        • By Type
        • By Application
    • China
      • Pricing Analysis
      • Market Share Analysis, 2024
        • By Type
        • By Application
    • Japan
      • Pricing Analysis
      • Market Share Analysis, 2024
        • By Type
        • By Application
    • South Korea
      • Pricing Analysis
      • Market Share Analysis, 2024
        • By Type
        • By Application
    • Russia
      • Pricing Analysis
      • Market Share Analysis, 2024
        • By Type
        • By Application
    • Poland
      • Pricing Analysis
      • Market Share Analysis, 2024
        • By Type
        • By Application
    • Hungary
      • Pricing Analysis
      • Market Share Analysis, 2024
        • By Type
        • By Application
    • Kingdom of Saudi Arabia
      • Pricing Analysis
      • Market Share Analysis, 2024
        • By Type
        • By Application
    • Turkiye
      • Pricing Analysis
      • Market Share Analysis, 2024
        • By Type
        • By Application
    • South Africa
      • Pricing Analysis
      • Market Share Analysis, 2024
        • By Type
        • By Application
  17. Market Structure Analysis
    • Competition Dashboard
    • Competition Benchmarking
    • Market Share Analysis of Top Players
      • By Regional
      • By Type
      • By Application
  18. Competition Analysis
    • Competition Deep Dive
      • Henkel AG & Co. KGaA
        • Overview
        • Product Portfolio
        • Profitability by Market Segments (Product/Age /Sales Channel/Region)
        • Sales Footprint
        • Strategy Overview
          • Marketing Strategy
          • Product Strategy
          • Channel Strategy
      • DuPont
      • Methode Electronics
      • Creative Materials Inc.
      • Nano Dimension
      • Conductive Compounds, Inc.
      • TEKRA, A Division of EIS, Inc.
      • Sigma-Aldrich Co. LLC.
      • Novacentrix
      • Inkron
      • TOYO INK GROUP
  19. Assumptions & Acronyms Used
  20. Research Methodology

List of Tables

  • Table 1: Global Market Value (USD Million) Forecast by Region, 2020-2035
  • Table 2: Global Market Value (USD Million) Forecast by Type , 2020-2035
  • Table 3: Global Market Value (USD Million) Forecast by Application, 2020-2035
  • Table 4: North America Market Value (USD Million) Forecast by Country, 2020-2035
  • Table 5: North America Market Value (USD Million) Forecast by Type , 2020-2035
  • Table 6: North America Market Value (USD Million) Forecast by Application, 2020-2035
  • Table 7: Latin America Market Value (USD Million) Forecast by Country, 2020-2035
  • Table 8: Latin America Market Value (USD Million) Forecast by Type , 2020-2035
  • Table 9: Latin America Market Value (USD Million) Forecast by Application, 2020-2035
  • Table 10: Western Europe Market Value (USD Million) Forecast by Country, 2020-2035
  • Table 11: Western Europe Market Value (USD Million) Forecast by Type , 2020-2035
  • Table 12: Western Europe Market Value (USD Million) Forecast by Application, 2020-2035
  • Table 13: Eastern Europe Market Value (USD Million) Forecast by Country, 2020-2035
  • Table 14: Eastern Europe Market Value (USD Million) Forecast by Type , 2020-2035
  • Table 15: Eastern Europe Market Value (USD Million) Forecast by Application, 2020-2035
  • Table 16: East Asia Market Value (USD Million) Forecast by Country, 2020-2035
  • Table 17: East Asia Market Value (USD Million) Forecast by Type , 2020-2035
  • Table 18: East Asia Market Value (USD Million) Forecast by Application, 2020-2035
  • Table 19: South Asia and Pacific Market Value (USD Million) Forecast by Country, 2020-2035
  • Table 20: South Asia and Pacific Market Value (USD Million) Forecast by Type , 2020-2035
  • Table 21: South Asia and Pacific Market Value (USD Million) Forecast by Application, 2020-2035
  • Table 22: Middle East & Africa Market Value (USD Million) Forecast by Country, 2020-2035
  • Table 23: Middle East & Africa Market Value (USD Million) Forecast by Type , 2020-2035
  • Table 24: Middle East & Africa Market Value (USD Million) Forecast by Application, 2020-2035

List of Figures

  • Figure 1: Global Market Pricing Analysis
  • Figure 2: Global Market Value (USD Million) Forecast 2020-2035
  • Figure 3: Global Market Value Share and BPS Analysis by Type , 2025 and 2035
  • Figure 4: Global Market Y-o-Y Growth Comparison by Type , 2025-2035
  • Figure 5: Global Market Attractiveness Analysis by Type
  • Figure 6: Global Market Value Share and BPS Analysis by Application, 2025 and 2035
  • Figure 7: Global Market Y-o-Y Growth Comparison by Application, 2025-2035
  • Figure 8: Global Market Attractiveness Analysis by Application
  • Figure 9: Global Market Value (USD Million) Share and BPS Analysis by Region, 2025 and 2035
  • Figure 10: Global Market Y-o-Y Growth Comparison by Region, 2025-2035
  • Figure 11: Global Market Attractiveness Analysis by Region
  • Figure 12: North America Market Incremental Dollar Opportunity, 2025-2035
  • Figure 13: Latin America Market Incremental Dollar Opportunity, 2025-2035
  • Figure 14: Western Europe Market Incremental Dollar Opportunity, 2025-2035
  • Figure 15: Eastern Europe Market Incremental Dollar Opportunity, 2025-2035
  • Figure 16: East Asia Market Incremental Dollar Opportunity, 2025-2035
  • Figure 17: South Asia and Pacific Market Incremental Dollar Opportunity, 2025-2035
  • Figure 18: Middle East & Africa Market Incremental Dollar Opportunity, 2025-2035
  • Figure 19: North America Market Value Share and BPS Analysis by Country, 2025 and 2035
  • Figure 20: North America Market Value Share and BPS Analysis by Type , 2025 and 2035
  • Figure 21: North America Market Y-o-Y Growth Comparison by Type , 2025-2035
  • Figure 22: North America Market Attractiveness Analysis by Type
  • Figure 23: North America Market Value Share and BPS Analysis by Application, 2025 and 2035
  • Figure 24: North America Market Y-o-Y Growth Comparison by Application, 2025-2035
  • Figure 25: North America Market Attractiveness Analysis by Application
  • Figure 26: Latin America Market Value Share and BPS Analysis by Country, 2025 and 2035
  • Figure 27: Latin America Market Value Share and BPS Analysis by Type , 2025 and 2035
  • Figure 28: Latin America Market Y-o-Y Growth Comparison by Type , 2025-2035
  • Figure 29: Latin America Market Attractiveness Analysis by Type
  • Figure 30: Latin America Market Value Share and BPS Analysis by Application, 2025 and 2035
  • Figure 31: Latin America Market Y-o-Y Growth Comparison by Application, 2025-2035
  • Figure 32: Latin America Market Attractiveness Analysis by Application
  • Figure 33: Western Europe Market Value Share and BPS Analysis by Country, 2025 and 2035
  • Figure 34: Western Europe Market Value Share and BPS Analysis by Type , 2025 and 2035
  • Figure 35: Western Europe Market Y-o-Y Growth Comparison by Type , 2025-2035
  • Figure 36: Western Europe Market Attractiveness Analysis by Type
  • Figure 37: Western Europe Market Value Share and BPS Analysis by Application, 2025 and 2035
  • Figure 38: Western Europe Market Y-o-Y Growth Comparison by Application, 2025-2035
  • Figure 39: Western Europe Market Attractiveness Analysis by Application
  • Figure 40: Eastern Europe Market Value Share and BPS Analysis by Country, 2025 and 2035
  • Figure 41: Eastern Europe Market Value Share and BPS Analysis by Type , 2025 and 2035
  • Figure 42: Eastern Europe Market Y-o-Y Growth Comparison by Type , 2025-2035
  • Figure 43: Eastern Europe Market Attractiveness Analysis by Type
  • Figure 44: Eastern Europe Market Value Share and BPS Analysis by Application, 2025 and 2035
  • Figure 45: Eastern Europe Market Y-o-Y Growth Comparison by Application, 2025-2035
  • Figure 46: Eastern Europe Market Attractiveness Analysis by Application
  • Figure 47: East Asia Market Value Share and BPS Analysis by Country, 2025 and 2035
  • Figure 48: East Asia Market Value Share and BPS Analysis by Type , 2025 and 2035
  • Figure 49: East Asia Market Y-o-Y Growth Comparison by Type , 2025-2035
  • Figure 50: East Asia Market Attractiveness Analysis by Type
  • Figure 51: East Asia Market Value Share and BPS Analysis by Application, 2025 and 2035
  • Figure 52: East Asia Market Y-o-Y Growth Comparison by Application, 2025-2035
  • Figure 53: East Asia Market Attractiveness Analysis by Application
  • Figure 54: South Asia and Pacific Market Value Share and BPS Analysis by Country, 2025 and 2035
  • Figure 55: South Asia and Pacific Market Value Share and BPS Analysis by Type , 2025 and 2035
  • Figure 56: South Asia and Pacific Market Y-o-Y Growth Comparison by Type , 2025-2035
  • Figure 57: South Asia and Pacific Market Attractiveness Analysis by Type
  • Figure 58: South Asia and Pacific Market Value Share and BPS Analysis by Application, 2025 and 2035
  • Figure 59: South Asia and Pacific Market Y-o-Y Growth Comparison by Application, 2025-2035
  • Figure 60: South Asia and Pacific Market Attractiveness Analysis by Application
  • Figure 61: Middle East & Africa Market Value Share and BPS Analysis by Country, 2025 and 2035
  • Figure 62: Middle East & Africa Market Value Share and BPS Analysis by Type , 2025 and 2035
  • Figure 63: Middle East & Africa Market Y-o-Y Growth Comparison by Type , 2025-2035
  • Figure 64: Middle East & Africa Market Attractiveness Analysis by Type
  • Figure 65: Middle East & Africa Market Value Share and BPS Analysis by Application, 2025 and 2035
  • Figure 66: Middle East & Africa Market Y-o-Y Growth Comparison by Application, 2025-2035
  • Figure 67: Middle East & Africa Market Attractiveness Analysis by Application
  • Figure 68: Global Market - Tier Structure Analysis
  • Figure 69: Global Market - Company Share Analysis

Frequently Asked Questions

How big is the conductive inks market in 2025?

The global conductive inks market is estimated to be valued at USD 3.6 billion in 2025.

What will be the size of conductive inks market in 2035?

The market size for the conductive inks market is projected to reach USD 5.4 billion by 2035.

How much will be the conductive inks market growth between 2025 and 2035?

The conductive inks market is expected to grow at a 4.3% CAGR between 2025 and 2035.

What are the key product types in the conductive inks market?

The key product types in conductive inks market are silver conductive inks, carbon conductive inks, silver nano inks, silver chloride inks, dielectric inks and copper/ copper oxide inks.

Which application segment to contribute significant share in the conductive inks market in 2025?

In terms of application, solar panels segment to command 31.8% share in the conductive inks market in 2025.

Explore Similar Insights

Future Market Insights

Conductive Inks Market

Chat With MaRIA

Chat With

MaRIA

Hi There, I am MaRIA, Your Market Research Intelligence Assistant. How may I help you?