Preclinical MRI Equipment Market Size and Share Forecast Outlook 2025 to 2035

The Preclinical MRI Equipment Market is estimated to be valued at USD 1156.0 million in 2025 and is projected to reach USD 2274.1 million by 2035, registering a compound annual growth rate (CAGR) of 7.0% over the forecast period.
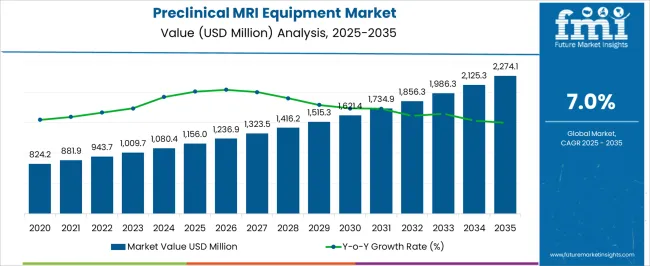
Quick Stats for Preclinical MRI Equipment Market

  • Preclinical MRI Equipment Market Value (2025): USD 1156.0 million
  • Preclinical MRI Equipment Market Forecast Value (2035): USD 2274.1 million
  • Preclinical MRI Equipment Market Forecast CAGR: 7.0%
  • Leading Segment in Preclinical MRI Equipment Market in 2025: Bench Top Preclinical MRI Equipment (55.1%)
  • Key Growth Regions in Preclinical MRI Equipment Market: North America, Asia-Pacific, Europe
  • Top Key Players in Preclinical MRI Equipment Market: Bruker Corporation, Agilent Technologies, Simens Healthcare, Aspect Imaging, FUJIFILM Holdings Corporation, MR Solutions Ltd, Perkin Elmer, Inc, Mediso Medical Imaging Systems
Preclinical Mri Equipment Market Market Value Analysis

Preclinical MRI Equipment Market Key Takeaways

Metric Value
Preclinical MRI Equipment Market Estimated Value in (2025 E) USD 1156.0 million
Preclinical MRI Equipment Market Forecast Value in (2035 F) USD 2274.1 million
Forecast CAGR (2025 to 2035) 7.0%

Why is the Preclinical MRI Equipment Market Growing?

The Preclinical MRI Equipment market is witnessing substantial growth due to the increasing importance of advanced imaging technologies in drug discovery, biomedical research, and disease modeling. Preclinical MRI equipment offers non-invasive and high-resolution imaging, enabling researchers to study disease progression, evaluate treatment efficacy, and perform longitudinal studies without harming animal subjects. Rising investments in pharmaceutical research, coupled with the need for early-stage drug validation, are fueling adoption.

Technological innovations, such as higher magnetic field strengths, faster acquisition times, and enhanced image reconstruction capabilities, are further enhancing system performance. Moreover, integration of MRI with complementary modalities such as PET or CT is providing more comprehensive insights into molecular and functional processes. Academic institutes, pharmaceutical companies, and research organizations are expanding their infrastructure to accommodate sophisticated imaging tools that accelerate translational research.

Additionally, regulatory bodies emphasize data reproducibility and precision in preclinical studies, supporting the adoption of advanced MRI systems As precision medicine gains prominence and the need for effective preclinical research intensifies, the market for preclinical MRI equipment is expected to maintain robust momentum, driven by innovation and expanding research applications.

Segmental Analysis

The preclinical mri equipment market is segmented by modality, application, retail end user, and geographic regions. By modality, preclinical mri equipment market is divided into Bench Top Preclinical MRI Equipment and Standalone Preclinical MRI Equipment. In terms of application, preclinical mri equipment market is classified into Oncology, Cardiology, Neurology, Inflammatory And Infectious Diseases, and Others. Based on retail end user, preclinical mri equipment market is segmented into Academic And Research Institutes, Biotechnology And Pharmaceutical Companies, Diagnostic Centers, and Contract Research Organizations. Regionally, the preclinical mri equipment industry is classified into North America, Latin America, Western Europe, Eastern Europe, Balkan & Baltic Countries, Russia & Belarus, Central Asia, East Asia, South Asia & Pacific, and the Middle East & Africa.
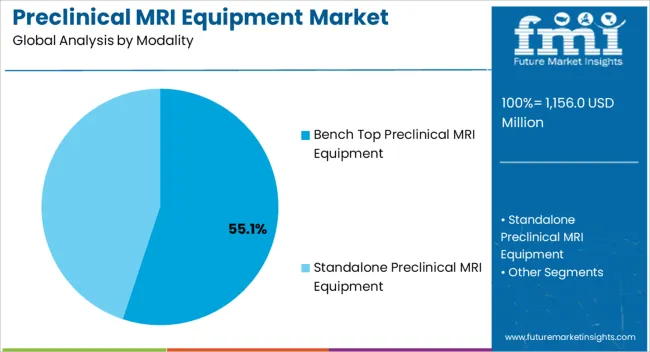
Insights into the Bench Top Preclinical MRI Equipment Modality Segment

Preclinical Mri Equipment Market Analysis By Modality

The bench top preclinical MRI equipment segment is projected to account for 55.1% of the market revenue share in 2025, positioning it as the leading modality. This dominance is driven by the segment’s compact design, lower installation costs, and operational efficiency compared to traditional large-scale MRI systems. Bench top systems are favored by academic and small-scale research institutes for their ability to deliver high-resolution imaging in limited laboratory spaces.

Advances in magnet technology, along with software-driven enhancements in imaging speed and accuracy, have reinforced the preference for bench top solutions. Their scalability and cost-effectiveness make them particularly attractive for institutions conducting a high volume of preclinical studies. Additionally, the integration of advanced imaging software enables researchers to perform detailed analyses and longitudinal monitoring with greater ease.

The versatility of bench top MRI systems in applications ranging from oncology to neuroscience is further supporting market expansion As demand for efficient and space-saving imaging solutions continues to rise, the bench top segment is expected to sustain its leadership, supported by strong adoption across global research facilities.
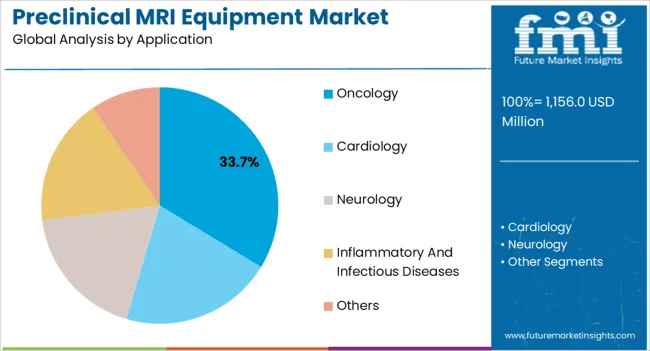
Insights into the Oncology Application Segment

Preclinical Mri Equipment Market Analysis By Application

The oncology application segment is expected to capture 33.7% of the market revenue share in 2025, making it the largest application area. Growth is being driven by the rising global incidence of cancer and the urgent need for precise preclinical models to evaluate new therapies. Preclinical MRI plays a critical role in oncology research by providing high-resolution visualization of tumor progression, angiogenesis, and treatment response.

Non-invasive imaging capabilities allow for longitudinal studies that reduce animal usage while improving data reproducibility. Furthermore, the ability to combine MRI with molecular imaging modalities enhances insights into tumor biology and therapeutic mechanisms. Pharmaceutical and biotechnology companies are increasingly adopting preclinical MRI to accelerate oncology drug discovery and optimize clinical trial success rates.

Academic institutions also rely heavily on these systems to advance cancer biology research The growing demand for personalized therapies and targeted drug delivery solutions further reinforces the importance of oncology applications With sustained investments in cancer research and the continuous evolution of imaging technologies, this segment is expected to maintain its dominant role in the preclinical MRI equipment market.
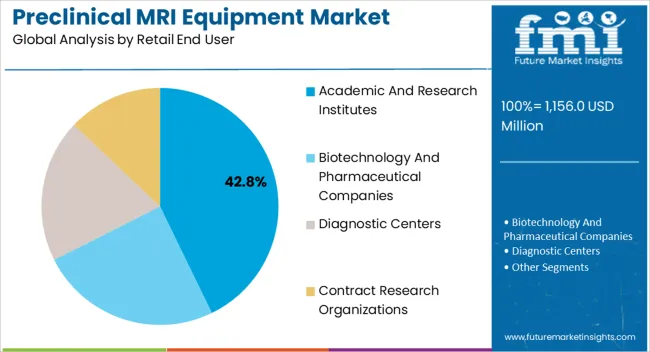
Insights into the Academic and Research Institutes End User Segment

Preclinical Mri Equipment Market Analysis By Retail End User

The academic and research institutes segment is anticipated to hold 42.8% of the market revenue share in 2025, establishing itself as the leading end user category. Academic institutions play a pivotal role in advancing biomedical research, and preclinical MRI systems have become essential tools for their scientific investigations. These institutes rely on advanced imaging equipment to explore disease mechanisms, test novel therapeutics, and publish reproducible findings that contribute to global medical knowledge.

Bench top MRI systems, in particular, are well suited for academic laboratories due to their affordability, compact design, and ease of use. Additionally, collaborations between universities and pharmaceutical companies are further boosting demand, as shared research facilities increasingly deploy MRI for translational studies. Government grants and funding for academic research are supporting infrastructure expansion and modernization, strengthening this segment’s leadership.

Moreover, training and educational programs on imaging technologies are creating skilled researchers who drive adoption As the global emphasis on biomedical innovation intensifies, academic and research institutes are expected to remain the largest end user, fostering continuous growth for preclinical MRI equipment.

Market Overview

Preclinical MRI Equipment Market Overview

Currently, non-invasive and in-vivo imaging modalities have become quite popular in the study of animal models longitudinally. Preclinical imaging is a non-invasive technique used to visualize living animals in order to study various diseases quantitatively, in real time, with the ability to monitor the disease progression rate at molecular level.

Suitable models for preclinical in-vivo studies include, positron emission tomography scanners (PET), single photon emission tomography scanners (SPECT), ultrasound, magnetic resonance imaging (MRI), compute tomography etc.

Preclinical MRI imaging technique employs use of large magnets that help generating magnetic fields, carefully targeted electromagnetic pulses, and computer software in order to obtain organ level anatomical images with high spatial resolution.

These generated magnetic fields results in formation of paramagnetic atoms including hydrogen, gadolinium, and manganese created by the radiofrequency (RF) coils inside the MRI machine. The machine then captures the relaxation of the atoms at the time when the RF pulse is ceased thus generating an image based on the resonance characteristic of the body part being studied.

The preclinical MRI equipment’s are used in study of various life threatening disorders including cancer, cardiovascular disorders, neurological and infectious and inflammatory diseases etc. Apart from this the device can also be used in the transitional research and new drug development.
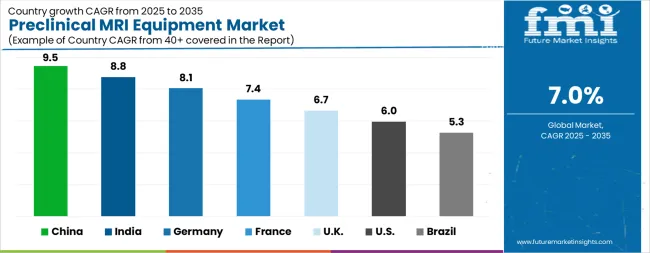
Analysis of Preclinical MRI Equipment Market By Key Countries

Preclinical Mri Equipment Market Cagr Analysis By Country
Country CAGR
China 9.5%
India 8.8%
Germany 8.1%
France 7.4%
UK 6.7%
USA 6.0%
Brazil 5.3%

Country-wise Analysis

The Preclinical MRI Equipment Market is expected to register a CAGR of 7.0% during the forecast period, exhibiting varied country level momentum. China leads with the highest CAGR of 9.5%, followed by India at 8.8%. Developed markets such as Germany, France, and the UK continue to expand steadily, while the USA is likely to grow at consistent rates. Brazil posts the lowest CAGR at 5.3%, yet still underscores a broadly positive trajectory for the global Preclinical MRI Equipment Market. In 2024, Germany held a dominant revenue in the Western Europe market and is expected to grow with a CAGR of 8.1%. The USA Preclinical MRI Equipment Market is estimated to be valued at USD 419.2 million in 2025 and is anticipated to reach a valuation of USD 747.1 million by 2035. Sales are projected to rise at a CAGR of 6.0% over the forecast period between 2025 and 2035. While Japan and South Korea markets are estimated to be valued at USD 61.8 million and USD 32.4 million respectively in 2025.
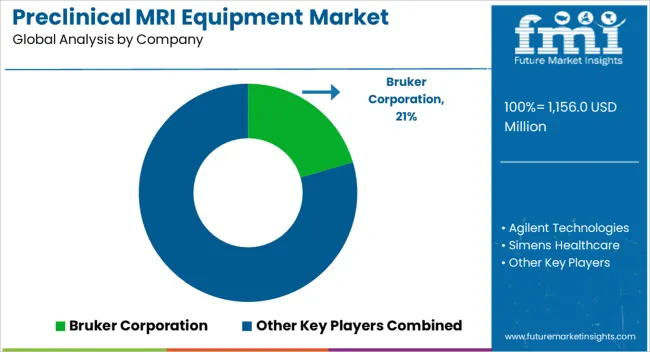
Key Players in the Preclinical MRI Equipment Market

Preclinical Mri Equipment Market Analysis By Company

  • Bruker Corporation
  • Agilent Technologies
  • Simens Healthcare
  • Aspect Imaging
  • FUJIFILM Holdings Corporation
  • MR Solutions Ltd
  • Perkin Elmer, Inc
  • Mediso Medical Imaging Systems

Scope of the Report

Item Value
Quantitative Units USD 1156.0 Million
Modality Bench Top Preclinical MRI Equipment and Standalone Preclinical MRI Equipment
Application Oncology, Cardiology, Neurology, Inflammatory And Infectious Diseases, and Others
Retail End User Academic And Research Institutes, Biotechnology And Pharmaceutical Companies, Diagnostic Centers, and Contract Research Organizations
Regions Covered North America, Europe, Asia-Pacific, Latin America, Middle East & Africa
Country Covered United States, Canada, Germany, France, United Kingdom, China, Japan, India, Brazil, South Africa
Key Companies Profiled Bruker Corporation, Agilent Technologies, Simens Healthcare, Aspect Imaging, FUJIFILM Holdings Corporation, MR Solutions Ltd, Perkin Elmer, Inc, and Mediso Medical Imaging Systems

Preclinical MRI Equipment Market by Segments

Modality:

  • Bench Top Preclinical MRI Equipment
  • Standalone Preclinical MRI Equipment

Application:

  • Oncology
  • Cardiology
  • Neurology
  • Inflammatory And Infectious Diseases
  • Others

Retail End User:

  • Academic And Research Institutes
  • Biotechnology And Pharmaceutical Companies
  • Diagnostic Centers
  • Contract Research Organizations

Region:

  • North America
    • USA
    • Canada
    • Mexico
  • Latin America
    • Brazil
    • Chile
    • Rest of Latin America
  • Western Europe
    • Germany
    • UK
    • Italy
    • Spain
    • France
    • Nordic
    • BENELUX
    • Rest of Western Europe
  • Eastern Europe
    • Russia
    • Poland
    • Hungary
    • Balkan & Baltic
    • Rest of Eastern Europe
  • East Asia
    • China
    • Japan
    • South Korea
  • South Asia and Pacific
    • India
    • ASEAN
    • Australia & New Zealand
    • Rest of South Asia and Pacific
  • Middle East & Africa
    • Kingdom of Saudi Arabia
    • Other GCC Countries
    • Turkiye
    • South Africa
    • Other African Union
    • Rest of Middle East & Africa

Table of Content

  1. Executive Summary
    • Global Market Outlook
    • Demand-side Trends
    • Supply-side Trends
    • Technology Roadmap Analysis
    • Analysis and Recommendations
  2. Market Overview
    • Market Coverage / Taxonomy
    • Market Definition / Scope / Limitations
  3. Market Background
    • Market Dynamics
      • Drivers
      • Restraints
      • Opportunity
      • Trends
    • Scenario Forecast
      • Demand in Optimistic Scenario
      • Demand in Likely Scenario
      • Demand in Conservative Scenario
    • Opportunity Map Analysis
    • Product Life Cycle Analysis
    • Supply Chain Analysis
    • Investment Feasibility Matrix
    • Value Chain Analysis
    • PESTLE and Porter’s Analysis
    • Regulatory Landscape
    • Regional Parent Market Outlook
    • Production and Consumption Statistics
    • Import and Export Statistics
  4. Global Market Analysis 2020-2024 and Forecast, 2025-2035
    • Historical Market Size Value (USD Million) Analysis, 2020-2024
    • Current and Future Market Size Value (USD Million) Projections, 2025-2035
      • Y-o-Y Growth Trend Analysis
      • Absolute $ Opportunity Analysis
  5. Global Market Pricing Analysis 2020-2024 and Forecast 2025-2035
  6. Global Market Analysis 2020-2024 and Forecast 2025-2035, By Modality
    • Introduction / Key Findings
    • Historical Market Size Value (USD Million) Analysis By Modality , 2020-2024
    • Current and Future Market Size Value (USD Million) Analysis and Forecast By Modality , 2025-2035
      • Bench Top Preclinical MRI Equipment
      • Standalone Preclinical MRI Equipment
    • Y-o-Y Growth Trend Analysis By Modality , 2020-2024
    • Absolute $ Opportunity Analysis By Modality , 2025-2035
  7. Global Market Analysis 2020-2024 and Forecast 2025-2035, By Application
    • Introduction / Key Findings
    • Historical Market Size Value (USD Million) Analysis By Application, 2020-2024
    • Current and Future Market Size Value (USD Million) Analysis and Forecast By Application, 2025-2035
      • Oncology
      • Cardiology
      • Neurology
      • Inflammatory And Infectious Diseases
      • Others
    • Y-o-Y Growth Trend Analysis By Application, 2020-2024
    • Absolute $ Opportunity Analysis By Application, 2025-2035
  8. Global Market Analysis 2020-2024 and Forecast 2025-2035, By Retail End User
    • Introduction / Key Findings
    • Historical Market Size Value (USD Million) Analysis By Retail End User, 2020-2024
    • Current and Future Market Size Value (USD Million) Analysis and Forecast By Retail End User, 2025-2035
      • Academic And Research Institutes
      • Biotechnology And Pharmaceutical Companies
      • Diagnostic Centers
      • Contract Research Organizations
    • Y-o-Y Growth Trend Analysis By Retail End User, 2020-2024
    • Absolute $ Opportunity Analysis By Retail End User, 2025-2035
  9. Global Market Analysis 2020-2024 and Forecast 2025-2035, By Region
    • Introduction
    • Historical Market Size Value (USD Million) Analysis By Region, 2020-2024
    • Current Market Size Value (USD Million) Analysis and Forecast By Region, 2025-2035
      • North America
      • Latin America
      • Western Europe
      • Eastern Europe
      • East Asia
      • South Asia and Pacific
      • Middle East & Africa
    • Market Attractiveness Analysis By Region
  10. North America Market Analysis 2020-2024 and Forecast 2025-2035, By Country
    • Historical Market Size Value (USD Million) Trend Analysis By Market Taxonomy, 2020-2024
    • Market Size Value (USD Million) Forecast By Market Taxonomy, 2025-2035
      • By Country
        • USA
        • Canada
        • Mexico
      • By Modality
      • By Application
      • By Retail End User
    • Market Attractiveness Analysis
      • By Country
      • By Modality
      • By Application
      • By Retail End User
    • Key Takeaways
  11. Latin America Market Analysis 2020-2024 and Forecast 2025-2035, By Country
    • Historical Market Size Value (USD Million) Trend Analysis By Market Taxonomy, 2020-2024
    • Market Size Value (USD Million) Forecast By Market Taxonomy, 2025-2035
      • By Country
        • Brazil
        • Chile
        • Rest of Latin America
      • By Modality
      • By Application
      • By Retail End User
    • Market Attractiveness Analysis
      • By Country
      • By Modality
      • By Application
      • By Retail End User
    • Key Takeaways
  12. Western Europe Market Analysis 2020-2024 and Forecast 2025-2035, By Country
    • Historical Market Size Value (USD Million) Trend Analysis By Market Taxonomy, 2020-2024
    • Market Size Value (USD Million) Forecast By Market Taxonomy, 2025-2035
      • By Country
        • Germany
        • UK
        • Italy
        • Spain
        • France
        • Nordic
        • BENELUX
        • Rest of Western Europe
      • By Modality
      • By Application
      • By Retail End User
    • Market Attractiveness Analysis
      • By Country
      • By Modality
      • By Application
      • By Retail End User
    • Key Takeaways
  13. Eastern Europe Market Analysis 2020-2024 and Forecast 2025-2035, By Country
    • Historical Market Size Value (USD Million) Trend Analysis By Market Taxonomy, 2020-2024
    • Market Size Value (USD Million) Forecast By Market Taxonomy, 2025-2035
      • By Country
        • Russia
        • Poland
        • Hungary
        • Balkan & Baltic
        • Rest of Eastern Europe
      • By Modality
      • By Application
      • By Retail End User
    • Market Attractiveness Analysis
      • By Country
      • By Modality
      • By Application
      • By Retail End User
    • Key Takeaways
  14. East Asia Market Analysis 2020-2024 and Forecast 2025-2035, By Country
    • Historical Market Size Value (USD Million) Trend Analysis By Market Taxonomy, 2020-2024
    • Market Size Value (USD Million) Forecast By Market Taxonomy, 2025-2035
      • By Country
        • China
        • Japan
        • South Korea
      • By Modality
      • By Application
      • By Retail End User
    • Market Attractiveness Analysis
      • By Country
      • By Modality
      • By Application
      • By Retail End User
    • Key Takeaways
  15. South Asia and Pacific Market Analysis 2020-2024 and Forecast 2025-2035, By Country
    • Historical Market Size Value (USD Million) Trend Analysis By Market Taxonomy, 2020-2024
    • Market Size Value (USD Million) Forecast By Market Taxonomy, 2025-2035
      • By Country
        • India
        • ASEAN
        • Australia & New Zealand
        • Rest of South Asia and Pacific
      • By Modality
      • By Application
      • By Retail End User
    • Market Attractiveness Analysis
      • By Country
      • By Modality
      • By Application
      • By Retail End User
    • Key Takeaways
  16. Middle East & Africa Market Analysis 2020-2024 and Forecast 2025-2035, By Country
    • Historical Market Size Value (USD Million) Trend Analysis By Market Taxonomy, 2020-2024
    • Market Size Value (USD Million) Forecast By Market Taxonomy, 2025-2035
      • By Country
        • Kingdom of Saudi Arabia
        • Other GCC Countries
        • Turkiye
        • South Africa
        • Other African Union
        • Rest of Middle East & Africa
      • By Modality
      • By Application
      • By Retail End User
    • Market Attractiveness Analysis
      • By Country
      • By Modality
      • By Application
      • By Retail End User
    • Key Takeaways
  17. Key Countries Market Analysis
    • USA
      • Pricing Analysis
      • Market Share Analysis, 2024
        • By Modality
        • By Application
        • By Retail End User
    • Canada
      • Pricing Analysis
      • Market Share Analysis, 2024
        • By Modality
        • By Application
        • By Retail End User
    • Mexico
      • Pricing Analysis
      • Market Share Analysis, 2024
        • By Modality
        • By Application
        • By Retail End User
    • Brazil
      • Pricing Analysis
      • Market Share Analysis, 2024
        • By Modality
        • By Application
        • By Retail End User
    • Chile
      • Pricing Analysis
      • Market Share Analysis, 2024
        • By Modality
        • By Application
        • By Retail End User
    • Germany
      • Pricing Analysis
      • Market Share Analysis, 2024
        • By Modality
        • By Application
        • By Retail End User
    • UK
      • Pricing Analysis
      • Market Share Analysis, 2024
        • By Modality
        • By Application
        • By Retail End User
    • Italy
      • Pricing Analysis
      • Market Share Analysis, 2024
        • By Modality
        • By Application
        • By Retail End User
    • Spain
      • Pricing Analysis
      • Market Share Analysis, 2024
        • By Modality
        • By Application
        • By Retail End User
    • France
      • Pricing Analysis
      • Market Share Analysis, 2024
        • By Modality
        • By Application
        • By Retail End User
    • India
      • Pricing Analysis
      • Market Share Analysis, 2024
        • By Modality
        • By Application
        • By Retail End User
    • ASEAN
      • Pricing Analysis
      • Market Share Analysis, 2024
        • By Modality
        • By Application
        • By Retail End User
    • Australia & New Zealand
      • Pricing Analysis
      • Market Share Analysis, 2024
        • By Modality
        • By Application
        • By Retail End User
    • China
      • Pricing Analysis
      • Market Share Analysis, 2024
        • By Modality
        • By Application
        • By Retail End User
    • Japan
      • Pricing Analysis
      • Market Share Analysis, 2024
        • By Modality
        • By Application
        • By Retail End User
    • South Korea
      • Pricing Analysis
      • Market Share Analysis, 2024
        • By Modality
        • By Application
        • By Retail End User
    • Russia
      • Pricing Analysis
      • Market Share Analysis, 2024
        • By Modality
        • By Application
        • By Retail End User
    • Poland
      • Pricing Analysis
      • Market Share Analysis, 2024
        • By Modality
        • By Application
        • By Retail End User
    • Hungary
      • Pricing Analysis
      • Market Share Analysis, 2024
        • By Modality
        • By Application
        • By Retail End User
    • Kingdom of Saudi Arabia
      • Pricing Analysis
      • Market Share Analysis, 2024
        • By Modality
        • By Application
        • By Retail End User
    • Turkiye
      • Pricing Analysis
      • Market Share Analysis, 2024
        • By Modality
        • By Application
        • By Retail End User
    • South Africa
      • Pricing Analysis
      • Market Share Analysis, 2024
        • By Modality
        • By Application
        • By Retail End User
  18. Market Structure Analysis
    • Competition Dashboard
    • Competition Benchmarking
    • Market Share Analysis of Top Players
      • By Regional
      • By Modality
      • By Application
      • By Retail End User
  19. Competition Analysis
    • Competition Deep Dive
      • Bruker Corporation
        • Overview
        • Product Portfolio
        • Profitability by Market Segments (Product/Age /Sales Channel/Region)
        • Sales Footprint
        • Strategy Overview
          • Marketing Strategy
          • Product Strategy
          • Channel Strategy
      • Agilent Technologies
      • Simens Healthcare
      • Aspect Imaging
      • FUJIFILM Holdings Corporation
      • MR Solutions Ltd
      • Perkin Elmer, Inc
      • Mediso Medical Imaging Systems
  20. Assumptions & Acronyms Used
  21. Research Methodology

List of Tables

  • Table 1: Global Market Value (USD Million) Forecast by Region, 2020-2035
  • Table 2: Global Market Value (USD Million) Forecast by Modality , 2020-2035
  • Table 3: Global Market Value (USD Million) Forecast by Application, 2020-2035
  • Table 4: Global Market Value (USD Million) Forecast by Retail End User, 2020-2035
  • Table 5: North America Market Value (USD Million) Forecast by Country, 2020-2035
  • Table 6: North America Market Value (USD Million) Forecast by Modality , 2020-2035
  • Table 7: North America Market Value (USD Million) Forecast by Application, 2020-2035
  • Table 8: North America Market Value (USD Million) Forecast by Retail End User, 2020-2035
  • Table 9: Latin America Market Value (USD Million) Forecast by Country, 2020-2035
  • Table 10: Latin America Market Value (USD Million) Forecast by Modality , 2020-2035
  • Table 11: Latin America Market Value (USD Million) Forecast by Application, 2020-2035
  • Table 12: Latin America Market Value (USD Million) Forecast by Retail End User, 2020-2035
  • Table 13: Western Europe Market Value (USD Million) Forecast by Country, 2020-2035
  • Table 14: Western Europe Market Value (USD Million) Forecast by Modality , 2020-2035
  • Table 15: Western Europe Market Value (USD Million) Forecast by Application, 2020-2035
  • Table 16: Western Europe Market Value (USD Million) Forecast by Retail End User, 2020-2035
  • Table 17: Eastern Europe Market Value (USD Million) Forecast by Country, 2020-2035
  • Table 18: Eastern Europe Market Value (USD Million) Forecast by Modality , 2020-2035
  • Table 19: Eastern Europe Market Value (USD Million) Forecast by Application, 2020-2035
  • Table 20: Eastern Europe Market Value (USD Million) Forecast by Retail End User, 2020-2035
  • Table 21: East Asia Market Value (USD Million) Forecast by Country, 2020-2035
  • Table 22: East Asia Market Value (USD Million) Forecast by Modality , 2020-2035
  • Table 23: East Asia Market Value (USD Million) Forecast by Application, 2020-2035
  • Table 24: East Asia Market Value (USD Million) Forecast by Retail End User, 2020-2035
  • Table 25: South Asia and Pacific Market Value (USD Million) Forecast by Country, 2020-2035
  • Table 26: South Asia and Pacific Market Value (USD Million) Forecast by Modality , 2020-2035
  • Table 27: South Asia and Pacific Market Value (USD Million) Forecast by Application, 2020-2035
  • Table 28: South Asia and Pacific Market Value (USD Million) Forecast by Retail End User, 2020-2035
  • Table 29: Middle East & Africa Market Value (USD Million) Forecast by Country, 2020-2035
  • Table 30: Middle East & Africa Market Value (USD Million) Forecast by Modality , 2020-2035
  • Table 31: Middle East & Africa Market Value (USD Million) Forecast by Application, 2020-2035
  • Table 32: Middle East & Africa Market Value (USD Million) Forecast by Retail End User, 2020-2035

List of Figures

  • Figure 1: Global Market Pricing Analysis
  • Figure 2: Global Market Value (USD Million) Forecast 2020-2035
  • Figure 3: Global Market Value Share and BPS Analysis by Modality , 2025 and 2035
  • Figure 4: Global Market Y-o-Y Growth Comparison by Modality , 2025-2035
  • Figure 5: Global Market Attractiveness Analysis by Modality
  • Figure 6: Global Market Value Share and BPS Analysis by Application, 2025 and 2035
  • Figure 7: Global Market Y-o-Y Growth Comparison by Application, 2025-2035
  • Figure 8: Global Market Attractiveness Analysis by Application
  • Figure 9: Global Market Value Share and BPS Analysis by Retail End User, 2025 and 2035
  • Figure 10: Global Market Y-o-Y Growth Comparison by Retail End User, 2025-2035
  • Figure 11: Global Market Attractiveness Analysis by Retail End User
  • Figure 12: Global Market Value (USD Million) Share and BPS Analysis by Region, 2025 and 2035
  • Figure 13: Global Market Y-o-Y Growth Comparison by Region, 2025-2035
  • Figure 14: Global Market Attractiveness Analysis by Region
  • Figure 15: North America Market Incremental Dollar Opportunity, 2025-2035
  • Figure 16: Latin America Market Incremental Dollar Opportunity, 2025-2035
  • Figure 17: Western Europe Market Incremental Dollar Opportunity, 2025-2035
  • Figure 18: Eastern Europe Market Incremental Dollar Opportunity, 2025-2035
  • Figure 19: East Asia Market Incremental Dollar Opportunity, 2025-2035
  • Figure 20: South Asia and Pacific Market Incremental Dollar Opportunity, 2025-2035
  • Figure 21: Middle East & Africa Market Incremental Dollar Opportunity, 2025-2035
  • Figure 22: North America Market Value Share and BPS Analysis by Country, 2025 and 2035
  • Figure 23: North America Market Value Share and BPS Analysis by Modality , 2025 and 2035
  • Figure 24: North America Market Y-o-Y Growth Comparison by Modality , 2025-2035
  • Figure 25: North America Market Attractiveness Analysis by Modality
  • Figure 26: North America Market Value Share and BPS Analysis by Application, 2025 and 2035
  • Figure 27: North America Market Y-o-Y Growth Comparison by Application, 2025-2035
  • Figure 28: North America Market Attractiveness Analysis by Application
  • Figure 29: North America Market Value Share and BPS Analysis by Retail End User, 2025 and 2035
  • Figure 30: North America Market Y-o-Y Growth Comparison by Retail End User, 2025-2035
  • Figure 31: North America Market Attractiveness Analysis by Retail End User
  • Figure 32: Latin America Market Value Share and BPS Analysis by Country, 2025 and 2035
  • Figure 33: Latin America Market Value Share and BPS Analysis by Modality , 2025 and 2035
  • Figure 34: Latin America Market Y-o-Y Growth Comparison by Modality , 2025-2035
  • Figure 35: Latin America Market Attractiveness Analysis by Modality
  • Figure 36: Latin America Market Value Share and BPS Analysis by Application, 2025 and 2035
  • Figure 37: Latin America Market Y-o-Y Growth Comparison by Application, 2025-2035
  • Figure 38: Latin America Market Attractiveness Analysis by Application
  • Figure 39: Latin America Market Value Share and BPS Analysis by Retail End User, 2025 and 2035
  • Figure 40: Latin America Market Y-o-Y Growth Comparison by Retail End User, 2025-2035
  • Figure 41: Latin America Market Attractiveness Analysis by Retail End User
  • Figure 42: Western Europe Market Value Share and BPS Analysis by Country, 2025 and 2035
  • Figure 43: Western Europe Market Value Share and BPS Analysis by Modality , 2025 and 2035
  • Figure 44: Western Europe Market Y-o-Y Growth Comparison by Modality , 2025-2035
  • Figure 45: Western Europe Market Attractiveness Analysis by Modality
  • Figure 46: Western Europe Market Value Share and BPS Analysis by Application, 2025 and 2035
  • Figure 47: Western Europe Market Y-o-Y Growth Comparison by Application, 2025-2035
  • Figure 48: Western Europe Market Attractiveness Analysis by Application
  • Figure 49: Western Europe Market Value Share and BPS Analysis by Retail End User, 2025 and 2035
  • Figure 50: Western Europe Market Y-o-Y Growth Comparison by Retail End User, 2025-2035
  • Figure 51: Western Europe Market Attractiveness Analysis by Retail End User
  • Figure 52: Eastern Europe Market Value Share and BPS Analysis by Country, 2025 and 2035
  • Figure 53: Eastern Europe Market Value Share and BPS Analysis by Modality , 2025 and 2035
  • Figure 54: Eastern Europe Market Y-o-Y Growth Comparison by Modality , 2025-2035
  • Figure 55: Eastern Europe Market Attractiveness Analysis by Modality
  • Figure 56: Eastern Europe Market Value Share and BPS Analysis by Application, 2025 and 2035
  • Figure 57: Eastern Europe Market Y-o-Y Growth Comparison by Application, 2025-2035
  • Figure 58: Eastern Europe Market Attractiveness Analysis by Application
  • Figure 59: Eastern Europe Market Value Share and BPS Analysis by Retail End User, 2025 and 2035
  • Figure 60: Eastern Europe Market Y-o-Y Growth Comparison by Retail End User, 2025-2035
  • Figure 61: Eastern Europe Market Attractiveness Analysis by Retail End User
  • Figure 62: East Asia Market Value Share and BPS Analysis by Country, 2025 and 2035
  • Figure 63: East Asia Market Value Share and BPS Analysis by Modality , 2025 and 2035
  • Figure 64: East Asia Market Y-o-Y Growth Comparison by Modality , 2025-2035
  • Figure 65: East Asia Market Attractiveness Analysis by Modality
  • Figure 66: East Asia Market Value Share and BPS Analysis by Application, 2025 and 2035
  • Figure 67: East Asia Market Y-o-Y Growth Comparison by Application, 2025-2035
  • Figure 68: East Asia Market Attractiveness Analysis by Application
  • Figure 69: East Asia Market Value Share and BPS Analysis by Retail End User, 2025 and 2035
  • Figure 70: East Asia Market Y-o-Y Growth Comparison by Retail End User, 2025-2035
  • Figure 71: East Asia Market Attractiveness Analysis by Retail End User
  • Figure 72: South Asia and Pacific Market Value Share and BPS Analysis by Country, 2025 and 2035
  • Figure 73: South Asia and Pacific Market Value Share and BPS Analysis by Modality , 2025 and 2035
  • Figure 74: South Asia and Pacific Market Y-o-Y Growth Comparison by Modality , 2025-2035
  • Figure 75: South Asia and Pacific Market Attractiveness Analysis by Modality
  • Figure 76: South Asia and Pacific Market Value Share and BPS Analysis by Application, 2025 and 2035
  • Figure 77: South Asia and Pacific Market Y-o-Y Growth Comparison by Application, 2025-2035
  • Figure 78: South Asia and Pacific Market Attractiveness Analysis by Application
  • Figure 79: South Asia and Pacific Market Value Share and BPS Analysis by Retail End User, 2025 and 2035
  • Figure 80: South Asia and Pacific Market Y-o-Y Growth Comparison by Retail End User, 2025-2035
  • Figure 81: South Asia and Pacific Market Attractiveness Analysis by Retail End User
  • Figure 82: Middle East & Africa Market Value Share and BPS Analysis by Country, 2025 and 2035
  • Figure 83: Middle East & Africa Market Value Share and BPS Analysis by Modality , 2025 and 2035
  • Figure 84: Middle East & Africa Market Y-o-Y Growth Comparison by Modality , 2025-2035
  • Figure 85: Middle East & Africa Market Attractiveness Analysis by Modality
  • Figure 86: Middle East & Africa Market Value Share and BPS Analysis by Application, 2025 and 2035
  • Figure 87: Middle East & Africa Market Y-o-Y Growth Comparison by Application, 2025-2035
  • Figure 88: Middle East & Africa Market Attractiveness Analysis by Application
  • Figure 89: Middle East & Africa Market Value Share and BPS Analysis by Retail End User, 2025 and 2035
  • Figure 90: Middle East & Africa Market Y-o-Y Growth Comparison by Retail End User, 2025-2035
  • Figure 91: Middle East & Africa Market Attractiveness Analysis by Retail End User
  • Figure 92: Global Market - Tier Structure Analysis
  • Figure 93: Global Market - Company Share Analysis

Frequently Asked Questions

How big is the preclinical MRI equipment market in 2025?

The global preclinical MRI equipment market is estimated to be valued at USD 1,156.0 million in 2025.

What will be the size of preclinical MRI equipment market in 2035?

The market size for the preclinical MRI equipment market is projected to reach USD 2,274.1 million by 2035.

How much will be the preclinical MRI equipment market growth between 2025 and 2035?

The preclinical MRI equipment market is expected to grow at a 7.0% CAGR between 2025 and 2035.

What are the key product types in the preclinical MRI equipment market?

The key product types in preclinical MRI equipment market are bench top preclinical MRI equipment and standalone preclinical MRI equipment.

Which application segment to contribute significant share in the preclinical MRI equipment market in 2025?

In terms of application, oncology segment to command 33.7% share in the preclinical MRI equipment market in 2025.

Explore Similar Insights

Future Market Insights

Preclinical MRI Equipment Market

Chat With

MaRIA

Hi There, I am MaRIA, Your Market Research Intelligence Assistant. How may I help you?