MRI-based Quantitative Biomarkers Market Forecast and Outlook 2025 to 2035

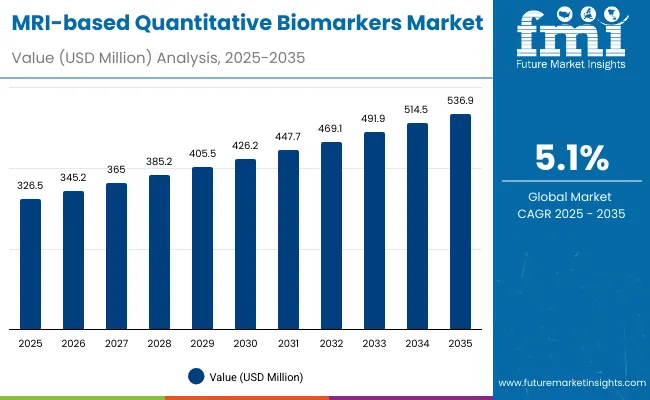
The MRI-based quantitative biomarkers market is projected to grow from USD 326.5 million in 2025 to approximately USD 536.9 million by 2035, recording an absolute increase of USD 210.4 million over the forecast period. This translates into a total growth of 64.4%, with the market forecast to expand at a compound annual growth rate (CAGR) of 5.1% between 2025 and 2035. The overall market size is expected to grow by nearly 1.6X during the same period, supported by increasing demand for precision medicine technologies, growing adoption of quantitative imaging techniques, and rising utilization of AI-powered diagnostic solutions across global healthcare and clinical research sectors.
Quick Stats for MRI-based Quantitative Biomarkers Market

  • MRI-based Quantitative Biomarkers Market Value (2025): USD 326.5 million
  • MRI-based Quantitative Biomarkers Market Forecast Value (2035): USD 536.9 million
  • MRI-based Quantitative Biomarkers Market Forecast CAGR: 5.1%
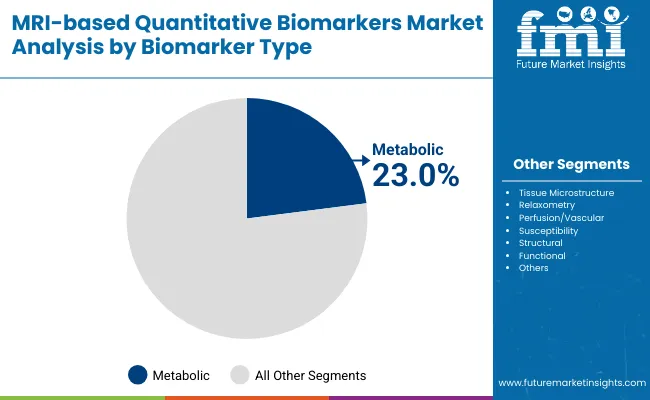
  • Leading Biomarker Type in MRI-based Quantitative Biomarkers Market: Metabolic (23.0%)
  • Key Growth Regions in MRI-based Quantitative Biomarkers Market: North America, Europe, and Asia Pacific
  • Top Players in MRI-based Quantitative Biomarkers Market: CaliberMRI, Olea Medical, Biosyn, Invitae, VIDA Diagnostics, Synthetic MR, Imbio

Mri Based Quantitative Biomarkers Market

MRI-based Quantitative Biomarkers Market Key Takeaways

Metric Value
Estimated Value in (2025E) USD 326.5 million
Forecast Value in (2035F) USD 536.9 million
Forecast CAGR (2025 to 2035) 5.1%

Between 2025 and 2030, the MRI-based quantitative biomarkers market is projected to expand from USD 326.5 million to USD 426.2 million, resulting in a value increase of USD 99.7 million, which represents 47.4% of the total forecast growth for the decade. This phase of development will be shaped by increasing precision medicine adoption, rising demand for quantitative imaging biomarkers, and growing utilization in clinical trial applications. Medical imaging technology manufacturers and biomarker specialists are expanding their AI integration capabilities to address the growing preference for automated quantitative analysis features in diagnostic imaging systems.

From 2030 to 2035, the market is forecast to grow from USD 426.2 million to USD 536.9 million, adding another USD 110.7 million, which constitutes 52.6% of the overall ten-year expansion. This period is expected to be characterized by the expansion of advanced quantitative imaging technologies, the integration of machine learning algorithms for enhanced biomarker analysis, and the development of specialized applications for personalized medicine. The growing emphasis on early disease detection and treatment monitoring will drive demand for sophisticated MRI-based quantitative biomarkers with enhanced accuracy capabilities and improved diagnostic precision.

Between 2020 and 2024, the MRI-based quantitative biomarkers market experienced steady growth, driven by increasing medical imaging technology investments and growing recognition of quantitative biomarkers' superior diagnostic capabilities across clinical research and healthcare applications. The market developed as healthcare providers recognized the potential for AI-powered quantitative analysis to enhance diagnostic accuracy while meeting modern precision medicine requirements for objective measurement standards. Technological advancement in imaging software and biomarker validation began emphasizing the critical importance of maintaining measurement precision while extending diagnostic capabilities and improving patient outcome prediction effectiveness.

Opportunity Pathways - MRI-based Quantitative Biomarkers Market

The MRI-based quantitative biomarkers market represents a rapidly emerging precision medicine opportunity at the intersection of medical imaging technology, artificial intelligence, and quantitative analysis, with the market projected to expand from USD 326.5 million in 2025 to USD 536.9 million by 2035 at a steady 5.1% CAGR-a 1.6X growth driven by accelerating precision medicine adoption, healthcare provider demand for objective diagnostic tools, and the integration of AI-powered quantitative analysis into routine clinical practice.

This convergence opportunity leverages the ubiquity of MRI imaging, the demand for personalized medicine approaches, and advances in computational analysis to create solutions that offer objective, quantitative measurements in traditionally subjective diagnostic assessments. Metabolic biomarkers lead with 23.0% market share due to their clinical utility in metabolic disorders and treatment monitoring, while diagnostic imaging centers dominate demand as healthcare facilities increasingly invest in advanced imaging capabilities. Geographic growth is strongest in India (7.6% CAGR) and China (6.9% CAGR), where healthcare modernization and medical imaging infrastructure development create ideal market conditions.
Mri Based Quantitative Biomarkers Market Oppournity Pathway

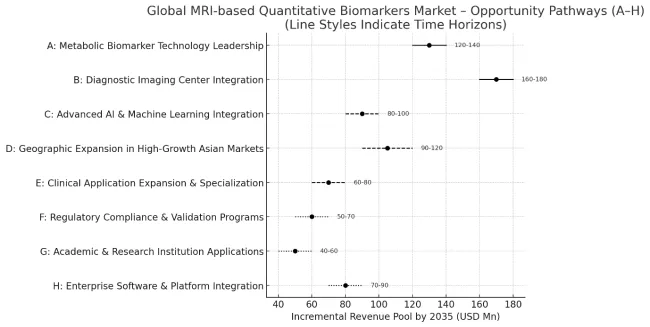
Pathway A - Metabolic Biomarker Technology Leadership. The dominant biomarker type offers superior clinical utility, established validation pathways, and proven diagnostic value essential for precision medicine applications. Companies developing advanced metabolic quantification algorithms with enhanced accuracy, standardized measurement protocols, and regulatory compliance capabilities will capture the leading technology segment. Expected revenue pool: USD 120-140 million.

Pathway B - Diagnostic Imaging Center Integration. The largest end-user segment benefits from growing healthcare provider investment in advanced imaging technologies and precision diagnostic capabilities. Providers developing comprehensive diagnostic solutions with seamless workflow integration, automated analysis features, and clinical decision support tools will dominate this primary market. Opportunity: USD 160-180 million.

Pathway C - Advanced AI and Machine Learning Integration. Next-generation products require sophisticated artificial intelligence capable of automated analysis, pattern recognition, and predictive modeling. Companies investing in deep learning algorithms, computer vision technologies, and clinical validation studies will create competitive differentiation and premium positioning. Revenue uplift: USD 80-100 million.

Pathway D - Geographic Expansion in High-Growth Asian Markets. India and China's rapid healthcare modernization and growing medical imaging adoption create substantial opportunities. Local partnerships, regulatory compliance strategies, and cost-effective implementation approaches enable market penetration in these high-growth regions. Pool: USD 90-120 million.

Pathway E - Clinical Application Expansion and Specialization. Modern healthcare demands specialized biomarkers for specific disease areas and treatment monitoring applications. Developing products with disease-specific algorithms, treatment response assessment capabilities, and longitudinal monitoring features addresses growing specialty medicine demands while improving patient outcomes. Expected upside: USD 60-80 million.

Pathway F - Regulatory Compliance and Validation Programs. Advanced products require comprehensive regulatory approval, clinical validation, and quality assurance systems. Solutions offering FDA clearance pathways, CE marking compliance, and robust clinical evidence packages create enhanced value propositions and market access advantages. USD 50-70 million.

Pathway G - Academic and Research Institution Applications. Universities and research centers represent growing opportunities for advanced quantitative analysis, clinical trial support, and biomarker discovery research. Developing specialized solutions for research applications, grant funding support, and collaborative research programs expands beyond clinical markets. Pool: USD 40-60 million.

Pathway H - Enterprise Software and Platform Integration. Healthcare systems demand comprehensive platforms that integrate with existing imaging infrastructure, electronic health records, and clinical workflows. Companies developing enterprise-grade solutions with comprehensive connectivity, scalability features, and healthcare IT integration will capture premium market segments. Expected revenue: USD 70-90 million.

Why is the MRI-based Quantitative Biomarkers Market Growing?

Market expansion is being supported by the increasing global demand for precision medicine solutions and the corresponding shift toward AI-powered diagnostic technologies that can provide superior measurement accuracy while meeting healthcare requirements for objective and quantitative clinical assessments.

Modern healthcare providers and research institutions are increasingly focused on incorporating MRI-based quantitative biomarkers to enhance diagnostic precision while satisfying demands for evidence-based medicine and standardized measurement protocols. MRI-based quantitative biomarkers' proven ability to deliver superior diagnostic accuracy, objective measurements, and reproducible results makes them essential tools for precision medicine applications and clinical research studies.

The growing emphasis on personalized medicine and objective diagnostic assessment is driving demand for high-quality MRI-based quantitative biomarker products that can support distinctive clinical applications and premium healthcare positioning across diagnostic imaging, clinical research, and pharmaceutical development categories.

Healthcare provider preference for technologies that combine imaging excellence with advanced quantitative capabilities is creating opportunities for innovative AI-powered implementations in both established and emerging precision medicine applications. The rising influence of artificial intelligence technologies and automated analysis systems is also contributing to increased adoption of premium MRI-based quantitative biomarker products that can provide authentic precision medicine integration characteristics.

Segmental Analysis

The market is segmented by biomarker type, application, end users, and region. The demand for biomarker type is divided into metabolic, tissue microstructure, relaxometry, perfusion/vascular, susceptibility, structural, functional, and others. Based on application, the market is categorized into neurology, oncology, cardiology, hepatology, musculoskeletal, and other applications. Based on end users, the market is segmented into diagnostic imaging centers, hospitals, specialty clinics, ambulatory surgical centers, academics & research institutes, and others. Regionally, the market is divided into North America, Europe, East Asia, South Asia & Pacific, Latin America, and the Middle East & Africa.
By Biomarker Type, the Metabolic Segment Accounts for 23.0% Market Share

Mri Based Quantitative Biomarkers Market By Biomarker Type

The metabolic biomarker segment is projected to account for 23.0% of the MRI-based quantitative biomarkers market in 2025, reaffirming its position as the leading biomarker type category. Medical imaging manufacturers and diagnostic technology producers increasingly utilize metabolic biomarkers for their superior clinical utility, established validation pathways, and ease of integration in precision medicine applications across diverse healthcare installations. Metabolic biomarker technology's standardized measurement protocols and proven diagnostic value directly address the clinical requirements for objective assessment and reproducible measurements in quantitative imaging operations.

This biomarker segment forms the foundation of modern precision medicine applications, as it represents the technology with the greatest clinical validation potential and established compatibility across multiple imaging platforms and clinical workflows. Manufacturer investments in metabolic biomarker optimization and clinical validation continue to strengthen adoption among medical imaging equipment producers. With healthcare providers prioritizing objective measurements and evidence-based diagnostics, metabolic biomarker systems align with both clinical utility objectives and diagnostic accuracy requirements, making them the central component of comprehensive quantitative imaging strategies.
By End Users, Diagnostic Imaging Centers Segment Leads Market Demand

Mri Based Quantitative Biomarkers Market By End Users

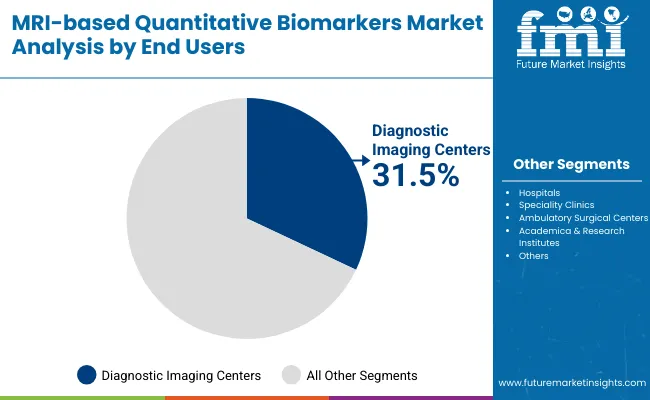
Diagnostic imaging centers are projected to represent the largest share of MRI-based quantitative biomarkers demand in 2025 at 31.5%, underscoring their critical role as the primary end-user for advanced imaging technologies in specialized diagnostic facilities and outpatient imaging operations. Healthcare administrators and imaging center operators prefer MRI-based quantitative biomarkers for their exceptional diagnostic capabilities, workflow integration features, and ability to maintain consistent quality standards while supporting modern precision medicine requirements during diagnostic imaging procedures. Positioned as essential tools for high-performance diagnostic imaging operations, MRI-based quantitative biomarkers offer both technological advancement and operational efficiency advantages.

The segment is supported by continuous growth in outpatient imaging demand and the growing availability of advanced quantitative analysis technologies that enable enhanced diagnostic capabilities and improved patient throughput at the diagnostic center level. Additionally, imaging centers are investing in premium diagnostic technologies to support competitive differentiation and specialized service offerings. As precision medicine adoption continues to expand and healthcare providers seek superior diagnostic solutions, diagnostic imaging centers will continue to dominate the end-user landscape while supporting technology advancement and clinical excellence optimization strategies.
By Application, Neurology Segment Leads Market Demand

Mri Based Quantitative Biomarkers Market By Application

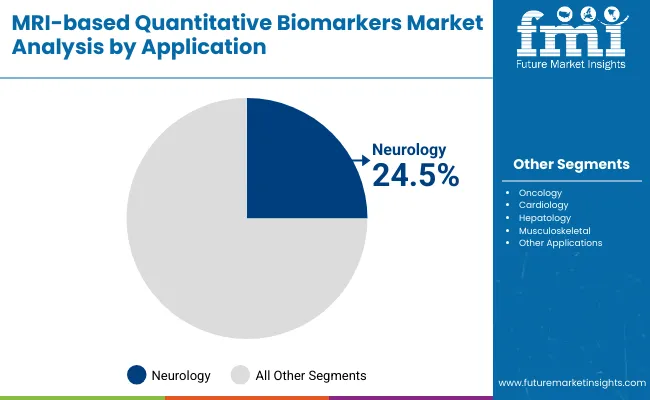
The neurology application segment is projected to account for 24.5% of the MRI-based quantitative biomarkers market in 2025, reaffirming its position as the leading application category. Medical imaging specialists and neurological research institutions increasingly utilize MRI-based quantitative biomarkers for their superior diagnostic capabilities in neurological disorders, brain imaging applications, and neurodegenerative disease monitoring across diverse clinical installations. Neurology application technology's established clinical protocols and proven diagnostic value directly address the medical requirements for objective neurological assessment and reproducible measurements in brain imaging operations.

This application segment forms the foundation of modern neurological diagnostics, as it represents the specialty with the greatest clinical validation potential and established compatibility across multiple neuroimaging platforms and clinical workflows. Healthcare investments in neurological biomarker optimization and clinical validation continue to strengthen adoption among medical imaging specialists. With healthcare providers prioritizing early detection of neurological conditions and treatment monitoring capabilities, neurology applications align with both clinical utility objectives and patient care requirements, making them the central component of comprehensive quantitative neuroimaging strategies.

What are the Drivers, Restraints, and Key Trends of the MRI-based Quantitative Biomarkers Market?

The MRI-based quantitative biomarkers market is advancing steadily due to increasing precision medicine adoption and growing demand for objective diagnostic solutions that emphasize superior measurement accuracy across clinical research and healthcare applications. However, the market faces challenges, including high implementation costs compared to conventional imaging analysis, technical complexity in quantitative algorithm development, and competition from alternative diagnostic technologies. Innovation in artificial intelligence integration and clinical validation continues to influence market development and expansion patterns.

Expansion of Advanced Precision Medicine Applications

The growing adoption of MRI-based quantitative biomarkers in comprehensive precision medicine programs and clinical research applications is enabling healthcare providers to develop solutions that provide distinctive diagnostic capabilities while commanding premium positioning and enhanced clinical value characteristics. Advanced applications provide superior measurement accuracy while allowing more sophisticated clinical assessment across various medical specialties and research segments. Healthcare providers are increasingly recognizing the competitive advantages of quantitative biomarker positioning for premium service development and precision medicine market penetration.

Integration of Artificial Intelligence and Machine Learning Programs

Modern MRI-based quantitative biomarker suppliers are incorporating advanced AI algorithms, automated analysis systems, and machine learning technologies to enhance diagnostic accuracy, improve measurement consistency, and meet healthcare demands for efficient and reliable quantitative analysis solutions. These programs improve product performance while enabling new applications, including predictive analytics and personalized treatment monitoring systems. Advanced AI integration also allows suppliers to support premium market positioning and technology leadership beyond traditional quantitative imaging products.
Analysis of the MRI-based Quantitative Biomarkers Market by Key Country

Mri Based Quantitative Biomarkers Market By Country

Country CAGR (2025 to 2035)
India 7.6%
China 6.9%
Brazil 6.0%
France 3.6%
UK 3.4%
USA 2.9%
Germany 2.7%

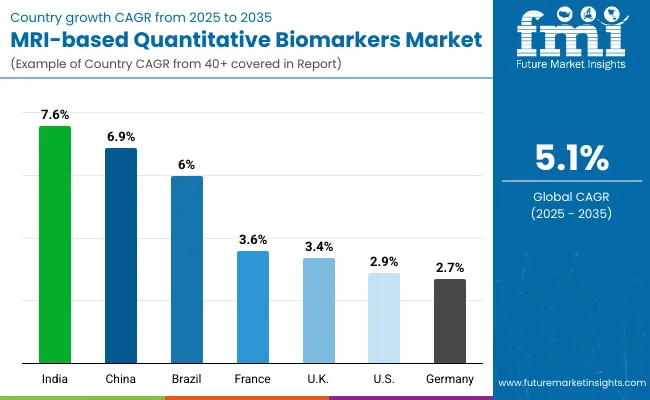
The MRI-based quantitative biomarkers market is experiencing steady growth globally, with India leading at a 7.6% CAGR through 2035, driven by the rapidly expanding healthcare infrastructure sector, significant investments in medical technology modernization, and increasing adoption of precision medicine systems. China follows at 6.9%, supported by growing healthcare technology demand, rising medical imaging investments, and expanding clinical research activities. Brazil shows growth at 6.0%, emphasizing healthcare infrastructure development and medical technology advancement.

France records 3.6%, focusing on established medical research applications and precision medicine development. The UK demonstrates 3.4% growth, prioritizing National Health Service modernization and advanced diagnostic technology innovation. The USA exhibits 2.9% growth, supported by established healthcare technology infrastructure and mature precision medicine adoption. Germany shows 2.7% growth, emphasizing precision manufacturing excellence and high-quality medical technology product development.

The report covers an in-depth analysis of 40+ countries; seven top-performing countries are highlighted below.

India Leads Global Market Growth with Healthcare Infrastructure Expansion

Revenue from MRI-based quantitative biomarkers in India is projected to exhibit exceptional growth with a CAGR of 7.6% through 2035, driven by the rapidly expanding healthcare infrastructure sector and significant government investments in medical technology modernization across major urban centers. The country's growing healthcare services market and increasing adoption of precision medicine technologies are creating substantial demand for quantitative imaging solutions in both public and private healthcare applications. Major healthcare technology manufacturers and medical imaging companies are establishing comprehensive research and distribution capabilities to serve both domestic consumption and regional export markets.

  • Rising healthcare infrastructure development and expanding medical imaging capabilities are driving demand for MRI-based quantitative biomarkers across healthcare providers, diagnostic imaging centers, and medical research institutions throughout major Indian metropolitan areas.
  • Strong government support for healthcare modernization and medical technology advancement is supporting the rapid adoption of precision medicine solutions among healthcare providers seeking to meet evolving patient care requirements and clinical excellence expectations.

China Demonstrates Strong Market Potential with Healthcare Technology Investment

Revenue from MRI-based quantitative biomarkers in China is expanding at a CAGR of 6.9%, supported by growing healthcare technology demand, increasing medical imaging investments, and expanding clinical research infrastructure with modern diagnostic capabilities. The country's developing precision medicine ecosystem and expanding healthcare technology infrastructure are driving demand for advanced quantitative analysis products across both urban healthcare facilities and research institutions. International medical technology companies and domestic healthcare manufacturers are establishing comprehensive manufacturing and distribution capabilities to address growing market demand for precision diagnostic solutions.

  • Rising healthcare technology adoption and expanding medical research capabilities are creating opportunities for MRI-based quantitative biomarker implementation across healthcare providers, medical research centers, and pharmaceutical companies in major Chinese cities.
  • Growing government focus on healthcare technology advancement and medical innovation development is driving the adoption of precision medicine technologies among healthcare institutions seeking to upgrade to modern diagnostic capabilities and specialized medical services.

Brazil Strengthens Market with Healthcare Infrastructure Development

Revenue from MRI-based quantitative biomarkers in Brazil is projected to grow at a CAGR of 6.0% through 2035, supported by the country's expanding healthcare infrastructure sector, growing medical technology applications, and increasing adoption of modern diagnostic technologies requiring quantitative analysis solutions. Brazilian healthcare providers and medical research institutions consistently seek innovative diagnostic technologies that enhance clinical capabilities for both healthcare delivery applications and medical research markets. The country's position as a regional healthcare hub continues to drive innovation in medical technology applications and clinical standards.

  • Growing healthcare infrastructure development and expanding medical technology adoption are driving demand for MRI-based quantitative biomarker products across healthcare providers, diagnostic imaging centers, and medical research specialists seeking to enhance clinical capabilities and diagnostic accuracy.
  • Increasing focus on healthcare technology advancement and clinical excellence is supporting the adoption of precision diagnostic solutions among healthcare institutions and medical researchers seeking to differentiate their capabilities in regional markets with modern medical technology capabilities.

France Maintains Strong Position with Medical Research Excellence

Revenue from MRI-based quantitative biomarkers in France is projected to grow at a CAGR of 3.6% through 2035, driven by the country's established medical research sector, precision medicine development capabilities, and leadership in clinical technology applications. France's sophisticated healthcare culture and willingness to invest in high-performance medical technologies are creating steady demand for both standard and premium MRI-based quantitative biomarker varieties. Leading medical technology companies and healthcare institutions are establishing comprehensive research strategies to serve both European markets and growing international demand.

  • Established medical research capabilities and precision healthcare manufacturing are driving demand for premium MRI-based quantitative biomarker products across medical technology companies, healthcare research institutions, and clinical centers seeking superior diagnostic performance characteristics.
  • Strong medical expertise and innovation capabilities are supporting the adoption of cutting-edge quantitative analysis technologies among healthcare providers prioritizing clinical excellence and diagnostic accuracy in medical research applications.

UK Anchors Growth with NHS Modernization Leadership

Revenue from MRI-based quantitative biomarkers in the United Kingdom is projected to grow at a CAGR of 3.4% through 2035, supported by the country's National Health Service modernization programs, innovation leadership capabilities, and established market for advanced medical technologies. British healthcare providers and medical technology manufacturers prioritize innovation, clinical effectiveness, and evidence-based medicine, making MRI-based quantitative biomarkers essential tools for both healthcare system upgrades and medical research projects. The country's comprehensive healthcare ecosystem and clinical adoption patterns support continued market development.

  • Advanced healthcare system capabilities and medical innovation leadership are driving demand for specialized MRI-based quantitative biomarker products across healthcare technology manufacturers, medical research institutions, and NHS facilities serving domestic and international healthcare markets.
  • Strong focus on evidence-based medicine and clinical innovation is encouraging healthcare providers to adopt premium quantitative analysis products that support cutting-edge positioning and meet British quality standards for advanced medical technology applications.

USA Demonstrates Stable Growth with Healthcare Technology Innovation

Revenue from MRI-based quantitative biomarkers in the United States is projected to grow at a CAGR of 2.9% through 2035, supported by the country's established healthcare technology sector, mature precision medicine adoption, and comprehensive medical research infrastructure. American healthcare providers' focus on clinical innovation, diagnostic accuracy, and patient outcomes creates steady demand for quantitative biomarker products. The country's advanced healthcare technology ecosystem and established adoption patterns drive consistent utilization across both traditional healthcare facilities and emerging precision medicine applications.

  • Established healthcare technology infrastructure and mature precision medicine adoption are driving steady demand for MRI-based quantitative biomarker products across medical technology companies, healthcare systems, and clinical research organizations seeking enhanced diagnostic capabilities and clinical research excellence.
  • Strong innovation culture and healthcare technology advancement focus are supporting the adoption of advanced quantitative analysis solutions among healthcare providers and medical researchers seeking to meet American clinical standards and patient care expectations for precision medicine applications.

Germany Focuses on Precision Manufacturing Excellence

Revenue from MRI-based quantitative biomarkers in Germany is projected to grow at a CAGR of 2.7% through 2035, supported by the country's precision manufacturing excellence, advanced medical technology expertise, and established reputation for producing superior healthcare technology products while working to enhance AI integration capabilities and develop next-generation quantitative analysis technologies. Germany's medical technology industry continues to benefit from its reputation for producing high-quality medical devices while focusing on innovation and manufacturing precision.
  • Precision manufacturing capabilities and advanced medical technology expertise are driving the development of premium MRI-based quantitative biomarker products that command higher prices in international markets while supporting technological advancement and manufacturing excellence initiatives.
  • Growing focus on AI technology innovation and medical technology optimization is supporting the adoption of advanced artificial intelligence and quantitative analysis technologies among manufacturers seeking to ensure product quality and maintain a German reputation for medical technology excellence in precision medicine applications.

Europe Market Split by Country

Europe Mri Based Quantitative Biomarkers Market

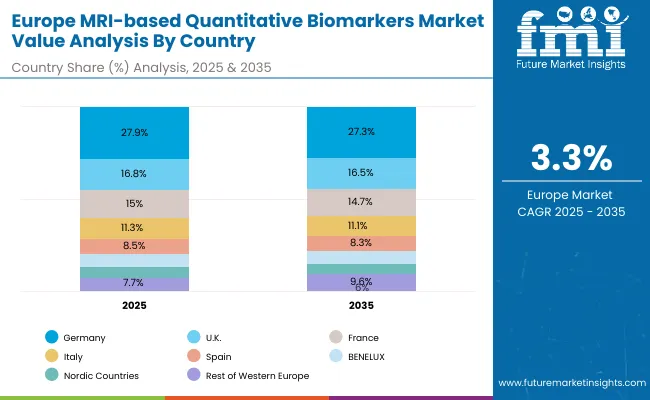
The MRI-based quantitative biomarkers market in Europe is projected to grow at a CAGR of 3.3% from 2025 to 2035. Germany is expected to maintain its leadership position with a 27.9% market share in 2025, declining slightly to 27.3% by 2035, supported by its precision medical imaging technologies, advanced healthcare infrastructure, and role as a regional R&D hub.

The United Kingdom follows with a 16.8% share in 2025, projected to reach 16.5% by 2035, driven by priorities in advanced diagnostic imaging, clinical excellence, and integration of quantitative biomarkers in patient monitoring. France holds a 15.0% share in 2025, expected to moderate to 14.7% by 2035, reflecting steady adoption of imaging biomarkers, though constrained by regulatory complexity and competitive market dynamics.

Italy accounts for 11.3% in 2025, projected to ease to 11.1% by 2035, supported by strong adoption in oncology and neurology applications. Spain contributes 8.5% in 2025, declining marginally to 8.3% by 2035, reflecting competitive pressures and resource allocation challenges across public healthcare systems.

The Nordic Countries represent 7.7% in 2025, forecasted to expand to 9.6% by 2035, benefitting from advanced healthcare systems, technology-driven clinical adoption, and government support for precision diagnostics. BENELUX holds 6.3% in 2025, expected to remain stable at 6.3% by 2035, while the Rest of Western Europe region is projected at 7.6% in 2025, declining to 6.0% by 2035, reflecting mixed growth dynamics across smaller and mature markets.
South Korea Market Split by Application

Souyh Korea Mri Based Quantitative Biomarkers Market

The MRI-based quantitative biomarkers market in South Korea is projected to expand steadily from 2025 to 2035, supported by strong imaging infrastructure, adoption of advanced diagnostic protocols, and emphasis on precision medicine.

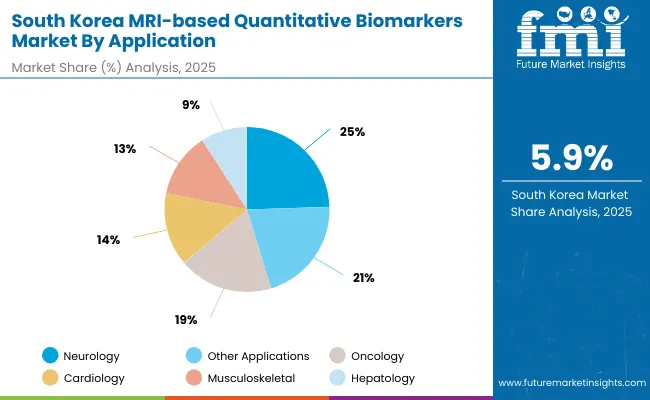
Neurology is expected to maintain its leadership with a 25.0% market share in 2025, projected at 24.8% by 2035, driven by the prevalence of neurodegenerative disorders and demand for early disease detection. Other applications follow with 21.0% in 2025, anticipated to reach 21.2% by 2035, supported by cross-specialty imaging demand.

Oncology accounts for 19.0% in 2025, projected at 19.3% by 2035, driven by rising cancer screening and personalized treatment planning. Cardiology represents 14.0% in 2025, expected to sustain 14.1% by 2035, benefiting from cardiac MRI adoption in arrhythmia and ischemic heart disease management. Musculoskeletal applications contribute 13.0% in 2025, projected at 13.1% by 2035, while hepatology holds 9.0% in 2025, expected to remain steady at 9.0% by 2035, reflecting stable but limited demand.
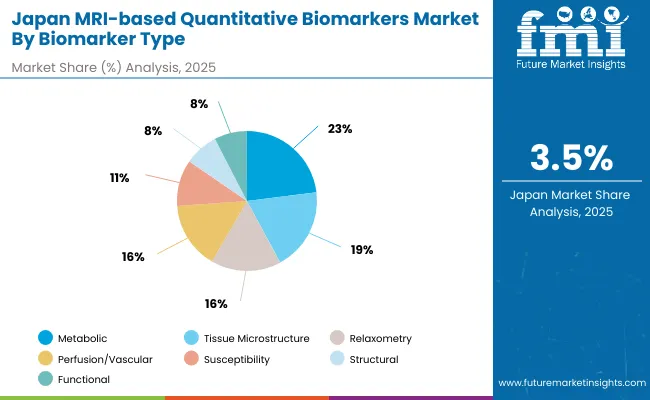
Japan Market Split by Biomarker Type

Japan Mri Based Quantitative Biomarkers Market

The MRI-based quantitative biomarkers market in Japan is projected to grow through 2035, supported by advancements in imaging technologies, precision diagnostics, and integration of biomarkers in clinical decision-making.

Metabolic biomarkers are expected to maintain their leadership with a 23.0% market share in 2025, projected at 22.8% by 2035, reflecting growing use in oncology and metabolic disease research. Tissue microstructure follows with 19.0% in 2025, expected to sustain 19.1% by 2035, supported by adoption in neurology and musculoskeletal imaging.

Susceptibility biomarkers hold 16.0% in 2025, projected at 16.1% by 2035, driven by applications in stroke and neurovascular imaging. Perfusion/vascular biomarkers also account for 16.0% in 2025, forecasted to remain stable at 16.0% by 2035, supported by cardiovascular and tumor blood flow studies.

Relaxometry biomarkers represent 11.0% in 2025, expected to hold 11.0% by 2035, while structural biomarkers account for 8.0% in 2025, projected to remain steady at 8.0% by 2035, reflecting niche but consistent adoption in clinical and research applications.

Competitive Landscape of the MRI-based Quantitative Biomarkers Market

The MRI-based quantitative biomarkers market is characterized by competition among established medical imaging technology companies, specialized quantitative analysis software developers, and integrated healthcare technology suppliers. Companies are investing in advanced artificial intelligence algorithms, clinical validation programs, application-specific product development, and comprehensive healthcare workflow integration capabilities to deliver consistent, high-performance, and reliable quantitative biomarker products. Innovation in AI-powered analysis enhancement, clinical evidence generation, and customized healthcare system compatibility is central to strengthening market position and clinical adoption.

CaliberMRI leads the market with a strong focus on quantitative imaging innovation and comprehensive analysis solutions, offering advanced MRI-based quantitative biomarker products with emphasis on clinical accuracy and technology integration excellence. Olea Medical provides integrated medical imaging software capabilities with a focus on advanced visualization and global healthcare distribution networks. Biosyn delivers specialized biomarker analysis technology with a focus on precision medicine applications and clinical research leadership.

Invitae specializes in genetic testing and precision medicine with an emphasis on AI integration and clinical decision support. VIDA Diagnostics focuses on pulmonary imaging solutions and advanced quantitative analysis technologies. Synthetic MR emphasizes synthetic imaging and automated analysis expertise with a focus on workflow optimization and clinical efficiency.

Key Players in the MRI-based Quantitative Biomarkers Market

  • CaliberMRI
  • Olea Medical
  • Biosyn
  • Invitae
  • VIDA Diagnostics
  • Synthetic MR
  • Imbio

Scope of the Report

Items Values
Quantitative Units (2025) USD million
Biomarker Type Metabolic, Tissue Microstructure, Relaxometry, Perfusion/Vascular, Susceptibility, Structural, Functional, Others
Application Neurology, Oncology, Cardiology, Hepatology, Musculoskeletal, Other Applications
End Users Diagnostic Imaging Centers, Hospitals, Specialty Clinics, Ambulatory Surgical Centers, Academics & Research Institutes, Others
Regions Covered North America, Europe, East Asia, South Asia & Pacific, Latin America, Middle East & Africa
Countries Covered United States, Canada, United Kingdom, Germany, France, China, Japan, South Korea, India, Brazil, Australia and 40+ countries
Key Companies Profiled CaliberMRI, Olea Medical, Biosyn, Invitae, VIDA Diagnostics, Synthetic MR, and Imbio
Additional Attributes Dollar sales by biomarker type, application, and end users, regional demand trends, competitive landscape, technological advancements in AI-powered analysis, clinical validation initiatives, healthcare workflow integration programs, and precision medicine optimization strategies

MRI-based Quantitative Biomarkers Market by Segments

By Biomarker Type:

  • Metabolic
  • Tissue Microstructure
  • Relaxometry
  • Perfusion/Vascular
  • Susceptibility
  • Structural
  • Functional
  • Others

By Application:

  • Neurology
  • Oncology
  • Cardiology
  • Hepatology
  • Musculoskeletal
  • Other Applications

By End Users:

  • Diagnostic Imaging Centers
  • Hospitals
  • Specialty Clinics
  • Ambulatory Surgical Centers
  • Academics & Research Institutes
  • Others

By Region:

By North America

  • United States
  • Canada
  • Mexico

By Europe

  • Germany
  • United Kingdom
  • France
  • Italy
  • Spain
  • Nordic
  • BENELUX
  • Rest of Europe

By East Asia

  • China
  • Japan
  • South Korea

By South Asia & Pacific

  • India
  • ASEAN
  • Australia & New Zealand
  • Rest of South Asia & Pacific

By Latin America

  • Brazil
  • Chile
  • Rest of Latin America

By Middle East & Africa

  • Kingdom of Saudi Arabia
  • Other GCC Countries
  • Turkiye
  • South Africa
  • Other African Union
  • Rest of Middle East & Africa

Table of Content

  1. Executive Summary
    • Global Market Outlook
    • Demand-side Trends
    • Supply-side Trends
    • Technology Roadmap Analysis
    • Analysis and Recommendations
  2. Market Overview
    • Market Coverage / Taxonomy
    • Market Definition / Scope / Limitations
  3. Market Background
    • Market Dynamics
      • Drivers
      • Restraints
      • Opportunity
      • Trends
    • Scenario Forecast
      • Demand in Optimistic Scenario
      • Demand in Likely Scenario
      • Demand in Conservative Scenario
    • Opportunity Map Analysis
    • Product Life Cycle Analysis
    • Supply Chain Analysis
      • Supply Side Participants and their Roles
        • Producers
        • Mid-Level Participants (Traders/ Agents/ Brokers)
        • Wholesalers and Distributors
      • Value Added and Value Created at Node in the Supply Chain
      • List of Raw Material Suppliers
      • List of Existing and Potential Buyer's
    • Investment Feasibility Matrix
    • Value Chain Analysis
      • Profit Margin Analysis
      • Wholesalers and Distributors
      • Retailers
    • PESTLE and Porter's Analysis
    • Regulatory Landscape
      • By Key Regions
      • By Key Countries
    • Regional Parent Market Outlook
    • Production and Consumption Statistics
    • Import and Export Statistics
  4. Global Market Analysis 2020 to 2024 and Forecast, 2025 to 2035
    • Historical Market Size Value (USD Million) & Volume (Units) Analysis, 2020 to 2024
    • Current and Future Market Size Value (USD Million) & Volume (Units) Projections, 2025 to 2035
      • Y-o-Y Growth Trend Analysis
      • Absolute $ Opportunity Analysis
  5. Global Market Pricing Analysis 2020 to 2024 and Forecast 2025 to 2035
  6. Global Market Analysis 2020 to 2024 and Forecast 2025 to 2035, By Biomarker Type
    • Introduction / Key Findings
    • Historical Market Size Value (USD Million) & Volume (Units) Analysis By Biomarker Type, 2020 to 2024
    • Current and Future Market Size Value (USD Million) & Volume (Units) Analysis and Forecast By Biomarker Type, 2025 to 2035
      • Metabolic
      • Tissue Microstructure
      • Relaxometry
      • Perfusion/Vascular
      • Susceptibility
      • Structural
      • Functional
      • Others
    • Y-o-Y Growth Trend Analysis By Biomarker Type, 2020 to 2024
    • Absolute $ Opportunity Analysis By Biomarker Type, 2025 to 2035
  7. Global Market Analysis 2020 to 2024 and Forecast 2025 to 2035, By Application
    • Introduction / Key Findings
    • Historical Market Size Value (USD Million) & Volume (Units) Analysis By Application, 2020 to 2024
    • Current and Future Market Size Value (USD Million) & Volume (Units) Analysis and Forecast By Application, 2025 to 2035
      • Neurology
      • Oncology
      • Cardiology
      • Hepatology
      • Musculoskeletal
      • Other Applications
    • Y-o-Y Growth Trend Analysis By Application, 2020 to 2024
    • Absolute $ Opportunity Analysis By Application, 2025 to 2035
  8. Global Market Analysis 2020 to 2024 and Forecast 2025 to 2035, By End User
    • Introduction / Key Findings
    • Historical Market Size Value (USD Million) & Volume (Units) Analysis By End User, 2020 to 2024
    • Current and Future Market Size Value (USD Million) & Volume (Units) Analysis and Forecast By End User, 2025 to 2035
      • Diagnostic Imaging Centers
      • Hospitals
      • Specialty Clinics
      • Ambulatory Surgical Centers
      • Academics & Research Institutes
      • Others
    • Y-o-Y Growth Trend Analysis By End User, 2020 to 2024
    • Absolute $ Opportunity Analysis By End User, 2025 to 2035
  9. Global Market Analysis 2020 to 2024 and Forecast 2025 to 2035, By Region
    • Introduction
    • Historical Market Size Value (USD Million) & Volume (Units) Analysis By Region, 2020 to 2024
    • Current Market Size Value (USD Million) & Volume (Units) Analysis and Forecast By Region, 2025 to 2035
      • North America
      • Europe
      • East Asia
      • South Asia & Pacific
      • Latin America
      • Middle East & Africa
    • Market Attractiveness Analysis By Region
  10. North America Market Analysis 2020 to 2024 and Forecast 2025 to 2035, By Country
    • Historical Market Size Value (USD Million) & Volume (Units) Trend Analysis By Market Taxonomy, 2020 to 2024
    • Market Size Value (USD Million) & Volume (Units) Forecast By Market Taxonomy, 2025 to 2035
      • By Country
        • USA
        • Canada
        • Mexico
      • By Biomarker Type
      • By Application
      • By End User
    • Market Attractiveness Analysis
      • By Country
      • By Biomarker Type
      • By Application
      • By End User
    • Key Takeaways
  11. Europe Market Analysis 2020 to 2024 and Forecast 2025 to 2035, By Country
    • Historical Market Size Value (USD Million) & Volume (Units) Trend Analysis By Market Taxonomy, 2020 to 2024
    • Market Size Value (USD Million) & Volume (Units) Forecast By Market Taxonomy, 2025 to 2035
      • By Country
        • Germany
        • UK
        • France
        • Italy
        • Spain
        • BENELUX
        • Nordic Countries
        • Rest of Europe
      • By Biomarker Type
      • By Application
      • By End User
    • Market Attractiveness Analysis
      • By Country
      • By Biomarker Type
      • By Application
      • By End User
    • Key Takeaways
  12. East Asia Market Analysis 2020 to 2024 and Forecast 2025 to 2035, By Country
    • Historical Market Size Value (USD Million) & Volume (Units) Trend Analysis By Market Taxonomy, 2020 to 2024
    • Market Size Value (USD Million) & Volume (Units) Forecast By Market Taxonomy, 2025 to 2035
      • By Country
        • China
        • Japan
        • South Korea
      • By Biomarker Type
      • By Application
      • By End User
    • Market Attractiveness Analysis
      • By Country
      • By Biomarker Type
      • By Application
      • By End User
    • Key Takeaways
  13. South Asia & Pacific Market Analysis 2020 to 2024 and Forecast 2025 to 2035, By Country
    • Historical Market Size Value (USD Million) & Volume (Units) Trend Analysis By Market Taxonomy, 2020 to 2024
    • Market Size Value (USD Million) & Volume (Units) Forecast By Market Taxonomy, 2025 to 2035
      • By Country
        • India
        • ASEAN Countries
        • Australia & New Zealand
        • Rest of South Asia & Pacific
      • By Biomarker Type
      • By Application
      • By End User
    • Market Attractiveness Analysis
      • By Country
      • By Biomarker Type
      • By Application
      • By End User
    • Key Takeaways
  14. Latin America Market Analysis 2020 to 2024 and Forecast 2025 to 2035, By Country
    • Historical Market Size Value (USD Million) & Volume (Units) Trend Analysis By Market Taxonomy, 2020 to 2024
    • Market Size Value (USD Million) & Volume (Units) Forecast By Market Taxonomy, 2025 to 2035
      • By Country
        • Brazil
        • Chile
        • Rest of Latin America
      • By Biomarker Type
      • By Application
      • By End User
    • Market Attractiveness Analysis
      • By Country
      • By Biomarker Type
      • By Application
      • By End User
    • Key Takeaways
  15. Middle East & Africa Market Analysis 2020 to 2024 and Forecast 2025 to 2035, By Country
    • Historical Market Size Value (USD Million) & Volume (Units) Trend Analysis By Market Taxonomy, 2020 to 2024
    • Market Size Value (USD Million) & Volume (Units) Forecast By Market Taxonomy, 2025 to 2035
      • By Country
        • Kingdom of Saudi Arabia
        • Other GCC Countries
        • Türkiye
        • South Africa
        • Other African Union
        • Rest of Middle East & Africa
      • By Biomarker Type
      • By Application
      • By End User
    • Market Attractiveness Analysis
      • By Country
      • By Biomarker Type
      • By Application
      • By End User
    • Key Takeaways
  16. Key Countries Market Analysis
    • USA
      • Pricing Analysis
      • Market Share Analysis, 2024
        • By Biomarker Type
        • By Application
        • By End User
    • Canada
      • Pricing Analysis
      • Market Share Analysis, 2024
        • By Biomarker Type
        • By Application
        • By End User
    • Germany
      • Pricing Analysis
      • Market Share Analysis, 2024
        • By Biomarker Type
        • By Application
        • By End User
    • UK
      • Pricing Analysis
      • Market Share Analysis, 2024
        • By Biomarker Type
        • By Application
        • By End User
    • France
      • Pricing Analysis
      • Market Share Analysis, 2024
        • By Biomarker Type
        • By Application
        • By End User
    • China
      • Pricing Analysis
      • Market Share Analysis, 2024
        • By Biomarker Type
        • By Application
        • By End User
    • Japan
      • Pricing Analysis
      • Market Share Analysis, 2024
        • By Biomarker Type
        • By Application
        • By End User
    • South Korea
      • Pricing Analysis
      • Market Share Analysis, 2024
        • By Biomarker Type
        • By Application
        • By End User
    • India
      • Pricing Analysis
      • Market Share Analysis, 2024
        • By Biomarker Type
        • By Application
        • By End User
    • Brazil
      • Pricing Analysis
      • Market Share Analysis, 2024
        • By Biomarker Type
        • By Application
        • By End User
  17. Market Structure Analysis
    • Competition Dashboard
    • Competition Benchmarking
    • Market Share Analysis of Top Players
      • By Regional
      • By Biomarker Type
      • By Application
      • By End User
  18. Competition Analysis
    • Competition Deep Dive
      • CaliberMRI
        • Overview
        • Product Portfolio
        • Profitability by Market Segments (Product/Age/Sales Channel/Region)
        • Sales Footprint
        • Strategy Overview
          • Marketing Strategy
          • Product Strategy
          • Channel Strategy
      • Olea Medical
        • Overview
        • Product Portfolio
        • Profitability by Market Segments (Product/Age/Sales Channel/Region)
        • Sales Footprint
        • Strategy Overview
          • Marketing Strategy
          • Product Strategy
          • Channel Strategy
      • Biosyn
        • Overview
        • Product Portfolio
        • Profitability by Market Segments (Product/Age/Sales Channel/Region)
        • Sales Footprint
        • Strategy Overview
          • Marketing Strategy
          • Product Strategy
          • Channel Strategy
      • Invitae
        • Overview
        • Product Portfolio
        • Profitability by Market Segments (Product/Age/Sales Channel/Region)
        • Sales Footprint
        • Strategy Overview
          • Marketing Strategy
          • Product Strategy
          • Channel Strategy
      • VIDA Diagnostics
        • Overview
        • Product Portfolio
        • Profitability by Market Segments (Product/Age/Sales Channel/Region)
        • Sales Footprint
        • Strategy Overview
          • Marketing Strategy
          • Product Strategy
          • Channel Strategy
      • Synthetic MR
        • Overview
        • Product Portfolio
        • Profitability by Market Segments (Product/Age/Sales Channel/Region)
        • Sales Footprint
        • Strategy Overview
          • Marketing Strategy
          • Product Strategy
          • Channel Strategy
      • Imbio
        • Overview
        • Product Portfolio
        • Profitability by Market Segments (Product/Age/Sales Channel/Region)
        • Sales Footprint
        • Strategy Overview
          • Marketing Strategy
          • Product Strategy
          • Channel Strategy
  19. Assumptions & Acronyms Used
  20. Research Methodology

List of Tables

  • Table 1: Global Market Value (USD Million) Forecast by Region, 2020-2035
  • Table 2: Global Market Volume (Units) Forecast by Region, 2020-2035
  • Table 3: Global Market Value (USD Million) Forecast by Biomarker Type, 2020-2035
  • Table 4: Global Market Volume (Units) Forecast by Biomarker Type, 2020-2035
  • Table 5: Global Market Value (USD Million) Forecast by Application, 2020-2035
  • Table 6: Global Market Volume (Units) Forecast by Application, 2020-2035
  • Table 7: Global Market Value (USD Million) Forecast by End User, 2020-2035
  • Table 8: Global Market Volume (Units) Forecast by End User, 2020-2035
  • Table 9: North America Market Value (USD Million) Forecast by Country, 2020-2035
  • Table 10: North America Market Volume (Units) Forecast by Country, 2020-2035
  • Table 11: North America Market Value (USD Million) Forecast by Biomarker Type, 2020-2035
  • Table 12: North America Market Volume (Units) Forecast by Biomarker Type, 2020-2035
  • Table 13: North America Market Value (USD Million) Forecast by Application, 2020-2035
  • Table 14: North America Market Volume (Units) Forecast by Application, 2020-2035
  • Table 15: North America Market Value (USD Million) Forecast by End User, 2020-2035
  • Table 16: North America Market Volume (Units) Forecast by End User, 2020-2035
  • Table 17: Europe Market Value (USD Million) Forecast by Country, 2020-2035
  • Table 18: Europe Market Volume (Units) Forecast by Country, 2020-2035
  • Table 19: Europe Market Value (USD Million) Forecast by Biomarker Type, 2020-2035
  • Table 20: Europe Market Volume (Units) Forecast by Biomarker Type, 2020-2035
  • Table 21: Europe Market Value (USD Million) Forecast by Application, 2020-2035
  • Table 22: Europe Market Volume (Units) Forecast by Application, 2020-2035
  • Table 23: Europe Market Value (USD Million) Forecast by End User, 2020-2035
  • Table 24: Europe Market Volume (Units) Forecast by End User, 2020-2035
  • Table 25: East Asia Market Value (USD Million) Forecast by Country, 2020-2035
  • Table 26: East Asia Market Volume (Units) Forecast by Country, 2020-2035
  • Table 27: East Asia Market Value (USD Million) Forecast by Biomarker Type, 2020-2035
  • Table 28: East Asia Market Volume (Units) Forecast by Biomarker Type, 2020-2035
  • Table 29: East Asia Market Value (USD Million) Forecast by Application, 2020-2035
  • Table 30: East Asia Market Volume (Units) Forecast by Application, 2020-2035
  • Table 31: East Asia Market Value (USD Million) Forecast by End User, 2020-2035
  • Table 32: East Asia Market Volume (Units) Forecast by End User, 2020-2035
  • Table 33: South Asia & Pacific Market Value (USD Million) Forecast by Country, 2020-2035
  • Table 34: South Asia & Pacific Market Volume (Units) Forecast by Country, 2020-2035
  • Table 35: South Asia & Pacific Market Value (USD Million) Forecast by Biomarker Type, 2020-2035
  • Table 36: South Asia & Pacific Market Volume (Units) Forecast by Biomarker Type, 2020-2035
  • Table 37: South Asia & Pacific Market Value (USD Million) Forecast by Application, 2020-2035
  • Table 38: South Asia & Pacific Market Volume (Units) Forecast by Application, 2020-2035
  • Table 39: South Asia & Pacific Market Value (USD Million) Forecast by End User, 2020-2035
  • Table 40: South Asia & Pacific Market Volume (Units) Forecast by End User, 2020-2035
  • Table 41: Latin America Market Value (USD Million) Forecast by Country, 2020-2035
  • Table 42: Latin America Market Volume (Units) Forecast by Country, 2020-2035
  • Table 43: Latin America Market Value (USD Million) Forecast by Biomarker Type, 2020-2035
  • Table 44: Latin America Market Volume (Units) Forecast by Biomarker Type, 2020-2035
  • Table 45: Latin America Market Value (USD Million) Forecast by Application, 2020-2035
  • Table 46: Latin America Market Volume (Units) Forecast by Application, 2020-2035
  • Table 47: Latin America Market Value (USD Million) Forecast by End User, 2020-2035
  • Table 48: Latin America Market Volume (Units) Forecast by End User, 2020-2035
  • Table 49: Middle East & Africa Market Value (USD Million) Forecast by Country, 2020-2035
  • Table 50: Middle East & Africa Market Volume (Units) Forecast by Country, 2020-2035
  • Table 51: Middle East & Africa Market Value (USD Million) Forecast by Biomarker Type, 2020-2035
  • Table 52: Middle East & Africa Market Volume (Units) Forecast by Biomarker Type, 2020-2035
  • Table 53: Middle East & Africa Market Value (USD Million) Forecast by Application, 2020-2035
  • Table 54: Middle East & Africa Market Volume (Units) Forecast by Application, 2020-2035
  • Table 55: Middle East & Africa Market Value (USD Million) Forecast by End User, 2020-2035
  • Table 56: Middle East & Africa Market Volume (Units) Forecast by End User, 2020-2035
  • Table 57: USA Market Value (USD Million) Forecast by Biomarker Type, 2020-2035
  • Table 58: USA Market Volume (Units) Forecast by Biomarker Type, 2020-2035
  • Table 59: USA Market Value (USD Million) Forecast by Application, 2020-2035
  • Table 60: USA Market Volume (Units) Forecast by Application, 2020-2035
  • Table 61: USA Market Value (USD Million) Forecast by End User, 2020-2035
  • Table 62: USA Market Volume (Units) Forecast by End User, 2020-2035
  • Table 63: Canada Market Value (USD Million) Forecast by Biomarker Type, 2020-2035
  • Table 64: Canada Market Volume (Units) Forecast by Biomarker Type, 2020-2035
  • Table 65: Canada Market Value (USD Million) Forecast by Application, 2020-2035
  • Table 66: Canada Market Volume (Units) Forecast by Application, 2020-2035
  • Table 67: Canada Market Value (USD Million) Forecast by End User, 2020-2035
  • Table 68: Canada Market Volume (Units) Forecast by End User, 2020-2035
  • Table 69: Mexico Market Value (USD Million) Forecast by Biomarker Type, 2020-2035
  • Table 70: Mexico Market Volume (Units) Forecast by Biomarker Type, 2020-2035
  • Table 71: Mexico Market Value (USD Million) Forecast by Application, 2020-2035
  • Table 72: Mexico Market Volume (Units) Forecast by Application, 2020-2035
  • Table 73: Mexico Market Value (USD Million) Forecast by End User, 2020-2035
  • Table 74: Mexico Market Volume (Units) Forecast by End User, 2020-2035
  • Table 75: Germany Market Value (USD Million) Forecast by Biomarker Type, 2020-2035
  • Table 76: Germany Market Volume (Units) Forecast by Biomarker Type, 2020-2035
  • Table 77: Germany Market Value (USD Million) Forecast by Application, 2020-2035
  • Table 78: Germany Market Volume (Units) Forecast by Application, 2020-2035
  • Table 79: Germany Market Value (USD Million) Forecast by End User, 2020-2035
  • Table 80: Germany Market Volume (Units) Forecast by End User, 2020-2035
  • Table 81: UK Market Value (USD Million) Forecast by Biomarker Type, 2020-2035
  • Table 82: UK Market Volume (Units) Forecast by Biomarker Type, 2020-2035
  • Table 83: UK Market Value (USD Million) Forecast by Application, 2020-2035
  • Table 84: UK Market Volume (Units) Forecast by Application, 2020-2035
  • Table 85: UK Market Value (USD Million) Forecast by End User, 2020-2035
  • Table 86: UK Market Volume (Units) Forecast by End User, 2020-2035
  • Table 87: France Market Value (USD Million) Forecast by Biomarker Type, 2020-2035
  • Table 88: France Market Volume (Units) Forecast by Biomarker Type, 2020-2035
  • Table 89: France Market Value (USD Million) Forecast by Application, 2020-2035
  • Table 90: France Market Volume (Units) Forecast by Application, 2020-2035
  • Table 91: France Market Value (USD Million) Forecast by End User, 2020-2035
  • Table 92: France Market Volume (Units) Forecast by End User, 2020-2035
  • Table 93: Italy Market Value (USD Million) Forecast by Biomarker Type, 2020-2035
  • Table 94: Italy Market Volume (Units) Forecast by Biomarker Type, 2020-2035
  • Table 95: Italy Market Value (USD Million) Forecast by Application, 2020-2035
  • Table 96: Italy Market Volume (Units) Forecast by Application, 2020-2035
  • Table 97: Italy Market Value (USD Million) Forecast by End User, 2020-2035
  • Table 98: Italy Market Volume (Units) Forecast by End User, 2020-2035
  • Table 99: Spain Market Value (USD Million) Forecast by Biomarker Type, 2020-2035
  • Table 100: Spain Market Volume (Units) Forecast by Biomarker Type, 2020-2035
  • Table 101: Spain Market Value (USD Million) Forecast by Application, 2020-2035
  • Table 102: Spain Market Volume (Units) Forecast by Application, 2020-2035
  • Table 103: Spain Market Value (USD Million) Forecast by End User, 2020-2035
  • Table 104: Spain Market Volume (Units) Forecast by End User, 2020-2035
  • Table 105: China Market Value (USD Million) Forecast by Biomarker Type, 2020-2035
  • Table 106: China Market Volume (Units) Forecast by Biomarker Type, 2020-2035
  • Table 107: China Market Value (USD Million) Forecast by Application, 2020-2035
  • Table 108: China Market Volume (Units) Forecast by Application, 2020-2035
  • Table 109: China Market Value (USD Million) Forecast by End User, 2020-2035
  • Table 110: China Market Volume (Units) Forecast by End User, 2020-2035
  • Table 111: Japan Market Value (USD Million) Forecast by Biomarker Type, 2020-2035
  • Table 112: Japan Market Volume (Units) Forecast by Biomarker Type, 2020-2035
  • Table 113: Japan Market Value (USD Million) Forecast by Application, 2020-2035
  • Table 114: Japan Market Volume (Units) Forecast by Application, 2020-2035
  • Table 115: Japan Market Value (USD Million) Forecast by End User, 2020-2035
  • Table 116: Japan Market Volume (Units) Forecast by End User, 2020-2035
  • Table 117: South Korea Market Value (USD Million) Forecast by Biomarker Type, 2020-2035
  • Table 118: South Korea Market Volume (Units) Forecast by Biomarker Type, 2020-2035
  • Table 119: South Korea Market Value (USD Million) Forecast by Application, 2020-2035
  • Table 120: South Korea Market Volume (Units) Forecast by Application, 2020-2035
  • Table 121: South Korea Market Value (USD Million) Forecast by End User, 2020-2035
  • Table 122: South Korea Market Volume (Units) Forecast by End User, 2020-2035
  • Table 123: India Market Value (USD Million) Forecast by Biomarker Type, 2020-2035
  • Table 124: India Market Volume (Units) Forecast by Biomarker Type, 2020-2035
  • Table 125: India Market Value (USD Million) Forecast by Application, 2020-2035
  • Table 126: India Market Volume (Units) Forecast by Application, 2020-2035
  • Table 127: India Market Value (USD Million) Forecast by End User, 2020-2035
  • Table 128: India Market Volume (Units) Forecast by End User, 2020-2035
  • Table 129: ASEAN Countries Market Value (USD Million) Forecast by Biomarker Type, 2020-2035
  • Table 130: ASEAN Countries Market Volume (Units) Forecast by Biomarker Type, 2020-2035
  • Table 131: ASEAN Countries Market Value (USD Million) Forecast by Application, 2020-2035
  • Table 132: ASEAN Countries Market Volume (Units) Forecast by Application, 2020-2035
  • Table 133: ASEAN Countries Market Value (USD Million) Forecast by End User, 2020-2035
  • Table 134: ASEAN Countries Market Volume (Units) Forecast by End User, 2020-2035
  • Table 135: Australia & New Zealand Market Value (USD Million) Forecast by Biomarker Type, 2020-2035
  • Table 136: Australia & New Zealand Market Volume (Units) Forecast by Biomarker Type, 2020-2035
  • Table 137: Australia & New Zealand Market Value (USD Million) Forecast by Application, 2020-2035
  • Table 138: Australia & New Zealand Market Volume (Units) Forecast by Application, 2020-2035
  • Table 139: Australia & New Zealand Market Value (USD Million) Forecast by End User, 2020-2035
  • Table 140: Australia & New Zealand Market Volume (Units) Forecast by End User, 2020-2035
  • Table 141: Brazil Market Value (USD Million) Forecast by Biomarker Type, 2020-2035
  • Table 142: Brazil Market Volume (Units) Forecast by Biomarker Type, 2020-2035
  • Table 143: Brazil Market Value (USD Million) Forecast by Application, 2020-2035
  • Table 144: Brazil Market Volume (Units) Forecast by Application, 2020-2035
  • Table 145: Brazil Market Value (USD Million) Forecast by End User, 2020-2035
  • Table 146: Brazil Market Volume (Units) Forecast by End User, 2020-2035
  • Table 147: Chile Market Value (USD Million) Forecast by Biomarker Type, 2020-2035
  • Table 148: Chile Market Volume (Units) Forecast by Biomarker Type, 2020-2035
  • Table 149: Chile Market Value (USD Million) Forecast by Application, 2020-2035
  • Table 150: Chile Market Volume (Units) Forecast by Application, 2020-2035
  • Table 151: Chile Market Value (USD Million) Forecast by End User, 2020-2035
  • Table 152: Chile Market Volume (Units) Forecast by End User, 2020-2035
  • Table 153: Kingdom of Saudi Arabia Market Value (USD Million) Forecast by Biomarker Type, 2020-2035
  • Table 154: Kingdom of Saudi Arabia Market Volume (Units) Forecast by Biomarker Type, 2020-2035
  • Table 155: Kingdom of Saudi Arabia Market Value (USD Million) Forecast by Application, 2020-2035
  • Table 156: Kingdom of Saudi Arabia Market Volume (Units) Forecast by Application, 2020-2035
  • Table 157: Kingdom of Saudi Arabia Market Value (USD Million) Forecast by End User, 2020-2035
  • Table 158: Kingdom of Saudi Arabia Market Volume (Units) Forecast by End User, 2020-2035
  • Table 159: Türkiye Market Value (USD Million) Forecast by Biomarker Type, 2020-2035
  • Table 160: Türkiye Market Volume (Units) Forecast by Biomarker Type, 2020-2035
  • Table 161: Türkiye Market Value (USD Million) Forecast by Application, 2020-2035
  • Table 162: Türkiye Market Volume (Units) Forecast by Application, 2020-2035
  • Table 163: Türkiye Market Value (USD Million) Forecast by End User, 2020-2035
  • Table 164: Türkiye Market Volume (Units) Forecast by End User, 2020-2035
  • Table 165: South Africa Market Value (USD Million) Forecast by Biomarker Type, 2020-2035
  • Table 166: South Africa Market Volume (Units) Forecast by Biomarker Type, 2020-2035
  • Table 167: South Africa Market Value (USD Million) Forecast by Application, 2020-2035
  • Table 168: South Africa Market Volume (Units) Forecast by Application, 2020-2035
  • Table 169: South Africa Market Value (USD Million) Forecast by End User, 2020-2035
  • Table 170: South Africa Market Volume (Units) Forecast by End User, 2020-2035
  • Table 171: Other GCC Countries Market Value (USD Million) Forecast by Biomarker Type, 2020-2035
  • Table 172: Other GCC Countries Market Volume (Units) Forecast by Biomarker Type, 2020-2035
  • Table 173: Other GCC Countries Market Value (USD Million) Forecast by Application, 2020-2035
  • Table 174: Other GCC Countries Market Volume (Units) Forecast by Application, 2020-2035
  • Table 175: Other GCC Countries Market Value (USD Million) Forecast by End User, 2020-2035
  • Table 176: Other GCC Countries Market Volume (Units) Forecast by End User, 2020-2035
  • Table 177: Other African Union Market Value (USD Million) Forecast by Biomarker Type, 2020-2035
  • Table 178: Other African Union Market Volume (Units) Forecast by Biomarker Type, 2020-2035
  • Table 179: Other African Union Market Value (USD Million) Forecast by Application, 2020-2035
  • Table 180: Other African Union Market Volume (Units) Forecast by Application, 2020-2035
  • Table 181: Other African Union Market Value (USD Million) Forecast by End User, 2020-2035
  • Table 182: Other African Union Market Volume (Units) Forecast by End User, 2020-2035
  • Table 183: Rest of Latin America Market Value (USD Million) Forecast by Biomarker Type, 2020-2035
  • Table 184: Rest of Latin America Market Volume (Units) Forecast by Biomarker Type, 2020-2035
  • Table 185: Rest of Latin America Market Value (USD Million) Forecast by Application, 2020-2035
  • Table 186: Rest of Latin America Market Volume (Units) Forecast by Application, 2020-2035
  • Table 187: Rest of Latin America Market Value (USD Million) Forecast by End User, 2020-2035
  • Table 188: Rest of Latin America Market Volume (Units) Forecast by End User, 2020-2035
  • Table 189: BENELUX Market Value (USD Million) Forecast by Biomarker Type, 2020-2035
  • Table 190: BENELUX Market Volume (Units) Forecast by Biomarker Type, 2020-2035
  • Table 191: BENELUX Market Value (USD Million) Forecast by Application, 2020-2035
  • Table 192: BENELUX Market Volume (Units) Forecast by Application, 2020-2035
  • Table 193: BENELUX Market Value (USD Million) Forecast by End User, 2020-2035
  • Table 194: BENELUX Market Volume (Units) Forecast by End User, 2020-2035
  • Table 195: Nordic Countries Market Value (USD Million) Forecast by Biomarker Type, 2020-2035
  • Table 196: Nordic Countries Market Volume (Units) Forecast by Biomarker Type, 2020-2035
  • Table 197: Nordic Countries Market Value (USD Million) Forecast by Application, 2020-2035
  • Table 198: Nordic Countries Market Volume (Units) Forecast by Application, 2020-2035
  • Table 199: Nordic Countries Market Value (USD Million) Forecast by End User, 2020-2035
  • Table 200: Nordic Countries Market Volume (Units) Forecast by End User, 2020-2035
  • Table 201: Rest of Europe Market Value (USD Million) Forecast by Biomarker Type, 2020-2035
  • Table 202: Rest of Europe Market Volume (Units) Forecast by Biomarker Type, 2020-2035
  • Table 203: Rest of Europe Market Value (USD Million) Forecast by Application, 2020-2035
  • Table 204: Rest of Europe Market Volume (Units) Forecast by Application, 2020-2035
  • Table 205: Rest of Europe Market Value (USD Million) Forecast by End User, 2020-2035
  • Table 206: Rest of Europe Market Volume (Units) Forecast by End User, 2020-2035
  • Table 207: Rest of South Asia & Pacific Market Value (USD Million) Forecast by Biomarker Type, 2020-2035
  • Table 208: Rest of South Asia & Pacific Market Volume (Units) Forecast by Biomarker Type, 2020-2035
  • Table 209: Rest of South Asia & Pacific Market Value (USD Million) Forecast by Application, 2020-2035
  • Table 210: Rest of South Asia & Pacific Market Volume (Units) Forecast by Application, 2020-2035
  • Table 211: Rest of South Asia & Pacific Market Value (USD Million) Forecast by End User, 2020-2035
  • Table 212: Rest of South Asia & Pacific Market Volume (Units) Forecast by End User, 2020-2035
  • Table 213: Rest of Middle East & Africa Market Value (USD Million) Forecast by Biomarker Type, 2020-2035
  • Table 214: Rest of Middle East & Africa Market Volume (Units) Forecast by Biomarker Type, 2020-2035
  • Table 215: Rest of Middle East & Africa Market Value (USD Million) Forecast by Application, 2020-2035
  • Table 216: Rest of Middle East & Africa Market Volume (Units) Forecast by Application, 2020-2035
  • Table 217: Rest of Middle East & Africa Market Value (USD Million) Forecast by End User, 2020-2035
  • Table 218: Rest of Middle East & Africa Market Volume (Units) Forecast by End User, 2020-2035

List of Figures

  • Figure 1: Global Market Value (USD Million) by Biomarker Type, 2025-2035
  • Figure 2: Global Market Value (USD Million) by Application, 2025-2035
  • Figure 3: Global Market Value (USD Million) by End User, 2025-2035
  • Figure 4: Global Market Value (USD Million) by Region, 2025-2035
  • Figure 5: Global Market Value (USD Million) Analysis by Region, 2020-2035
  • Figure 6: Global Market Volume (Units) Analysis by Region, 2020-2035
  • Figure 7: Global Market Value Share (%) and BPS Analysis by Region, 2025-2035
  • Figure 8: Global Market Y-o-Y Growth (%) Projections by Region, 2025-2035
  • Figure 9: Global Market Value (USD Million) Analysis by Biomarker Type, 2020-2035
  • Figure 10: Global Market Volume (Units) Analysis by Biomarker Type, 2020-2035
  • Figure 11: Global Market Value Share (%) and BPS Analysis by Biomarker Type, 2025-2035
  • Figure 12: Global Market Y-o-Y Growth (%) Projections by Biomarker Type, 2025-2035
  • Figure 13: Global Market Value (USD Million) Analysis by Application, 2020-2035
  • Figure 14: Global Market Volume (Units) Analysis by Application, 2020-2035
  • Figure 15: Global Market Value Share (%) and BPS Analysis by Application, 2025-2035
  • Figure 16: Global Market Y-o-Y Growth (%) Projections by Application, 2025-2035
  • Figure 17: Global Market Value (USD Million) Analysis by End User, 2020-2035
  • Figure 18: Global Market Volume (Units) Analysis by End User, 2020-2035
  • Figure 19: Global Market Value Share (%) and BPS Analysis by End User, 2025-2035
  • Figure 20: Global Market Y-o-Y Growth (%) Projections by End User, 2025-2035
  • Figure 21: Global Market Attractiveness by Biomarker Type, 2025-2035
  • Figure 22: Global Market Attractiveness by Application, 2025-2035
  • Figure 23: Global Market Attractiveness by End User, 2025-2035
  • Figure 24: Global Market Attractiveness by Region, 2025-2035
  • Figure 25: North America Market Value (USD Million) by Biomarker Type, 2025-2035
  • Figure 26: North America Market Value (USD Million) by Application, 2025-2035
  • Figure 27: North America Market Value (USD Million) by End User, 2025-2035
  • Figure 28: North America Market Value (USD Million) by Country, 2025-2035
  • Figure 29: North America Market Value (USD Million) Analysis by Country, 2020-2035
  • Figure 30: North America Market Volume (Units) Analysis by Country, 2020-2035
  • Figure 31: North America Market Value Share (%) and BPS Analysis by Country, 2025-2035
  • Figure 32: North America Market Y-o-Y Growth (%) Projections by Country, 2025-2035
  • Figure 33: North America Market Value (USD Million) Analysis by Biomarker Type, 2020-2035
  • Figure 34: North America Market Volume (Units) Analysis by Biomarker Type, 2020-2035
  • Figure 35: North America Market Value Share (%) and BPS Analysis by Biomarker Type, 2025-2035
  • Figure 36: North America Market Y-o-Y Growth (%) Projections by Biomarker Type, 2025-2035
  • Figure 37: North America Market Value (USD Million) Analysis by Application, 2020-2035
  • Figure 38: North America Market Volume (Units) Analysis by Application, 2020-2035
  • Figure 39: North America Market Value Share (%) and BPS Analysis by Application, 2025-2035
  • Figure 40: North America Market Y-o-Y Growth (%) Projections by Application, 2025-2035
  • Figure 41: North America Market Value (USD Million) Analysis by End User, 2020-2035
  • Figure 42: North America Market Volume (Units) Analysis by End User, 2020-2035
  • Figure 43: North America Market Value Share (%) and BPS Analysis by End User, 2025-2035
  • Figure 44: North America Market Y-o-Y Growth (%) Projections by End User, 2025-2035
  • Figure 45: North America Market Attractiveness by Biomarker Type, 2025-2035
  • Figure 46: North America Market Attractiveness by Application, 2025-2035
  • Figure 47: North America Market Attractiveness by End User, 2025-2035
  • Figure 48: North America Market Attractiveness by Country, 2025-2035
  • Figure 49: Europe Market Value (USD Million) by Biomarker Type, 2025-2035
  • Figure 50: Europe Market Value (USD Million) by Application, 2025-2035
  • Figure 51: Europe Market Value (USD Million) by End User, 2025-2035
  • Figure 52: Europe Market Value (USD Million) by Country, 2025-2035
  • Figure 53: Europe Market Value (USD Million) Analysis by Country, 2020-2035
  • Figure 54: Europe Market Volume (Units) Analysis by Country, 2020-2035
  • Figure 55: Europe Market Value Share (%) and BPS Analysis by Country, 2025-2035
  • Figure 56: Europe Market Y-o-Y Growth (%) Projections by Country, 2025-2035
  • Figure 57: Europe Market Value (USD Million) Analysis by Biomarker Type, 2020-2035
  • Figure 58: Europe Market Volume (Units) Analysis by Biomarker Type, 2020-2035
  • Figure 59: Europe Market Value Share (%) and BPS Analysis by Biomarker Type, 2025-2035
  • Figure 60: Europe Market Y-o-Y Growth (%) Projections by Biomarker Type, 2025-2035
  • Figure 61: Europe Market Value (USD Million) Analysis by Application, 2020-2035
  • Figure 62: Europe Market Volume (Units) Analysis by Application, 2020-2035
  • Figure 63: Europe Market Value Share (%) and BPS Analysis by Application, 2025-2035
  • Figure 64: Europe Market Y-o-Y Growth (%) Projections by Application, 2025-2035
  • Figure 65: Europe Market Value (USD Million) Analysis by End User, 2020-2035
  • Figure 66: Europe Market Volume (Units) Analysis by End User, 2020-2035
  • Figure 67: Europe Market Value Share (%) and BPS Analysis by End User, 2025-2035
  • Figure 68: Europe Market Y-o-Y Growth (%) Projections by End User, 2025-2035
  • Figure 69: Europe Market Attractiveness by Biomarker Type, 2025-2035
  • Figure 70: Europe Market Attractiveness by Application, 2025-2035
  • Figure 71: Europe Market Attractiveness by End User, 2025-2035
  • Figure 72: Europe Market Attractiveness by Country, 2025-2035
  • Figure 73: East Asia Market Value (USD Million) by Biomarker Type, 2025-2035
  • Figure 74: East Asia Market Value (USD Million) by Application, 2025-2035
  • Figure 75: East Asia Market Value (USD Million) by End User, 2025-2035
  • Figure 76: East Asia Market Value (USD Million) by Country, 2025-2035
  • Figure 77: East Asia Market Value (USD Million) Analysis by Country, 2020-2035
  • Figure 78: East Asia Market Volume (Units) Analysis by Country, 2020-2035
  • Figure 79: East Asia Market Value Share (%) and BPS Analysis by Country, 2025-2035
  • Figure 80: East Asia Market Y-o-Y Growth (%) Projections by Country, 2025-2035
  • Figure 81: East Asia Market Value (USD Million) Analysis by Biomarker Type, 2020-2035
  • Figure 82: East Asia Market Volume (Units) Analysis by Biomarker Type, 2020-2035
  • Figure 83: East Asia Market Value Share (%) and BPS Analysis by Biomarker Type, 2025-2035
  • Figure 84: East Asia Market Y-o-Y Growth (%) Projections by Biomarker Type, 2025-2035
  • Figure 85: East Asia Market Value (USD Million) Analysis by Application, 2020-2035
  • Figure 86: East Asia Market Volume (Units) Analysis by Application, 2020-2035
  • Figure 87: East Asia Market Value Share (%) and BPS Analysis by Application, 2025-2035
  • Figure 88: East Asia Market Y-o-Y Growth (%) Projections by Application, 2025-2035
  • Figure 89: East Asia Market Value (USD Million) Analysis by End User, 2020-2035
  • Figure 90: East Asia Market Volume (Units) Analysis by End User, 2020-2035
  • Figure 91: East Asia Market Value Share (%) and BPS Analysis by End User, 2025-2035
  • Figure 92: East Asia Market Y-o-Y Growth (%) Projections by End User, 2025-2035
  • Figure 93: East Asia Market Attractiveness by Biomarker Type, 2025-2035
  • Figure 94: East Asia Market Attractiveness by Application, 2025-2035
  • Figure 95: East Asia Market Attractiveness by End User, 2025-2035
  • Figure 96: East Asia Market Attractiveness by Country, 2025-2035
  • Figure 97: South Asia & Pacific Market Value (USD Million) by Biomarker Type, 2025-2035
  • Figure 98: South Asia & Pacific Market Value (USD Million) by Application, 2025-2035
  • Figure 99: South Asia & Pacific Market Value (USD Million) by End User, 2025-2035
  • Figure 100: South Asia & Pacific Market Value (USD Million) by Country, 2025-2035
  • Figure 101: South Asia & Pacific Market Value (USD Million) Analysis by Country, 2020-2035
  • Figure 102: South Asia & Pacific Market Volume (Units) Analysis by Country, 2020-2035
  • Figure 103: South Asia & Pacific Market Value Share (%) and BPS Analysis by Country, 2025-2035
  • Figure 104: South Asia & Pacific Market Y-o-Y Growth (%) Projections by Country, 2025-2035
  • Figure 105: South Asia & Pacific Market Value (USD Million) Analysis by Biomarker Type, 2020-2035
  • Figure 106: South Asia & Pacific Market Volume (Units) Analysis by Biomarker Type, 2020-2035
  • Figure 107: South Asia & Pacific Market Value Share (%) and BPS Analysis by Biomarker Type, 2025-2035
  • Figure 108: South Asia & Pacific Market Y-o-Y Growth (%) Projections by Biomarker Type, 2025-2035
  • Figure 109: South Asia & Pacific Market Value (USD Million) Analysis by Application, 2020-2035
  • Figure 110: South Asia & Pacific Market Volume (Units) Analysis by Application, 2020-2035
  • Figure 111: South Asia & Pacific Market Value Share (%) and BPS Analysis by Application, 2025-2035
  • Figure 112: South Asia & Pacific Market Y-o-Y Growth (%) Projections by Application, 2025-2035
  • Figure 113: South Asia & Pacific Market Value (USD Million) Analysis by End User, 2020-2035
  • Figure 114: South Asia & Pacific Market Volume (Units) Analysis by End User, 2020-2035
  • Figure 115: South Asia & Pacific Market Value Share (%) and BPS Analysis by End User, 2025-2035
  • Figure 116: South Asia & Pacific Market Y-o-Y Growth (%) Projections by End User, 2025-2035
  • Figure 117: South Asia & Pacific Market Attractiveness by Biomarker Type, 2025-2035
  • Figure 118: South Asia & Pacific Market Attractiveness by Application, 2025-2035
  • Figure 119: South Asia & Pacific Market Attractiveness by End User, 2025-2035
  • Figure 120: South Asia & Pacific Market Attractiveness by Country, 2025-2035
  • Figure 121: Latin America Market Value (USD Million) by Biomarker Type, 2025-2035
  • Figure 122: Latin America Market Value (USD Million) by Application, 2025-2035
  • Figure 123: Latin America Market Value (USD Million) by End User, 2025-2035
  • Figure 124: Latin America Market Value (USD Million) by Country, 2025-2035
  • Figure 125: Latin America Market Value (USD Million) Analysis by Country, 2020-2035
  • Figure 126: Latin America Market Volume (Units) Analysis by Country, 2020-2035
  • Figure 127: Latin America Market Value Share (%) and BPS Analysis by Country, 2025-2035
  • Figure 128: Latin America Market Y-o-Y Growth (%) Projections by Country, 2025-2035
  • Figure 129: Latin America Market Value (USD Million) Analysis by Biomarker Type, 2020-2035
  • Figure 130: Latin America Market Volume (Units) Analysis by Biomarker Type, 2020-2035
  • Figure 131: Latin America Market Value Share (%) and BPS Analysis by Biomarker Type, 2025-2035
  • Figure 132: Latin America Market Y-o-Y Growth (%) Projections by Biomarker Type, 2025-2035
  • Figure 133: Latin America Market Value (USD Million) Analysis by Application, 2020-2035
  • Figure 134: Latin America Market Volume (Units) Analysis by Application, 2020-2035
  • Figure 135: Latin America Market Value Share (%) and BPS Analysis by Application, 2025-2035
  • Figure 136: Latin America Market Y-o-Y Growth (%) Projections by Application, 2025-2035
  • Figure 137: Latin America Market Value (USD Million) Analysis by End User, 2020-2035
  • Figure 138: Latin America Market Volume (Units) Analysis by End User, 2020-2035
  • Figure 139: Latin America Market Value Share (%) and BPS Analysis by End User, 2025-2035
  • Figure 140: Latin America Market Y-o-Y Growth (%) Projections by End User, 2025-2035
  • Figure 141: Latin America Market Attractiveness by Biomarker Type, 2025-2035
  • Figure 142: Latin America Market Attractiveness by Application, 2025-2035
  • Figure 143: Latin America Market Attractiveness by End User, 2025-2035
  • Figure 144: Latin America Market Attractiveness by Country, 2025-2035
  • Figure 145: Middle East & Africa Market Value (USD Million) by Biomarker Type, 2025-2035
  • Figure 146: Middle East & Africa Market Value (USD Million) by Application, 2025-2035
  • Figure 147: Middle East & Africa Market Value (USD Million) by End User, 2025-2035
  • Figure 148: Middle East & Africa Market Value (USD Million) by Country, 2025-2035
  • Figure 149: Middle East & Africa Market Value (USD Million) Analysis by Country, 2020-2035
  • Figure 150: Middle East & Africa Market Volume (Units) Analysis by Country, 2020-2035
  • Figure 151: Middle East & Africa Market Value Share (%) and BPS Analysis by Country, 2025-2035
  • Figure 152: Middle East & Africa Market Y-o-Y Growth (%) Projections by Country, 2025-2035
  • Figure 153: Middle East & Africa Market Value (USD Million) Analysis by Biomarker Type, 2020-2035
  • Figure 154: Middle East & Africa Market Volume (Units) Analysis by Biomarker Type, 2020-2035
  • Figure 155: Middle East & Africa Market Value Share (%) and BPS Analysis by Biomarker Type, 2025-2035
  • Figure 156: Middle East & Africa Market Y-o-Y Growth (%) Projections by Biomarker Type, 2025-2035
  • Figure 157: Middle East & Africa Market Value (USD Million) Analysis by Application, 2020-2035
  • Figure 158: Middle East & Africa Market Volume (Units) Analysis by Application, 2020-2035
  • Figure 159: Middle East & Africa Market Value Share (%) and BPS Analysis by Application, 2025-2035
  • Figure 160: Middle East & Africa Market Y-o-Y Growth (%) Projections by Application, 2025-2035
  • Figure 161: Middle East & Africa Market Value (USD Million) Analysis by End User, 2020-2035
  • Figure 162: Middle East & Africa Market Volume (Units) Analysis by End User, 2020-2035
  • Figure 163: Middle East & Africa Market Value Share (%) and BPS Analysis by End User, 2025-2035
  • Figure 164: Middle East & Africa Market Y-o-Y Growth (%) Projections by End User, 2025-2035
  • Figure 165: Middle East & Africa Market Attractiveness by Biomarker Type, 2025-2035
  • Figure 166: Middle East & Africa Market Attractiveness by Application, 2025-2035
  • Figure 167: Middle East & Africa Market Attractiveness by End User, 2025-2035
  • Figure 168: Middle East & Africa Market Attractiveness by Country, 2025-2035
  • Figure 169: USA Market Value (USD Million) by Biomarker Type, 2025-2035
  • Figure 170: USA Market Volume (Units) by Biomarker Type, 2025-2035
  • Figure 171: USA Market Value (USD Million) by Application, 2025-2035
  • Figure 172: USA Market Volume (Units) by Application, 2025-2035
  • Figure 173: USA Market Value (USD Million) by End User, 2025-2035
  • Figure 174: USA Market Volume (Units) by End User, 2025-2035
  • Figure 175: Canada Market Value (USD Million) by Biomarker Type, 2025-2035
  • Figure 176: Canada Market Volume (Units) by Biomarker Type, 2025-2035
  • Figure 177: Canada Market Value (USD Million) by Application, 2025-2035
  • Figure 178: Canada Market Volume (Units) by Application, 2025-2035
  • Figure 179: Canada Market Value (USD Million) by End User, 2025-2035
  • Figure 180: Canada Market Volume (Units) by End User, 2025-2035
  • Figure 181: Germany Market Value (USD Million) by Biomarker Type, 2025-2035
  • Figure 182: Germany Market Volume (Units) by Biomarker Type, 2025-2035
  • Figure 183: Germany Market Value (USD Million) by Application, 2025-2035
  • Figure 184: Germany Market Volume (Units) by Application, 2025-2035
  • Figure 185: Germany Market Value (USD Million) by End User, 2025-2035
  • Figure 186: Germany Market Volume (Units) by End User, 2025-2035
  • Figure 187: UK Market Value (USD Million) by Biomarker Type, 2025-2035
  • Figure 188: UK Market Volume (Units) by Biomarker Type, 2025-2035
  • Figure 189: UK Market Value (USD Million) by Application, 2025-2035
  • Figure 190: UK Market Volume (Units) by Application, 2025-2035
  • Figure 191: UK Market Value (USD Million) by End User, 2025-2035
  • Figure 192: UK Market Volume (Units) by End User, 2025-2035
  • Figure 193: France Market Value (USD Million) by Biomarker Type, 2025-2035
  • Figure 194: France Market Volume (Units) by Biomarker Type, 2025-2035
  • Figure 195: France Market Value (USD Million) by Application, 2025-2035
  • Figure 196: France Market Volume (Units) by Application, 2025-2035
  • Figure 197: France Market Value (USD Million) by End User, 2025-2035
  • Figure 198: France Market Volume (Units) by End User, 2025-2035
  • Figure 199: China Market Value (USD Million) by Biomarker Type, 2025-2035
  • Figure 200: China Market Volume (Units) by Biomarker Type, 2025-2035
  • Figure 201: China Market Value (USD Million) by Application, 2025-2035
  • Figure 202: China Market Volume (Units) by Application, 2025-2035
  • Figure 203: China Market Value (USD Million) by End User, 2025-2035
  • Figure 204: China Market Volume (Units) by End User, 2025-2035
  • Figure 205: Japan Market Value (USD Million) by Biomarker Type, 2025-2035
  • Figure 206: Japan Market Volume (Units) by Biomarker Type, 2025-2035
  • Figure 207: Japan Market Value (USD Million) by Application, 2025-2035
  • Figure 208: Japan Market Volume (Units) by Application, 2025-2035
  • Figure 209: Japan Market Value (USD Million) by End User, 2025-2035
  • Figure 210: Japan Market Volume (Units) by End User, 2025-2035
  • Figure 211: South Korea Market Value (USD Million) by Biomarker Type, 2025-2035
  • Figure 212: South Korea Market Volume (Units) by Biomarker Type, 2025-2035
  • Figure 213: South Korea Market Value (USD Million) by Application, 2025-2035
  • Figure 214: South Korea Market Volume (Units) by Application, 2025-2035
  • Figure 215: South Korea Market Value (USD Million) by End User, 2025-2035
  • Figure 216: South Korea Market Volume (Units) by End User, 2025-2035
  • Figure 217: India Market Value (USD Million) by Biomarker Type, 2025-2035
  • Figure 218: India Market Volume (Units) by Biomarker Type, 2025-2035
  • Figure 219: India Market Value (USD Million) by Application, 2025-2035
  • Figure 220: India Market Volume (Units) by Application, 2025-2035
  • Figure 221: India Market Value (USD Million) by End User, 2025-2035
  • Figure 222: India Market Volume (Units) by End User, 2025-2035
  • Figure 223: Brazil Market Value (USD Million) by Biomarker Type, 2025-2035
  • Figure 224: Brazil Market Volume (Units) by Biomarker Type, 2025-2035
  • Figure 225: Brazil Market Value (USD Million) by Application, 2025-2035
  • Figure 226: Brazil Market Volume (Units) by Application, 2025-2035
  • Figure 227: Brazil Market Value (USD Million) by End User, 2025-2035
  • Figure 228: Brazil Market Volume (Units) by End User, 2025-2035

Frequently Asked Questions

How big is the MRI-based quantitative biomarkers market in 2025?

The global MRI-based quantitative biomarkers market is valued at USD 326.5 million in 2025.

What will be the size of MRI-based quantitative biomarkers market in 2035?

The size for the MRI-based quantitative biomarkers market is projected to reach USD 536.9 million by 2035.

How much will be the MRI-based quantitative biomarkers market growth between 2025 and 2035?

The MRI-based quantitative biomarkers market is expected to grow at a 5.1% CAGR between 2025 and 2035.

What are the key biomarker type segments in the MRI-based quantitative biomarkers market?

The key biomarker type segments in the MRI-based quantitative biomarkers market are metabolic, tissue microstructure, relaxometry, perfusion/vascular, susceptibility, structural, functional, and others.

Which end user segment is expected to contribute significant share in the MRI-based quantitative biomarkers market in 2025?

In terms of end users, diagnostic imaging centers segment is set to command 31.5% share in the MRI-based quantitative biomarkers market in 2025.

Explore Similar Insights

Future Market Insights

MRI-based Quantitative Biomarkers Market

Chat With

MaRIA

Hi There, I am MaRIA, Your Market Research Intelligence Assistant. How may I help you?