

- Market Size (2026)
- USD 183.7 Mn
- Forecast (2036)
- USD 969.6 Mn
- CAGR (2026 to 2036)
- 18.1%
3D-Knit Seat and Panel Cover Materials Market Size, Market Forecast and Outlook By FMI
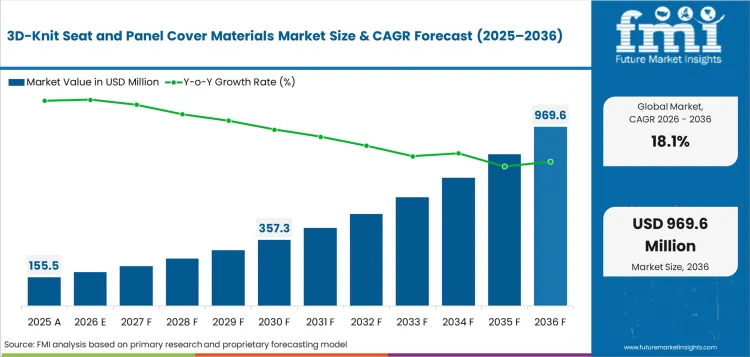
3D-knit seat and panel cover materials market was valued at USD 155.5 million in 2025 and is projected to reach USD 183.7 million in 2026. It is forecast to reach USD 969.6 million by 2036 at 18.1% CAGR. Direct OEM programs are projected to lead sales channel demand with 57.0% share. Recycled polyester yarn is expected to hold 48.0% share by material type in 2026.
Summary of the 3D-Knit Seat and Panel Cover Materials Market
- Demand and Growth Drivers
- Demand is led by seat cover redesign as automakers use knitted skins to reduce cutting waste and simplify trim assembly.
- Electric vehicle interior programs support adoption because designers need lighter covers with a softer cabin feel.
- Recycled material targets in Europe raise interest in mono-material yarn systems that support easier recovery.
- Supplier confidence is improving as Lear, FORVIA, Tesca, and Toyota Boshoku link textile programs with circular interior goals.
- Product and Segment View
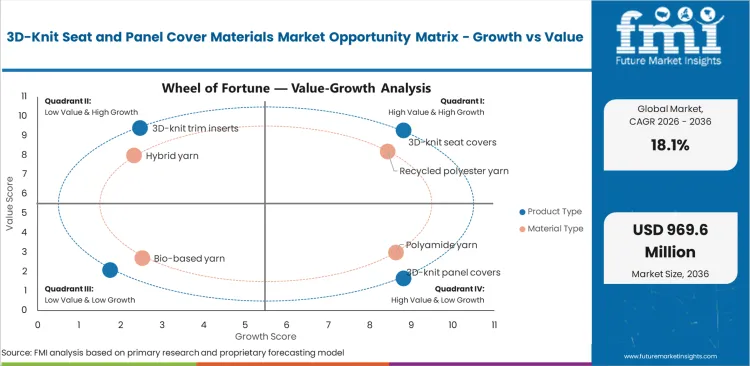
- 3D-knit seat covers are projected to account for 46.0% share of product type demand in 2026 as seating gives the clearest use case.
- Recycled polyester yarn is expected to account for 48.0% share in 2026 as it fits single-fiber cover design and traceable recycled content.
- Single-piece flat knit is forecast to hold 41.0% share by knitting structure in 2026 as it limits seams and supports shaped covers.
- Direct OEM programs are projected at 57.0% share in 2026 since seat covers must be specified before vehicle trim validation closes.
- Geography and Competitive Outlook
- Spain is expected to post 22.4% CAGR through 2036 as local EV interior programs and textile suppliers create a visible proof point for knitted covers.
- China is projected at 21.1% CAGR through 2036 because vehicle output scale and electric platform refresh cycles support textile trials.
- Key players such as Lear and FORVIA show clearer visibility through recycled interior textile programs and global seating relationships.
- Smaller textile suppliers can win pilots when they prove yarn traceabilityand vehicle-grade color control.
- Analyst Opinion
- Nikhil Kaitwade, Principal Consultant at FMI says, “I see 3D-knit automotive covers less as a fabric swap and more as a manufacturing choice. The value sits in knitting a shaped surface close to final assembly, then proving that the cover survives seat validation. Suppliers that can show recycled yarn proof and repeat color control are likely to retain competitive edge before those selling fabric rolls alone.”
- 3D-Knit Seat and Panel Cover Materials Market Value Analysis
- The market is moving from concept interiors into selected production programs for seat covers and door inserts.
- Value is concentrated in electric vehicle interiors where visible trim materials help automakers signal cabin differentiation.
- Recycled yarn inputs raise material value when suppliers can document content and keep shade variation within vehicle limits.
- Costs stay higher than standard woven or nonwoven covers because knitting equipment time and testing cycles add expense.
Key Takeaways, Market Size, and Forecast
- The 3D-knit seat and panel cover materials market was valued at USD 155.5 million in 2025.
- By 2036, the 3D-knit seat and panel cover materials market is expected to be worth USD 969.6 million.
- From 2026 to 2036, the market is projected to expand at 18.1% CAGR.
- The market is projected to create an incremental opportunity of USD 785.9 million between 2026 and 2036.
- Direct OEM programs are projected to account for 57.0% share in 2026.
- Recycled polyester yarn is expected to account for 48.0% share of material type in 2026.
- Spain at 22.4% CAGR and China at 21.1% CAGR are some of the countries with a stronger demand outlook.
Interior teams need cabin materials that look different and still pass vehicle testing. In December 2025, Kia linked 3D knit fabric with lightweight and breathable cabin surfaces in the EV5 WKNDR concept. That gives knitted materials a practical route through EV concepts before wider trim use. Seat cover suppliers also need proof tied to real vehicle programs. In October 2025, BADER said BADER Ukraine makes fabric seat covers for the CUPRA Tribe Terramar.
The same program included 3D-knitted bucket seats. That helps suppliers show OEM-ready execution instead of sample-level capability. Repeat material control is the next barrier. In July 2025, the Asahi Kasei patent listed 2.5 mm to 12 mm thickness and 300 to 1000 g/m² basis weight for a three-dimensional knitted covering material. Those ranges give manufacturers clearer targets for testing and repeat supply.
3D-Knit Seat and Panel Cover Materials Market Definition
The 3D-knit seat and panel cover materials market covers knitted textile skins used on vehicle seats, door panels, console panels, and trim inserts. Scope includes single-piece knitted covers, shaped spacer structures, jacquard surfaces, and modular knitted skins supplied for OEM or Tier 1 trim programs. Revenue covers knitted material value and cover-ready textile assemblies. Finished seats, foam cushions, seat frames, leather covers, conventional woven upholstery, and textile machinery are excluded unless the knitted cover material is separately identified.
3D-Knit Seat and Panel Cover Materials Market Inclusions
Market scope includes 3D-knit seat covers for front and rear seating. It also includes knitted door panel surfaces, dashboard inserts, console panels, and trim skins made from recycled polyester, polyamide, hybrid yarn, or bio-based yarn. The scope covers OEM production programs, Tier 1 trim contracts, design studio trials, and limited custom aftermarket use. It includes knitted covers when shaping happens during the knitting process and not through cutting alone.
3D-Knit Seat and Panel Cover Materials Market Exclusions
The market excludes leather upholstery, vinyl trim skins, molded plastic panels, non-knitted woven fabrics, and standard seat foam. It also excludes apparel knitwear, furniture textiles, and aftermarket slipcovers sold without vehicle-grade validation. Contract values for whole seats are excluded unless the knitted cover material can be separated. Textile knitting machines are also excluded as they are capital equipment and not cover material revenue.
3D-Knit Seat and Panel Cover Materials Market Research Methodology
- Primary Research: FMI analysts reviewed supplier portfolios, seating program needs, textile qualification steps, and OEM trim design priorities in major automotive countries.
- Desk Research: The study used public data from automotive associations, government statistics bodies, company disclosures, and peer-reviewed textile research.
- Market sizing and forecasting: Market size was estimated through a hybrid bottom-up and top-down model using vehicle production pools and visible adoption rates for knitted interior programs.
- Data validation: Forecast checks compared country vehicle output, supplier launches, recycled plastics policy, and comparable use of shaped textile covers in cabin trim.
Why is the 3D-Knit Seat and Panel Cover Materials Market Growing?
- Automakers are testing shaped knitted covers as one-piece construction can reduce cutting waste in selected seat trim programs.
- Electric vehicle cabins need lighter visual surfaces as interior differentiation affects buyer choice when powertrain design becomes less visible.
- Recycled plastic rules in Europe are moving automakers toward material systems with clearer recovery and content documentation.
3D-knit cover materials are gaining use where cabin teams need shaped textile surfaces without heavy stitching. CUPRA said in March 2026 that its Raval CUP Bucket seat cover is made in one piece on one knitting machine. The same program uses recycled yarn made from Mediterranean plastic waste and local production within 100 km of the vehicle site. This example shows why the market grows through visible OEM programs first and broader trim adoption later.
Regulation is another growth driver in the industry. The European Parliament said in December 2025 that new vehicle rules will require 15% recycled plastic content within six years and 25% within ten years. Knitted covers do not solve the full plastics challenge alone. They help suppliers present cabin materials with cleaner input records and simpler recovery logic when yarn selection is controlled early. The opportunity also connects with dope-dyed recycled polyester because color control can reduce wet finishing steps for vehicle trim yarn.
Market Segmentation Analysis
- 3D-knit seat covers are projected to reach 46.0% share in 2026 as seat programs create the clearest validation route.
- Recycled polyester yarn is expected to represent 48.0% share in 2026 as recycled content becomes a cabin material requirement.
- Single-piece flat knit is forecast to account for 41.0% share in 2026 as shaped covers reduce cutting and sewing steps.
- Battery electric cars are projected to capture 38.0% share in 2026 as new platforms carry more interior material trials.
- Front seat covers are estimated to account for 43.0% share in 2026 as visible seating surfaces receive earlier design attention.
- Direct OEM programs are projected to capture 57.0% share in 2026 as cover material choice is locked before trim validation.
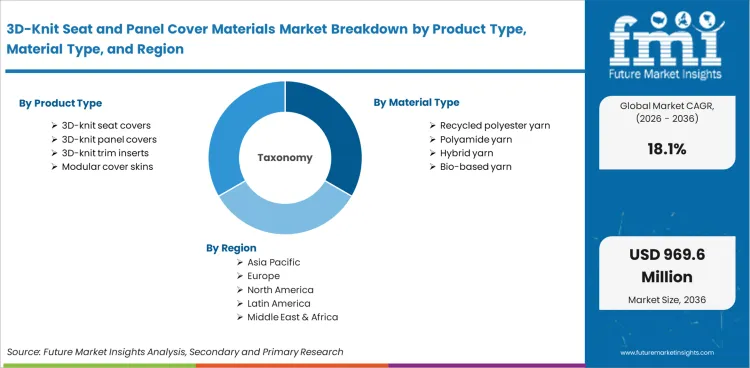
The market is divided into six primary segment groups based on product type, material type, knitting structure, vehicle type, application, and sales channel. Product type covers seat covers, panel covers, trim inserts, and modular skins. Material type explains recycled content and fiber behavior under automotive testing. Knitting structure defines how the cover is shaped and how it performs after repeated use. Vehicle type and application show when adoption starts before moving into wider interior packages.
Insights into the 3D-Knit Seat Covers Product Type Segment
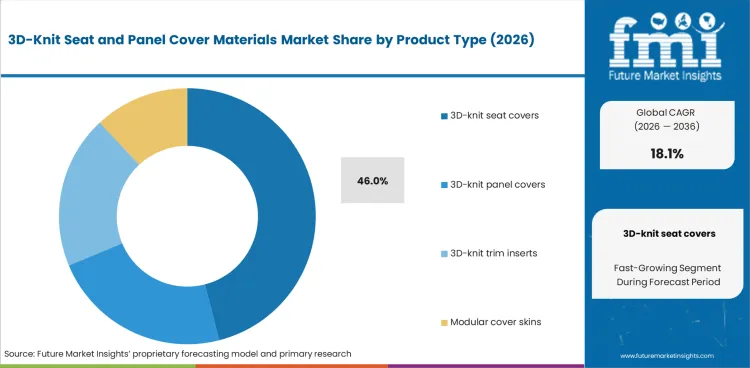
- 3D-knit seat covers are projected to account for 46.0% share of product type demand in 2026. Seating gives the largest visible surface for OEM cabin differentiation.
- Panel covers and trim inserts are smaller in 2026. They remain useful where designers want a soft surface on doors or consoles without adding thick layers.
Insights into the Recycled Polyester Yarn Material Type Segment
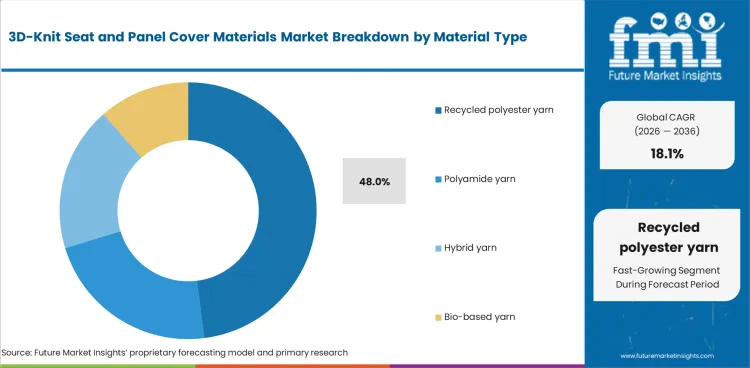
- Recycled polyester yarn is expected to represent 48.0% share of material type demand in 2026. OEMs can document recycled content more easily when the yarn base is consistent.
- Polyamide and hybrid yarns keep a role when abrasion and touch feel decide material choice. Bio-based yarns need more validation before wider cabin use.
Insights into the Single-Piece Flat Knit Structure Segment
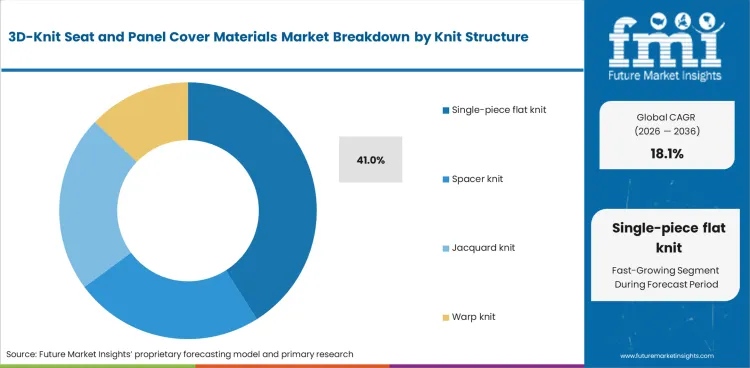
- Single-piece flat knit is forecast to account for 41.0% share of knitting structure demand in 2026. The structure can create shaped covers with fewer cut parts.
- Spacer knit and jacquard knit address comfort and design needs in selected programs. Warp knit remains useful where dimensional stability matters more than shape freedom.
Insights into the Battery Electric Cars Vehicle Type Segment
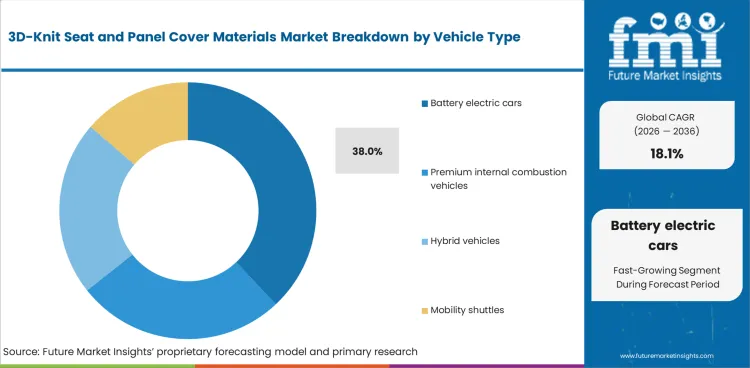
- Battery electric cars are projected to capture 38.0% share of vehicle type demand in 2026. New EV cabins give suppliers an earlier route for material trials.
- Hybrid vehicles and premium internal combustion vehicles will still use knitted surfaces. Adoption is slower as platform refresh cycles are longer.
Insights into the Front Seat Covers Application Segment
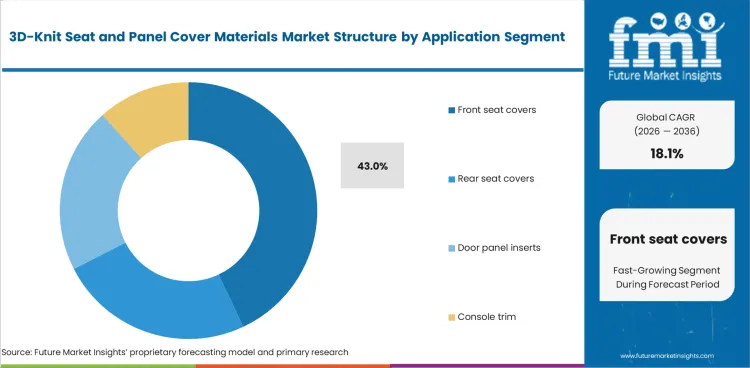
- Front seat covers are estimated to account for 43.0% share of application demand in 2026. Front seats receive earlier design attention because drivers see and touch them first.
- Door panel inserts and console trim are growing from a smaller base. They need tighter color matching with surrounding plastic parts before broad platform use.
Insights into the Direct OEM Programs Sales Channel Segment
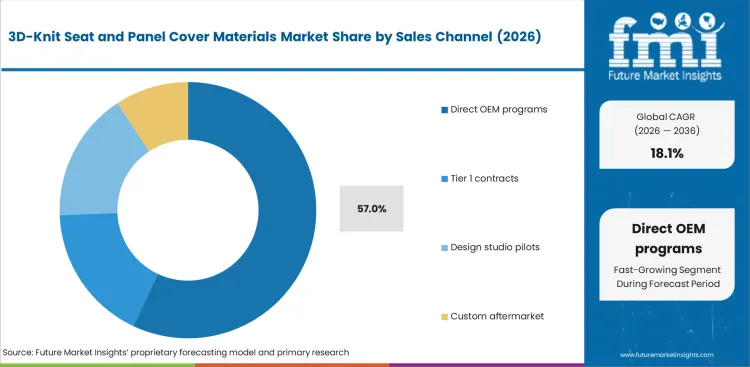
- Direct OEM programs are projected to account for 57.0% share of sales channel demand in 2026. Automakers need cover material data before seat tooling decisions are fixed.
- Tier 1 contracts stay important as seat makers control validation and supply timing. Design studio pilots help suppliers enter future vehicle programs.
3D-Knit Seat and Panel Cover Materials Market Drivers, Restraints, and Opportunities
- One-piece cover construction is raising buyer interest as it can cut fabric waste during selected seat trim programs.
- Automotive validation slows scale as abrasion and flammability tests take time before program release.
- Recycled yarn documentation creates opportunities as OEMs prepare for stricter recycled plastic content rules in Europe.
Trim simplification is a key factor driving demand. In April 2026, Kobleder presented knitted interior solutions at Techtextil 2026, highlighting functional knit structures for seat covers and interior components. This expands the application scope beyond seat skins to broader panel-cover opportunities, allowing buyers to evaluate these materials on cabin aesthetics and overall manufacturing logic.
Automotive Validation Slows Scale
Qualification time is one of the main restraints. Vehicle seat covers must pass abrasion and comfort tests before production release. A knitted surface that feels good in a concept car still needs repeat performance under heat and daily use. This keeps near-term adoption focused on EV launches and premium trim lines with enough design budget.
Recycled Yarn Documentation Adds Value
Recycled yarn systems creates a lucrative opportunity when material records stay simple. The Council of the European Union adopted a 2025 position on vehicle circularity that includes future recycled plastic content rules. Knitted covers can help when suppliers use traceable yarn and avoid complex mixed layers. OEMs will reward cover systems that meet design goals and support cleaner material recovery.
Analysis of 3D-Knit Seat and Panel Cover Materials Market by Key Countries
.webp "Top Country Growth Comparison 3d Knit Seat And Panel Cover Materials Market Cagr (2026 2036)")
| Country | CAGR |
|---|---|
| Spain | 22.4% |
| China | 21.1% |
| South Korea | 19.4% |
| Germany | 18.8% |
| United States | 17.3% |
| Japan | 16.9% |
| India | 16.2% |
Source: Future Market Insights, 2026.
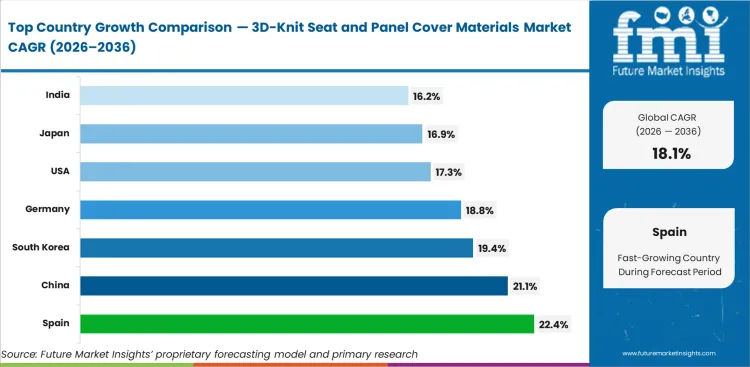
3D-Knit Seat and Panel Cover Materials Market CAGR Analysis by Country
- Spain is expected to post 22.4% CAGR by 2036 as local EV programs and supplier proximity support visible trials of 3D-knit covers.
- China is projected to record 21.1% CAGR by 2036 as vehicle output scale and EV model refresh cycles widen textile trials.
- South Korea is projected to rise at 19.4% CAGR by 2036 as Hyundai Transys and local OEM programs test new seat concepts.
- Germany is expected to advance at 18.8% CAGR by 2036 as premium brands evaluate recycled interior materials.
- The United States is expected to expand at 17.3% CAGR by 2036 as Lear and Sage Automotive Interiors support local trim supply.
- Japan and India track below the global rate as cost and qualification speed limit wider platform conversion.
Demand for 3D-knit seat and panel cover materials is forecast to rise at 18.1% CAGR from 2026 to 2036. Country-level analysis covers markets when vehicle production and supplier presence create a clear adoption route. Recycled material policy and electric vehicle design programs add support.
Demand Outlook for 3D-Knit Seat and Panel Cover Materials Market in Spain
Spain is expected to post 22.4% CAGR through 2036 as local EV cabin programs use 3D knitting for visible seat surfaces. In January 2026, Tribe Editions for the Formentor and Terramar added 3D knitted bucket seats, showing how knitted upholstery is moving into configurable model variants. This creates a local route for yarn sourcing and vehicle trim validation that few countries can match.
- Barcelona-area EV programs can test knitted covers where local design teams and textile suppliers work close to assembly.
- Tesca gains a route to use one-piece cover proof in future European trim programs.
- Spanish suppliers can offer shorter development loops when OEMs need recycled yarn proof and fast design changes.
Sales Analysis of 3D-Knit Seat and Panel Cover Materials Market in China
China begins from the supply side because domestic vehicle production and textile capacity are both deep. The National Bureau of Statistics of China reported 12.0% growth in automobile manufacturing for January and February 2025. China is projected to record a 21.1% CAGR through 2036 as EV platform refreshes create space for new seat and panel surfaces. Large domestic programs can move knitted covers from design trials into higher volume trims when price points fall.
- Shanghai and Hefei EV programs can test knitted trim as a cabin update during model refreshes.
- Guangdong textile supply can support faster sampling when automakers need color and hand-feel options.
- Local volume favors direct OEM programs as material decisions can be bundled with trim and seat sourcing.
Sales Analysis of 3D-Knit Seat and Panel Cover Materials Market in South Korea
South Korean automakers compare cabin materials against comfort and recyclability targets before changing seat trim. Hyundai Transys and BASF presented a modular concept seat in November 2025 that used recyclable thermoplastic polyurethane in a design-led seat system. South Korea is projected to rise at 19.4% CAGR through 2036 as local suppliers test lower-waste trim materials near OEM engineering teams. Suppliers with vehicle-grade yarn proof and seat testing access are better placed to win early awards.
- Seoul design teams can evaluate knitted trim on concept seats before material lock-in.
- Ulsan and Hwaseong vehicle programs can connect EV interiors with lighter cover choices.
- Seat suppliers can use modular seating work to compare knitted covers with foam and plastic changes.
Opportunity Analysis of 3D-Knit Seat and Panel Cover Materials Market in Germany
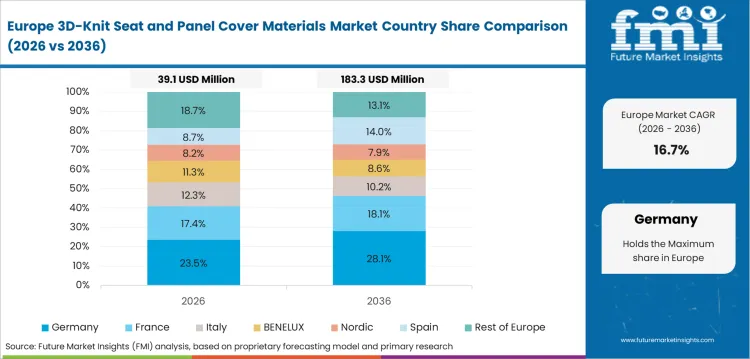
Demand in Germany is shaped by premium vehicle interiors and tighter material recovery rules in Europe. Vehicle makers need visible materials that support brand design and documented recycled content. The German Association of the Automotive Industry reported that domestic passenger car production reached 2.5 million units in the first seven months of 2025. Germany is expected to advance at 18.8% CAGR through 2036 as premium EV and concept cabin programs create early demand above the global average.
- Stuttgart and Munich programs can test knitted skins when premium cabin design carries buyer value.
- Seat suppliers need abrasion proof before German OEMs approve one-piece knitted covers for volume trims.
- Saxony EV production gives textile suppliers a route into newer vehicle platforms and shorter design cycles.
Demand Outlook for 3D-Knit Seat and Panel Cover Materials Market in the United States
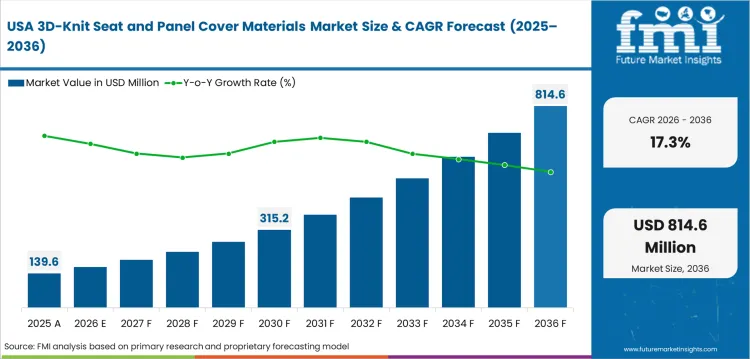
The United States is expected to expand at 17.3% CAGR through 2036 as local seat suppliers move recycled textile programs toward OEM validation. The Federal Reserve Bank of St. Louis listed domestic auto production at 111.337 thousand units in March 2026 using Bureau of Economic Analysis data. Lear and Sage Automotive Interiors give the country a direct route from yarn selection to seating program discussions. Buyers will still ask for cost proof against woven covers before broader platform adoption.
- Michigan seat programs can evaluate ReNewKnit-style materials near OEM engineering teams.
- South Carolina and Alabama vehicle plants can test knitted covers on trim packages tied to EV launches.
- California design studios can use knitted panel skins when cabin differentiation carries design value.
Future Outlook for 3D-Knit Seat and Panel Cover Materials Market in Japan
Japan’s industry is tied to disciplined material validation and supplier-led circular design work. Toyota Boshoku’s 2025 report describes urethane material separation from used seats for new interior components. Japan is forecast at 16.9% CAGR through 2036 as seat and interior suppliers test recyclable cover systems through slower but careful program cycles. Adoption is likely to accelerate as knitted covers pass touch and cost checks for mainstream trims.
- Toyota Boshoku can connect cover material choices with wider seat recycling and interior component work.
- Nagoya suppliers can use knitted covers in concept interiors before moving into production trims.
- Japanese OEMs will favor materials with stable shade control and low defect risk during trim assembly.
Demand Outlook for 3D-Knit Seat and Panel Cover Materials Market in India
India’s adoption path is shaped by a large vehicle base and cost-sensitive trim decisions. India is forecast to grow at 16.2% CAGR through 2036 as domestic passenger vehicle output gives suppliers a large test pool. The Society of Indian Automobile Manufacturers reported total vehicle production of 31.0 million units in April 2024 to March 2025. Wider use depends on whether local yarn and knitting partners can reduce cost for mid-market models.
- Pune and Chennai vehicle clusters can test knitted covers in export-linked trim packages first.
- Gujarat EV investments can create pilot demand for visible recycled interior surfaces.
- Local suppliers need cost control before knitted seat covers move beyond premium and export vehicles.
India’s cost comparison also links with automotive foams as seat system choices are evaluated as a complete comfort package. [FMI]
Competitive Landscape and Strategic Positioning
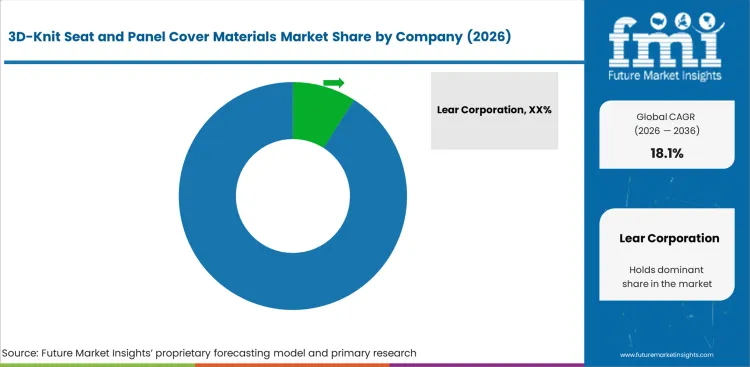
- Competition is concentrated around vehicle-grade textile validation and seat program access instead of yarn supply alone.
- Lear and FORVIA have the clearest visible recycled interior textile proof through published program activity.
- Tesca holds a specific role as the CUPRA Raval knitted cover gives it a named production-linked reference.
- Entry barriers include abrasion testing and the ability to supply the same shade across vehicle plants.
Key players such as Lear have early visibility as ReNewKnit ties recycled polyester with seating and interior applications. The company said in July 2024 that ReNewKnit was being supplied for multiple global automakers during 2024. That position affects buyer access because seat cover suppliers need access to OEM validation gates before material choice is locked. Lear can also connect cover material work with seat system engineering.
Tesca holds a leading role in knitted cover execution. Smaller textile firms need similar proof to compete for direct OEM work. Companies such as Toyota Boshoku, Adient, Hyundai Transys, and Sage Automotive Interiors are focusing on seat cover adoption which often follows seat architecture decisions. These companies influence trim validation and launch readiness. Competitive choices also overlap with the wider automotive interior space as cabin surfaces compete for the same design budget.
Key Companies in the 3D-Knit Seat and Panel Cover Materials Market
Competition is clearer by role as seating scale, textile development, and knitted cover execution differ sharply.
- Seat System Leaders: Lear Corporation and FORVIA SE have direct access to OEM seat programs and recycled material development. Their advantage comes from validation reach and global supply discussions.
- Trim and Textile Specialists: Tesca Group and Sage Automotive Interiors Inc. have material and surface knowledge that supports knitted cover sampling.
- Interior System Integrators: Adient plc, Toyota Boshoku Corporation, and Hyundai Transys Inc. influence how cover materials enter seat architectures.
Competitive Benchmarking: 3D-Knit Seat and Panel Cover Materials Market
| Company | Knitted Cover Program Access | Recycled Yarn Proof | Seat Validation Support | Geographic Footprint |
|---|---|---|---|---|
| Lear Corporation | High | Strong | Strong | Global with North America and Europe seating depth |
| FORVIA SE | High | Strong | Strong | Global with European recycled cover positioning |
| Adient plc | High | Medium | Strong | Global seating scale with broad OEM reach |
| Toyota Boshoku Corporation | Medium | Medium | Strong | Japan centered with global interior system reach |
| Tesca Group | Medium | Strong | Medium | Europe centered with named CUPRA knitted cover role |
| Hyundai Transys Inc. | Medium | Medium | Strong | South Korea centered with global OEM links |
| Sage Automotive Interiors Inc. | Medium | Medium | Medium | United States centered with automotive textile depth |
Source: Future Market Insights competitive analysis, 2026. Ratings reflect relative positioning based on knitted cover program access, recycled yarn proof, and seat validation support.
Key Developments in the 3D-Knit Seat and Panel Cover Materials Market
- In May 2026, Borgstena highlighted its 3D Knit technology for automotive interiors. The company described yarn becoming shape with fewer production steps and less excess waste.
- In March 2026, Xiaomi showcased Vision Gran Turismo with 3D knitted natural fabric seating at MWC Barcelona. The concept links the seats and door panels into one continuous interior surface.
- In January 2026, Italdesign promoted the ReSedo circular automotive seat project with seamless 3D-knitted textiles made from recycled yarns. The project used Nike Grind textile scrap and positioned the seat architecture around easier disassembly.
Key Players in the 3D-Knit Seat and Panel Cover Materials Market
- Lear Corporation
- FORVIA SE
- Adient plc
- Toyota Boshoku Corporation
- Tesca Group
- Hyundai Transys Inc.
- Sage Automotive Interiors Inc.
Report Scope and Coverage
| Parameter | Value |
|---|---|
| Quantitative Units | USD 183.7 million in 2026 to USD 969.6 million by 2036 at 18.1% CAGR |
| Market Definition | 3D-knit textile covers used on vehicle seats and interior panels |
| Product Type | 3d-Knit Seat Covers, 3d-Knit Panel Covers, 3d-Knit Trim Inserts, Modular Cover Skins |
| Material Type | Recycled Polyester Yarn, Polyamide Yarn, Hybrid Yarn, Bio-Based Yarn |
| Knitting Structure | Single-Piece Flat Knit, Spacer Knit, Jacquard Knit, Warp Knit |
| Vehicle Type | Battery Electric Cars, Premium Internal Combustion Vehicles, Hybrid Vehicles, Mobility Shuttles |
| Application | Front Seat Covers, Rear Seat Covers, Door Panel Inserts, Console Trim |
| Sales Channel | Direct OEM Programs, Tier 1 Contracts, Design Studio Pilots, Custom Aftermarket |
| Regions Covered | North America, Latin America, Europe, East Asia, South Asia, Oceania, Middle East and Africa |
| Countries Covered | United States, China, Germany, Japan, South Korea, Spain, India |
| Key Companies Profiled | Lear Corporation, FORVIA SE, Adient plc, Toyota Boshoku Corporation, Tesca Group, Hyundai Transys Inc., Sage Automotive Interiors Inc. |
| Forecast Period | 2026 to 2036 |
| Approach | Hybrid bottom-up and top-down model based on vehicle output, supplier programs, and recycled material policy signals |
Market Analysis by Segments
By Product Type
- 3D-knit seat covers
- 3D-knit panel covers
- 3D-knit trim inserts
- Modular cover skins
By Material Type
- Recycled polyester yarn
- Polyamide yarn
- Hybrid yarn
- Bio-based yarn
By Knitting Structure
- Single-piece flat knit
- Spacer knit
- Jacquard knit
- Warp knit
By Vehicle Type
- Battery electric cars
- Premium internal combustion vehicles
- Hybrid vehicles
- Mobility shuttles
By Application
- Front seat covers
- Rear seat covers
- Door panel inserts
- Console trim
By Sales Channel
- Direct OEM programs
- Tier 1 contracts
- Design studio pilots
- Custom aftermarket
By Region
- North America
- Latin America
- Europe
- East Asia
- South Asia
- Oceania
- Middle East and Africa
Research Sources and Bibliography
- CUPRA. (2025, September 8). CUPRA introduces Tribe Editions: rebellious character meets sustainable innovation.
- Lear Corporation. (2024, July 30). Every Day, Striving to Be Better: Lear Publishes 2023 Sustainability Report.
- European Parliament. (2025, December 12). Circular economy: deal on new EU rules for the automotive sector.
- Council of the European Union. (2025, June 17). Circular economy: Council adopts position on the recycling of vehicles at the end of their life.
- Society of Indian Automobile Manufacturers. (2025, April 15). Performance of Auto Industry during 2024-25.
- National Bureau of Statistics of China. (2025, March 18). Industrial Production Operation from January to February 2025.
- German Association of the Automotive Industry. (2025, August 4). Electric car production at record levels in the year to date.
- European Automobile Manufacturers’ Association. (2026, April 2). Economic and Market Report: Global and EU automotive industry full-year 2025.
- Federal Reserve Bank of St. Louis. (2026, April 30). Domestic Auto Production.
- Japan Automobile Manufacturers Association. (2025, September 26). The Motor Industry of Japan 2025.
- BASF SE. (2025, November 5). Hyundai Transys and BASF unveil modular concept seat using Elastollan® TPU with SCF injection foaming technology.
- Toyota Boshoku Corporation. (2025). Toyota Boshoku Report 2025.
- Berber, D., et al. (2024). Development of Laminated Knitted Fabrics with Thermal Properties Better Than Conventional Upholstery Fabrics for Car Seat Applications. Tekstilec.
- Sahin, UK (2025). Effects of Coated Knitted Polyester Fabric Properties on Pressure Comfort and Thermal Transfer Characteristics in Automotive Seat Covers. Coatings.
This bibliography is provided for reader reference and is not exhaustive. The full report contains the complete reference list and detailed citations.
This Report Answers
- Strategic demand analysis for 3D-knit seat and panel cover materials across electric vehicles, premium vehicles, mobility shuttles, and interior trim applications.
- Market forecast from USD 183.7 million in 2026 to USD 969.6 million by 2036 at 18.1% CAGR.
- Opportunity mapping across Spain, China, South Korea, Germany, the United States, Japan, and India based on supplier activity and vehicle program readiness.
- Segment analysis by product type, material type, knitting structure, vehicle type, application, and sales channel through 2036.
- Competitive analysis of Lear Corporation, FORVIA SE, Adient plc, Toyota Boshoku Corporation, Tesca Group, Hyundai Transys Inc., and Sage Automotive Interiors Inc.
- Policy impact analysis covering European recycled plastic content rules and their effect on traceable yarn systems for automotive interiors.
Frequently Asked Questions
What is the 3D-Knit Seat and Panel Cover Materials Market size in 2026?
The 3D-knit seat and panel cover materials market is estimated at USD 183.7 million in 2026 based on FMI analysis.
What is the 3D-Knit Seat and Panel Cover Materials Market forecast for 2036?
The market is forecast to reach USD 969.6 million by 2036 as EV interior programs use more knitted surfaces.
What is the CAGR for the 3D-Knit Seat and Panel Cover Materials Market?
Between 2026 and 2036, demand is projected to expand at 18.1% CAGR as OEM programs validate knitted covers.
Which material type leads the 3D-Knit Seat and Panel Cover Materials Market?
Recycled polyester yarn is expected to lead material demand with 48.0% share in 2026 due to traceable recycled content.
Which country is forecast to grow fastest in the 3D-Knit Seat and Panel Cover Materials Market?
Spain is expected to post 22.4% CAGR through 2036 as local EV interior programs and nearby textile suppliers support a visible knitted seat cover proof point.
What does the 3D-Knit Seat and Panel Cover Materials Market include?
The market includes knitted textile covers used on vehicle seats, door panels, console panels, and related trim surfaces.
How does FMI estimate the 3D-Knit Seat and Panel Cover Materials Market forecast?
FMI uses vehicle output signals, supplier programs, recycled material policy, and segment adoption checks to validate the forecast.
How do 3D-knit covers compare with woven automotive fabrics?
3D-knit covers are useful when one-piece shaping and lower cutting waste affect trim design. Woven fabrics remain cheaper for many trims.
Preview the report firsthand - request a free sample
Get SampleGet the brochure for pricing and purchase details.
Get PDFTable of Content
- Key Takeaways
- Market Size and CAGR
- Top Growth Driver
- Fastest Growing Segment
- Leading Region
- Key Companies
- Emerging Opportunities
- Executive Summary
- Global Market Outlook
- Demand-side Trends
- Supply-side Trends
- Technology Roadmap Analysis
- Analysis and Recommendations
- Analyst Perspective (What is happening? Why now? What should investors know?)
- Key Questions Answered
- How large is the market?
- What is the CAGR?
- What are key trends?
- Which region dominates?
- Who are the leaders?
- Market Overview
- Market Coverage / Taxonomy
- Market Definition / Scope / Limitations
- Research Methodology
- Chapter Orientation
- Analytical Lens and Working Hypotheses
- Market Structure, Signals, and Trend Drivers
- Benchmarking and Cross-market Comparability
- Market Sizing, Forecasting, and Opportunity Mapping
- Research Design and Evidence Framework
- Desk Research Programme (Secondary Evidence)
- Expert Input and Fieldwork (Primary Evidence)
- Tooling, Models, and Reference Databases
- Data Engineering and Model Build
- Quality Assurance and Audit Trail
- Market Background
- Market Dynamics (Drivers, Restraints, Opportunity, Trends)
- Scenario Forecast (Optimistic, Likely, Conservative)
- Impact Analysis
- AI Impact
- Sustainability Impact
- Regulatory Impact
- Technology Impact
- Consumer / Buyer Analysis
- Purchase Drivers
- Adoption Barriers
- Buyer Journey
- Opportunity Map Analysis
- Product Life Cycle Analysis
- Supply Chain Analysis
- Investment Feasibility Matrix
- Value Chain Analysis
- PESTLE and Porter's Analysis
- Regulatory Landscape
- Regional Parent Market Outlook
- Production and Consumption Statistics
- Import and Export Statistics
- Global Market Analysis and Forecast, 2021 to 2036
- Historical Market Size Value (USD Million) & Volume (Unit) Analysis, 2021 to 2025
- Current and Future Market Size Value (USD Million) & Volume (Unit) Projections, 2026 to 2036
- Y-o-Y Growth Trend Analysis
- Absolute $ Opportunity Analysis
- Global Market Pricing Analysis, 2021 to 2036
- Global Market Analysis and Forecast, By Product Type, 2021 to 2036
- Introduction / Key Findings
- Historical Market Size Value (USD Million) & Volume (Unit) Analysis By Product Type, 2021 to 2025
- Current and Future Market Size Value (USD Million) & Volume (Unit) Analysis and Forecast By Product Type, 2026 to 2036
- 3D-knit seat covers
- 3D-knit panel covers
- 3D-knit trim inserts
- Modular cover skins
- 3D-knit seat covers
- Y-o-Y Growth Trend Analysis By Product Type, 2021 to 2025
- Absolute $ Opportunity Analysis By Product Type, 2026 to 2036
- Global Market Analysis and Forecast, By Material Type, 2021 to 2036
- Introduction / Key Findings
- Historical Market Size Value (USD Million) & Volume (Unit) Analysis By Material Type, 2021 to 2025
- Current and Future Market Size Value (USD Million) & Volume (Unit) Analysis and Forecast By Material Type, 2026 to 2036
- Recycled polyester yarn
- Polyamide yarn
- Hybrid yarn
- Bio-based yarn
- Recycled polyester yarn
- Y-o-Y Growth Trend Analysis By Material Type, 2021 to 2025
- Absolute $ Opportunity Analysis By Material Type, 2026 to 2036
- Global Market Analysis and Forecast, By Knitting Structure, 2021 to 2036
- Introduction / Key Findings
- Historical Market Size Value (USD Million) & Volume (Unit) Analysis By Knitting Structure, 2021 to 2025
- Current and Future Market Size Value (USD Million) & Volume (Unit) Analysis and Forecast By Knitting Structure, 2026 to 2036
- Single-piece flat knit
- Spacer knit
- Jacquard knit
- Warp knit
- Single-piece flat knit
- Y-o-Y Growth Trend Analysis By Knitting Structure, 2021 to 2025
- Absolute $ Opportunity Analysis By Knitting Structure, 2026 to 2036
- Global Market Analysis and Forecast, By Vehicle Type, 2021 to 2036
- Introduction / Key Findings
- Historical Market Size Value (USD Million) & Volume (Unit) Analysis By Vehicle Type, 2021 to 2025
- Current and Future Market Size Value (USD Million) & Volume (Unit) Analysis and Forecast By Vehicle Type, 2026 to 2036
- Battery electric cars
- Premium internal combustion vehicles
- Hybrid vehicles
- Mobility shuttles
- Battery electric cars
- Y-o-Y Growth Trend Analysis By Vehicle Type, 2021 to 2025
- Absolute $ Opportunity Analysis By Vehicle Type, 2026 to 2036
- Global Market Analysis and Forecast, By Application, 2021 to 2036
- Introduction / Key Findings
- Historical Market Size Value (USD Million) & Volume (Unit) Analysis By Application, 2021 to 2025
- Current and Future Market Size Value (USD Million) & Volume (Unit) Analysis and Forecast By Application, 2026 to 2036
- Front seat covers
- Rear seat covers
- Door panel inserts
- Console trim
- Front seat covers
- Y-o-Y Growth Trend Analysis By Application, 2021 to 2025
- Absolute $ Opportunity Analysis By Application, 2026 to 2036
- Global Market Analysis and Forecast, By Sales Channel
- Introduction / Key Findings
- Historical Market Size Value (USD Million) & Volume (Unit) Analysis By Sales Channel, 2021 to 2025
- Current and Future Market Size Value (USD Million) & Volume (Unit) Analysis and Forecast By Sales Channel, 2026 to 2036
- Direct OEM programs
- Tier 1 contracts
- Design studio pilots
- Custom aftermarket
- Direct OEM programs
- Y-o-Y Growth Trend Analysis By Sales Channel, 2021 to 2025
- Absolute $ Opportunity Analysis By Sales Channel, 2026 to 2036
- Global Market Analysis and Forecast, By Region, 2021 to 2036
- Introduction
- Historical Market Size Value (USD Million) & Volume (Unit) Analysis By Region, 2021 to 2025
- Current Market Size Value (USD Million) & Volume (Unit) Analysis and Forecast By Region, 2026 to 2036
- North America
- Latin America
- Western Europe
- Eastern Europe
- East Asia
- South Asia and Pacific
- Middle East & Africa
- Market Attractiveness Analysis By Region
- North America Market Analysis and Forecast, By Country, 2021 to 2036
- Historical Market Size Value (USD Million) & Volume (Unit) Trend Analysis By Market Taxonomy, 2021 to 2025
- Market Size Value (USD Million) & Volume (Unit) Forecast By Market Taxonomy, 2026 to 2036
- By Country
- USA
- Canada
- Mexico
- By Product Type
- By Material Type
- By Knitting Structure
- By Vehicle Type
- By Application
- By Sales Channel
- By Country
- Market Attractiveness Analysis
- By Country
- By Product Type
- By Material Type
- By Knitting Structure
- By Vehicle Type
- By Application
- By Sales Channel
- Key Takeaways
- Latin America Market Analysis and Forecast, By Country
- Historical Market Size Value (USD Million) & Volume (Unit) Trend Analysis By Market Taxonomy, 2021 to 2025
- Market Size Value (USD Million) & Volume (Unit) Forecast By Market Taxonomy, 2026 to 2036
- By Country
- Brazil
- Chile
- Rest of Latin America
- By Product Type
- By Material Type
- By Knitting Structure
- By Vehicle Type
- By Application
- By Sales Channel
- By Country
- Market Attractiveness Analysis
- By Country
- By Product Type
- By Material Type
- By Knitting Structure
- By Vehicle Type
- By Application
- By Sales Channel
- Key Takeaways
- Western Europe Market Analysis and Forecast, By Country
- Historical Market Size Value (USD Million) & Volume (Unit) Trend Analysis By Market Taxonomy, 2021 to 2025
- Market Size Value (USD Million) & Volume (Unit) Forecast By Market Taxonomy, 2026 to 2036
- By Country
- Germany
- UK
- Italy
- Spain
- France
- Nordic
- BENELUX
- Rest of Western Europe
- By Product Type
- By Material Type
- By Knitting Structure
- By Vehicle Type
- By Application
- By Sales Channel
- By Country
- Market Attractiveness Analysis
- By Country
- By Product Type
- By Material Type
- By Knitting Structure
- By Vehicle Type
- By Application
- By Sales Channel
- Key Takeaways
- Eastern Europe Market Analysis and Forecast, By Country
- Historical Market Size Value (USD Million) & Volume (Unit) Trend Analysis By Market Taxonomy, 2021 to 2025
- Market Size Value (USD Million) & Volume (Unit) Forecast By Market Taxonomy, 2026 to 2036
- By Country
- Russia
- Poland
- Hungary
- Balkan & Baltic
- Rest of Eastern Europe
- By Product Type
- By Material Type
- By Knitting Structure
- By Vehicle Type
- By Application
- By Sales Channel
- By Country
- Market Attractiveness Analysis
- By Country
- By Product Type
- By Material Type
- By Knitting Structure
- By Vehicle Type
- By Application
- By Sales Channel
- Key Takeaways
- East Asia Market Analysis and Forecast, By Country
- Historical Market Size Value (USD Million) & Volume (Unit) Trend Analysis By Market Taxonomy, 2021 to 2025
- Market Size Value (USD Million) & Volume (Unit) Forecast By Market Taxonomy, 2026 to 2036
- By Country
- China
- Japan
- South Korea
- By Product Type
- By Material Type
- By Knitting Structure
- By Vehicle Type
- By Application
- By Sales Channel
- By Country
- Market Attractiveness Analysis
- By Country
- By Product Type
- By Material Type
- By Knitting Structure
- By Vehicle Type
- By Application
- By Sales Channel
- Key Takeaways
- South Asia and Pacific Market Analysis and Forecast, By Country
- Historical Market Size Value (USD Million) & Volume (Unit) Trend Analysis By Market Taxonomy, 2021 to 2025
- Market Size Value (USD Million) & Volume (Unit) Forecast By Market Taxonomy, 2026 to 2036
- By Country
- India
- ASEAN
- Australia & New Zealand
- Rest of South Asia and Pacific
- By Product Type
- By Material Type
- By Knitting Structure
- By Vehicle Type
- By Application
- By Sales Channel
- By Country
- Market Attractiveness Analysis
- By Country
- By Product Type
- By Material Type
- By Knitting Structure
- By Vehicle Type
- By Application
- By Sales Channel
- Key Takeaways
- Middle East & Africa Market Analysis and Forecast, By Country
- Historical Market Size Value (USD Million) & Volume (Unit) Trend Analysis By Market Taxonomy, 2021 to 2025
- Market Size Value (USD Million) & Volume (Unit) Forecast By Market Taxonomy, 2026 to 2036
- By Country
- Kingdom of Saudi Arabia
- Other GCC Countries
- Türkiye
- South Africa
- Other African Union
- Rest of Middle East & Africa
- By Product Type
- By Material Type
- By Knitting Structure
- By Vehicle Type
- By Application
- By Sales Channel
- By Country
- Market Attractiveness Analysis
- By Country
- By Product Type
- By Material Type
- By Knitting Structure
- By Vehicle Type
- By Application
- By Sales Channel
- Key Takeaways
- Key Countries Market Analysis
- USA
- Pricing Analysis
- Market Share Analysis, 2025
- By Product Type
- By Material Type
- By Knitting Structure
- By Vehicle Type
- By Application
- By Sales Channel
- Canada
- Pricing Analysis
- Market Share Analysis, 2025
- By Product Type
- By Material Type
- By Knitting Structure
- By Vehicle Type
- By Application
- By Sales Channel
- Mexico
- Pricing Analysis
- Market Share Analysis, 2025
- By Product Type
- By Material Type
- By Knitting Structure
- By Vehicle Type
- By Application
- By Sales Channel
- Brazil
- Pricing Analysis
- Market Share Analysis, 2025
- By Product Type
- By Material Type
- By Knitting Structure
- By Vehicle Type
- By Application
- By Sales Channel
- Chile
- Pricing Analysis
- Market Share Analysis, 2025
- By Product Type
- By Material Type
- By Knitting Structure
- By Vehicle Type
- By Application
- By Sales Channel
- Germany
- Pricing Analysis
- Market Share Analysis, 2025
- By Product Type
- By Material Type
- By Knitting Structure
- By Vehicle Type
- By Application
- By Sales Channel
- UK
- Pricing Analysis
- Market Share Analysis, 2025
- By Product Type
- By Material Type
- By Knitting Structure
- By Vehicle Type
- By Application
- By Sales Channel
- Italy
- Pricing Analysis
- Market Share Analysis, 2025
- By Product Type
- By Material Type
- By Knitting Structure
- By Vehicle Type
- By Application
- By Sales Channel
- Spain
- Pricing Analysis
- Market Share Analysis, 2025
- By Product Type
- By Material Type
- By Knitting Structure
- By Vehicle Type
- By Application
- By Sales Channel
- France
- Pricing Analysis
- Market Share Analysis, 2025
- By Product Type
- By Material Type
- By Knitting Structure
- By Vehicle Type
- By Application
- By Sales Channel
- India
- Pricing Analysis
- Market Share Analysis, 2025
- By Product Type
- By Material Type
- By Knitting Structure
- By Vehicle Type
- By Application
- By Sales Channel
- ASEAN
- Pricing Analysis
- Market Share Analysis, 2025
- By Product Type
- By Material Type
- By Knitting Structure
- By Vehicle Type
- By Application
- By Sales Channel
- Australia & New Zealand
- Pricing Analysis
- Market Share Analysis, 2025
- By Product Type
- By Material Type
- By Knitting Structure
- By Vehicle Type
- By Application
- By Sales Channel
- China
- Pricing Analysis
- Market Share Analysis, 2025
- By Product Type
- By Material Type
- By Knitting Structure
- By Vehicle Type
- By Application
- By Sales Channel
- Japan
- Pricing Analysis
- Market Share Analysis, 2025
- By Product Type
- By Material Type
- By Knitting Structure
- By Vehicle Type
- By Application
- By Sales Channel
- South Korea
- Pricing Analysis
- Market Share Analysis, 2025
- By Product Type
- By Material Type
- By Knitting Structure
- By Vehicle Type
- By Application
- By Sales Channel
- Russia
- Pricing Analysis
- Market Share Analysis, 2025
- By Product Type
- By Material Type
- By Knitting Structure
- By Vehicle Type
- By Application
- By Sales Channel
- Poland
- Pricing Analysis
- Market Share Analysis, 2025
- By Product Type
- By Material Type
- By Knitting Structure
- By Vehicle Type
- By Application
- By Sales Channel
- Hungary
- Pricing Analysis
- Market Share Analysis, 2025
- By Product Type
- By Material Type
- By Knitting Structure
- By Vehicle Type
- By Application
- By Sales Channel
- Kingdom of Saudi Arabia
- Pricing Analysis
- Market Share Analysis, 2025
- By Product Type
- By Material Type
- By Knitting Structure
- By Vehicle Type
- By Application
- By Sales Channel
- Türkiye
- Pricing Analysis
- Market Share Analysis, 2025
- By Product Type
- By Material Type
- By Knitting Structure
- By Vehicle Type
- By Application
- By Sales Channel
- South Africa
- Pricing Analysis
- Market Share Analysis, 2025
- By Product Type
- By Material Type
- By Knitting Structure
- By Vehicle Type
- By Application
- By Sales Channel
- USA
- Market Structure Analysis
- Competition Dashboard
- Competition Benchmarking
- Market Share Analysis of Top Players
- By Regional
- By Product Type
- By Material Type
- By Knitting Structure
- By Vehicle Type
- By Application
- By Sales Channel
- Emerging Startups
- Innovation Benchmarking
- Competition Analysis
- Competition Deep Dive
- FORVIA SE
- Overview
- Product Portfolio
- Profitability by Market Segments (Product/Region/Sales Channel)
- Sales Footprint
- Strategy Overview
- Marketing Strategy
- Product Strategy
- Channel Strategy
- Adient plc
- Toyota Boshoku Corporation
- Tesca Group
- Hyundai Transys Inc.
- Sage Automotive Interiors Inc.
- FORVIA SE
- Case Studies
- Success Stories
- Recent Developments
- Competition Deep Dive
- Assumptions & Acronyms Used


