

- Market Size (2026)
- USD 425.0 Mn
- Forecast (2036)
- USD 1589.5 Mn
- CAGR (2026 to 2036)
- 14.1%
How big is the 800VDC Rack Load-Shed Controllers Market in 2026?
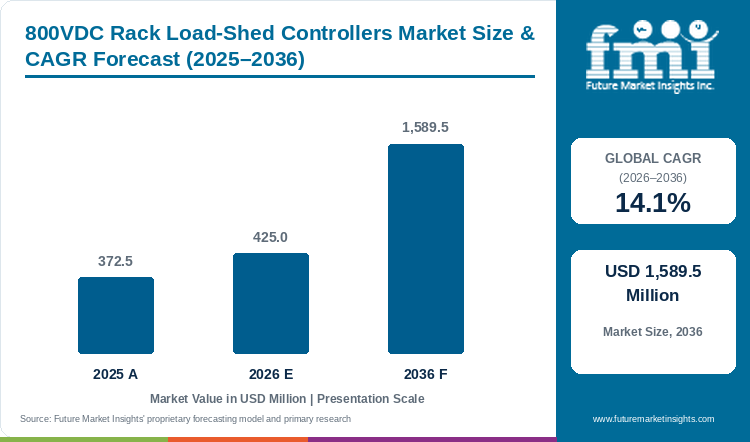
Demand for 800VDC rack load-shed controllers is projected to expand at 14.1% CAGR between 2026 and 2036. Industry value grows from USD 372.5 million in 2025 to USD 425.0 million in 2026 and is projected to reach USD 1,589.5 million by 2036.
Spending on 800VDC rack load-shed controllers reached USD 372.5 Million in 2025 and is estimated at USD 425.0 Million in 2026, as per FMI. Revenue is projected to reach USD 1,589.5 Million by 2036 at a 14.1% CAGR, opening USD 1,164.5 Million of new sales for controller and power-system suppliers. NVIDIA’s May 2025 architecture announcement targets racks of 1 MW and beyond from 2027, showing how much compute can depend on a single rack power chain [1].
As the data center market adds denser AI racks, the cost of losing an entire rack rises with the workload behind it. Operators need a way to curtail selected loads before a power constraint causes a wider interruption. Controller demand will therefore follow electrical design decisions made by power OEMs and campus engineers. Suppliers that make load priorities easy to configure and coordinate with rated protection equipment will have a stronger route into those designs.
Analysts at FMI see integration with the wider power system as the nearest commercial opening. Eaton’s October 2025 reference architecture combines supercapacitor backup, busbar distribution and DC connectors, while Vertiv announced an 800 VDC portfolio scheduled for the second half of 2026 [2] [3]. Controller makers that prove how their logic behaves with those components can enter repeat OEM programs; a standalone specification will carry less weight than a tested rack design.
Key Takeaways
- AI racks are pushing beyond the practical limits of 54 VDC distribution. Load-shed controllers can drop selected loads before protection removes the full rack.
- Rack-integrated assembly is projected to account for 31.0% of product configuration demand in 2026. The controller sits inside the rack power chain instead of requiring a separate cabinet.
- The 750-850 VDC band is estimated to hold 49.0% of nominal DC voltage demand in 2026. It sits around the 800 VDC target being developed for next-generation AI racks.
- Hyperscale AI data centers are expected to hold 51.0% of data center type demand in 2026 because they reach the highest rack densities first.
- Power OEM direct is expected to hold 40.0% of route to market demand in 2026. Controller logic is usually supplied with the wider rack power chain.
- Protection coordination remains a constraint because topology and stored energy change fault behavior across 800 VDC designs.
- Saudi Arabia is projected at 15.3% CAGR through 2036. South Korea follows at 15.0%.
- Key companies profiled include Eaton and Vertiv. Hitachi Energy and Schneider Electric are also covered.
Analyst Perspective
"800 VDC load-shed controllers will matter most where AI racks are dense enough that operators need to remove non-critical load before a hard trip takes down the rack."
- Sudip Saha, Principal Consultant, FMI.
How is the 800VDC Rack Load-Shed Controllers Market segmented?
800VDC rack load-shed controllers market is segmented by product configuration, nominal DC voltage, rack power density, data center type, and route to market.
- By product configuration: Rack-integrated assembly, Standalone device/module, Busway / distribution-integrated, and Prefabricated power cabinet.
- By nominal DC voltage: 750-850 VDC, 600-749 VDC, 851-1,000 VDC, and Above 1,000 VDC.
- By rack power density: 250-500 kW, Below 250 kW, 501-750 kW, and Above 750 kW.
- By data center type: Hyperscale AI data centers, Colocation AI facilities, Enterprise / sovereign AI, and HPC & research centers.
- By route to market: Power OEM direct, Electrical EPC / system integrator, Authorized distributor, and Retrofit / service channel.
- By region: North America, Latin America, Western Europe, Eastern Europe, East Asia, South Asia and Pacific, and Middle East and Africa.
Why does rack-integrated assembly lead the Product Configuration category?
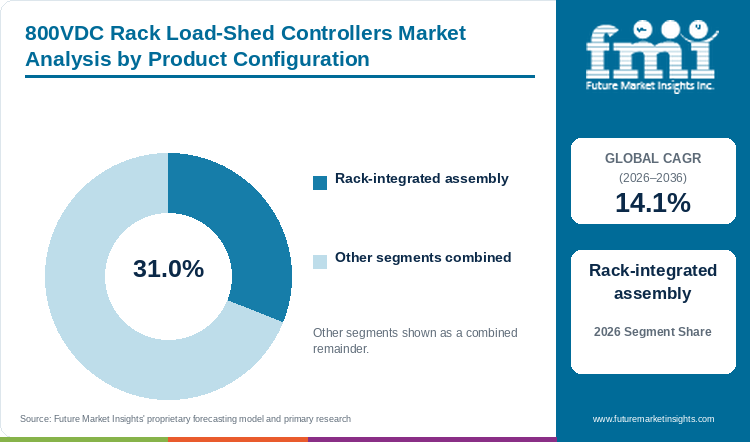
Rack-integrated assembly is projected to account for 31.0% of product configuration demand in 2026, the largest of the four configurations tracked.
Rack-integrated controllers sit inside the rack power chain, so operators do not need a separate control cabinet. NVIDIA's MGX-compatible 800 VDC power rack is due in H2 2026 and is designed for existing AC facilities [4]. Schneider Electric also identifies rack-level power racks and sidecars as an immediate transition path [5]. This makes integration practical for sites adding 800 VDC in stages.
- Rack-integrated assembly holds 31.0% of product configuration demand in 2026.
What supports the 750-850 VDC band as the leading Nominal DC Voltage range?
The 750-850 VDC band is estimated to hold 49.0% of nominal DC voltage demand in 2026, close to half of the category.
The 750-850 VDC band sits directly around the 800 VDC architecture published by NVIDIA. OCP says Google, Microsoft and NVIDIA are working on common 800 VDC interfaces and system requirements [1][6]. A shared voltage target gives equipment makers one range around which to design busways, converters and controller hardware.
- The 750-850 VDC band holds 49.0% of nominal DC voltage demand in 2026 because it is the band NVIDIA, Google, and Microsoft are standardizing around.
Why does the 250-500 kW band lead Rack Power Density?
The 250-500 kW band is forecast to lead rack power density with 36.0% share in 2026.
At 250-500 kW per rack conventional 54 VDC distribution is already under pressure while megawatt-class racks are still emerging. NVIDIA places the practical problem above roughly 200 kW and targets 1 MW racks from 2027 [1]. That makes this band a natural transition range for 800 VDC control hardware.
- The 250-500 kW band holds 36.0% of rack power density demand in 2026 because it falls past the practical ceiling of conventional rack distribution and ahead of the megawatt-class racks still in early deployment.
- Operators at this density gain a clear case for 800 VDC without yet needing the row-level power centers NVIDIA has scheduled for 2027.
Why do Hyperscale AI Data Centers lead the Data Center Type category?
Hyperscale AI data centers are expected to lead data center type with 51.0% share in 2026, more than half of category demand.
Hyperscale AI sites build the largest rack clusters and concentrate the most power in one campus. Berkeley Lab's reference case puts US data center electricity demand at 649 TWh by 2030 [7]. Operators at this scale need critical power and cooling systems that can handle dense racks without turning every power event into a full-rack outage. Load-shed control becomes more valuable as the amount of compute behind each rack rises.
- Hyperscale AI data centers hold 51.0% of data center type demand in 2026 as they are building at the rack densities where 54 VDC distribution runs into physical limits first.
- Colocation and enterprise facilities are expected to adopt 800 VDC later, once reference designs and supply chains are proven at hyperscale.
What supports Power OEM Direct as the leading Route to Market?
Power OEM direct is expected to lead route to market with 40.0% share in 2026.
Power OEMs can sell load-shed logic with the rectifier and busway instead of as a separate controller. Rack converters can sit in the same portfolio. Vertiv's H2 2026 800 VDC portfolio covers centralized rectifiers and DC busways plus rack DC-DC converters with compatible backup [3]. Eaton's reference architecture adds supercapacitor backup and DC connectors [2]. This gives an operator one route for the wider power chain including the power distribution unit and controller logic.
- Power OEM direct holds 40.0% of route to market demand in 2026.
What are the drivers, restraints, and opportunities in the 800VDC Rack Load-Shed Controllers Market?
Higher AI rack power increases the value of deliberate load shedding. Protection coordination and unsettled interoperability slow adoption. Sidecar and retrofit designs let operators add 800 VDC without rebuilding the whole facility.
- AI rack power is reducing the headroom in conventional 54 VDC distribution. A load-shed controller can remove lower-priority load before protection trips the full rack.
- Dense 800 VDC systems need protection settings that match topology and stored energy. Different designs still require separate commissioning work.
- Sidecar power racks and OEM-integrated controls give existing AC facilities a staged path to 800 VDC.
Rising AI Rack Power Drives Controller Demand
Conventional 54 VDC distribution starts to run into physical limits above roughly 200 kW. NVIDIA's 800 VDC architecture is designed for 1 MW racks and beyond from 2027 [1]. Higher voltage lowers current for the same delivered power. That reduces conductor size and resistive loss. A load-shed controller adds another layer to the power management system by dropping selected load before a hard trip removes the whole rack.
Protection Coordination Limits Faster Adoption
Protection settings cannot be copied from one 800 VDC design to another. Schneider Electric found that arc-flash results change with topology, capacitor placement and fault-clearing behavior [8]. OCP is working on common 800 VDC interfaces with Google, Microsoft and NVIDIA [6]. Until those designs converge commissioning teams will still need to set protection around the architecture in front of them.
Sidecar and Retrofit Paths Open the Market Without a Rebuild
Existing AC facilities do not have to convert the whole building at once. NVIDIA's MGX-compatible 800 VDC power rack is designed to work inside existing AC sites and is due in H2 2026 [4]. Schneider Electric identifies the same sidecar approach as an immediate transition path [5]. Operators can therefore add higher-density rows while leaving the upstream facility largely unchanged.
Which country CAGRs are profiled in the 800VDC Rack Load-Shed Controllers Market?
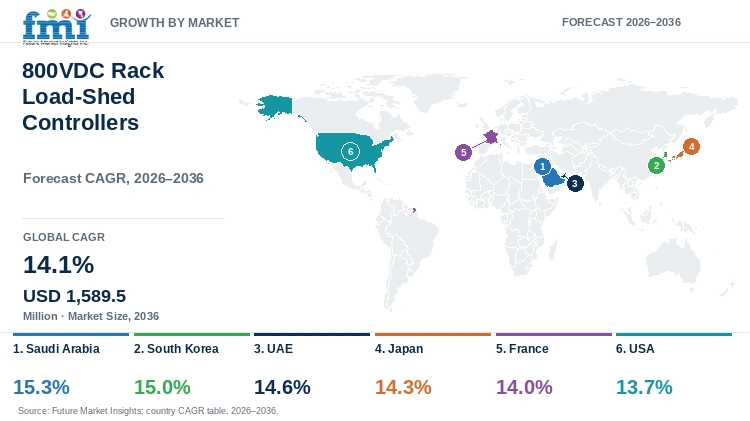
| Country | CAGR |
|---|---|
| Saudi Arabia | 15.3% |
| South Korea | 15.0% |
| UAE | 14.6% |
| Japan | 14.3% |
| France | 14.0% |
| USA | 13.7% |
How do country-level CAGRs compare in the 800VDC Rack Load-Shed Controllers Market?
The six country outlooks differ mainly in the scale and timing of new AI data center construction. New campuses can adopt 800 VDC during initial electrical design. Mature markets have a larger installed base built around older rack power architectures.
Country-wise Analysis
- Saudi Arabia offers the quickest expansion in the profiled group, at a 15.3% CAGR through 2036, and large campus projects will set the buying cycle. The center3-HUMAIN venture announced in December 2025 targets infrastructure supporting up to 1 GW of AI workloads [9]. Suppliers working with electrical designers before equipment selection can place load-shed logic inside the initial rack power design and reduce the integration work required at commissioning.
- GPU procurement is bringing rack-power decisions forward in South Korea, where the market is forecast to grow at a 15.0% CAGR through 2036. MSIT’s February 2025 plan covered 18,000 high-performance GPUs alongside measures for data-center siting and electricity supply [10]. Power OEM partnerships offer controller suppliers a practical entry route, because the operator needs compatible switching and protection before installing dense AI systems.
- The UAE can specify high-voltage distribution while new campuses are still being designed, supporting a 14.6% CAGR through 2036. The May 2025 Stargate UAE announcement described a 1 GW cluster within a planned 5 GW campus, with an initial 200 MW expected in 2026 [11]. Suppliers will compete on their ability to support staged commissioning and coordinate selected load reductions across expanding halls.
- Power availability will influence where Japan’s next AI racks are installed, and controller revenue is forecast to expand at a 14.3% CAGR through 2036. METI’s June 2025 Energy White Paper links electricity and digital-infrastructure planning through watt-bit coordination [12]. Equipment makers that work with local engineering partners can align rack-control specifications with the site’s power envelope before the project moves into procurement.
- France’s new grid-connected capacity creates room to design denser racks from the outset, supporting a 14.0% CAGR through 2036. RTE’s review of 2025 records almost 1 TWh of data-center consumption on its transmission network and 770 MW of connection capacity at year end [13]. Load-shed suppliers will gain most from projects that define load priorities during electrical design, when controls can be coordinated with the wider protection scheme.
- The USA combines large new AI builds with an extensive installed base, and sales will rise at a 13.7% CAGR through 2036. Berkeley Lab’s June 2026 update puts reference-case data-center electricity use at 649 TWh in 2030 [7]. New high-density halls and selected upgrades offer the clearest entry points; OEM-compatible controllers that fit staged power-system changes can reach operators without requiring a facility-wide conversion.
Who are the notable companies in the 800VDC Rack Load-Shed Controllers Market?
Eaton and Vertiv are profiled in this market. Hitachi Energy and Schneider Electric are also included.
Eaton and Vertiv are developing rack-side 800 VDC architectures alongside Schneider Electric. Hitachi Energy enters from the grid and power-electronics side. Eaton's October 2025 design combines supercapacitor backup with busbar distribution and DC connectors [2]. Vertiv's portfolio adds centralized rectifiers with DC busways and rack DC-DC converters [3]. Hitachi Energy is working on grid-to-rack engineering [14]. Schneider Electric has published both a rack-level transition paper and an arc-flash study [5][8]. Their work also overlaps with the wider industrial power supply market around conversion and DC distribution.
Competitive Benchmarking: 800VDC Rack Load-Shed Controllers Market
| Company | 800 VDC Platform Readiness | Rack Control / Protection Integration | Grid-Facing Integration | Geographic Reach |
|---|---|---|---|---|
| Eaton | High | Medium | High | North America, Europe, Middle East, Asia-Pacific |
| Vertiv | High | Medium | Medium | North America, Europe, Middle East, Asia-Pacific |
| Hitachi Energy | High | Low | High | Global grid/data-center presence |
| Schneider Electric | High | High | High | North America, Europe, Middle East, Asia-Pacific |
High indicates wider capability across the named function. Medium indicates narrower capability. Low indicates limited capability in the profiled material. These ratings do not indicate product quality or market share.
Key Developments in the 800VDC Rack Load-Shed Controllers Market
- In May 2025, Vertiv announced an 800 VDC power portfolio scheduled for H2 2026. It includes centralized rectifiers, DC busways and rack DC-DC converters with compatible backup [3].
- In October 2025, Eaton introduced an 800 VDC reference architecture with supercapacitor backup. The design also includes busbar distribution and DC connectors [2].
- In October 2025, Hitachi Energy announced support for NVIDIA's 800 VDC architecture through grid-to-rack engineering and power electronics [14].
- In March 2026, Schneider Electric published White Paper 213. It identifies rack-level 800 VDC power racks and sidecars as an immediate transition path for existing AC facilities [5].
- In August 2026, Schneider Electric published an arc-flash study covering two representative 800 VDC architectures. The results show that topology, capacitor placement and fault-clearing behavior change the outcome [8].
Key Players in the 800VDC Rack Load-Shed Controllers Market
- Eaton
- Vertiv
- Hitachi Energy
- Schneider Electric
800VDC Rack Load-Shed Controllers Market - Report Scope
| Coverage field | Report scope |
|---|---|
| Market breakdown | Product Configuration; Nominal DC Voltage; Rack Power Density; Data Center Type; Route to Market |
| Quantitative Units | USD Million |
| Market Definition | Revenue includes 800 VDC-capable rack load-shed controller hardware and integrated control assemblies, where load shedding is defined as the deliberate removal or curtailment of selected loads to manage a power constraint, coordinated by controller logic. Fault interruption and protection are treated as a distinct function: a controller can command or coordinate switching, but physical interruption depends on the rated protection and switching equipment. Excludes downstream compute, generic switching hardware without load-shed logic, UPS and storage revenue, cooling systems, and adjacent power products without the controller function. |
| Regions Covered | North America; Latin America; Western Europe; Eastern Europe; East Asia; South Asia and Pacific; Middle East and Africa |
| Countries Covered | USA; Saudi Arabia; UAE; South Korea; France; Japan, and more than twenty additional countries in the full report |
| Key Companies Profiled | Eaton; Vertiv; Hitachi Energy; Schneider Electric |
| Forecast Period | 2026 to 2036 |
800VDC Rack Load-Shed Controllers Market - Research Methodology
| Method | Approach |
|---|---|
| Primary Research | FMI interviews power OEMs, electrical EPCs and system integrators. Data center operators are also consulted. Discussions cover controller configuration, voltage range, deployment timing, protection coordination and route to market. |
| Desk Research | FMI reviews first-party technical papers, reference architectures and product releases. It also uses standardization work plus national grid and data center announcements. Dated supplier releases help track architecture changes and commercial activity. |
| Market Sizing and Forecasting | Market sizing combines supplier activity with rack density trends and 800 VDC standardization. Country forecasts also consider AI data center construction and route-to-market conditions. |
| Data Validation | FMI cross-checks findings across source types and keeps the defined revenue boundary consistent. Downstream compute, generic switching hardware, UPS and storage, cooling equipment and adjacent power products are excluded. |
800VDC Rack Load-Shed Controllers Market by Segments
800VDC Rack Load-Shed Controllers Market Segmented by Product Configuration:
- Rack-integrated assembly
- Standalone device/module
- Busway / distribution-integrated
- Prefabricated power cabinet
800VDC Rack Load-Shed Controllers Market Segmented by Nominal DC Voltage:
- 750-850 VDC
- 600-749 VDC
- 851-1,000 VDC
- Above 1,000 VDC
800VDC Rack Load-Shed Controllers Market Segmented by Rack Power Density:
- 250-500 kW
- Below 250 kW
- 501-750 kW
- Above 750 kW
800VDC Rack Load-Shed Controllers Market Segmented by Data Center Type:
- Hyperscale AI data centers
- Colocation AI facilities
- Enterprise / sovereign AI
- HPC & research centers
800VDC Rack Load-Shed Controllers Market Segmented by Route to Market:
- Power OEM direct
- Electrical EPC / system integrator
- Authorized distributor
- Retrofit / service channel
800VDC Rack Load-Shed Controllers Market by Region:
- North America
- United States
- Canada
- Latin America
- Brazil
- Mexico
- Argentina
- Chile
- Western Europe
- Germany
- France
- United Kingdom
- Italy
- Spain
- Benelux
- Nordics
- Eastern Europe
- Poland
- Czech Republic
- Romania
- Hungary
- East Asia
- China
- Japan
- South Korea
- South Asia and Pacific
- India
- ASEAN
- Australia and New Zealand
- Middle East and Africa
- GCC Countries
- South Africa
- Türkiye
- Israel
Research Sources and Bibliography
- [1] NVIDIA. (2025, May 20). NVIDIA 800 V HVDC architecture will power the next generation of AI factories.
- [2] Eaton. (2025, October 13). Eaton unveils next-generation architecture.
- [3] Vertiv. (2025, May 19). Vertiv accelerates AI infrastructure evolution in alignment with NVIDIA 800 VDC power architecture announcement.
- [4] NVIDIA. (2026, August 11). 800 VDC power architecture for the AI factory.
- [5] Schneider Electric. (2026, March 2). White Paper 213: 800 VDC power racks and sidecars as a transition path.
- [6] Open Compute Project. 11 August 2026. Powering the next era of AI: how Google, Microsoft and NVIDIA are standardizing and accelerating the industry transition to LVDC.
- [7] Berkeley Lab. (2026, June). United States data center energy usage report.
- [8] Schneider Electric. (2026, August 3). Schneider Electric releases study assessing arc-flash risk in 800 VDC data centers.
- [9] Saudi Press Agency. (2025, December 18). stc/center3 and HUMAIN joint venture announcement.
- [10] Ministry of Science and ICT, Republic of Korea. (2025, February 20). GPU and data center power-supply framework plan.
- [11] Abu Dhabi Media Office. (2025, May 22). Global tech alliance launches Stargate UAE.
- [12] Ministry of Economy Trade and Industry (Japan). 13 June 2025. Energy White Paper: watt-bit coordination.
- [13] RTE. 15 April 2026. Annual electricity review 2025, full report (pp. 18-19).
- [14] Hitachi Energy. (2025, October 13). Hitachi Energy and NVIDIA collaboration on 800 VDC architecture.
This bibliography is provided for reader reference. The full report contains the complete reference list and detailed citations.
This Report Answers
- What is the 800VDC Rack Load-Shed Controllers Market worth during 2026?
- What value is the market projected to reach by 2036?
- Which product configuration holds notable market share in 2026?
- Which nominal DC voltage band holds notable market share in 2026?
- Which data center type holds notable market share in 2026?
- Which countries have notable market growth?
- Which companies are notable in this market today?
Frequently Asked Questions
How large is the 800VDC Rack Load-Shed Controllers Market expected to be in 2026?
FMI values the 800VDC rack load-shed controllers market at USD 425.0 million in 2026. It is forecast to reach USD 1,589.5 million by 2036 as AI racks move toward higher-voltage DC distribution.
What CAGR is forecast for the 800VDC Rack Load-Shed Controllers Market through 2036?
FMI projects a 14.1% CAGR from 2026 to 2036. Higher rack power and the move toward common 800 VDC interfaces support the forecast.
Which product configuration holds a notable share in 2026?
Rack-integrated assembly is projected to account for 31.0% of product configuration demand in 2026. The controller sits inside the rack power chain instead of requiring a separate enclosure.
Which nominal DC voltage band holds a notable share in 2026?
The 750-850 VDC band is estimated to hold 49.0% of nominal DC voltage demand in 2026. It is the range closest to the 800 VDC architecture being developed for next-generation AI racks.
Which country has a notable expansion outlook during the forecast period?
Saudi Arabia is projected at 15.3% CAGR from 2026 to 2036. That is the highest rate in the country table.
Which companies are active in the 800VDC Rack Load-Shed Controllers Market during 2026?
The profiled companies are Eaton and Vertiv. Hitachi Energy and Schneider Electric are also covered. Their current work spans 800 VDC reference designs, rack-side power integration and grid-to-rack engineering.
Preview the report firsthand - request a free sample
Get SampleGet the brochure for pricing and purchase details.
Get PDFTable of Content
- Key Takeaways
- Market Size and CAGR
- Top Growth Driver
- Fastest Growing Segment
- Leading Region
- Key Companies
- Emerging Opportunities
- Executive Summary
- Global Market Outlook
- Demand-side Trends
- Supply-side Trends
- Technology Roadmap Analysis
- Analysis and Recommendations
- Analyst Perspective (What is happening? Why now? What should investors know?)
- Key Questions Answered
- How large is the market?
- What is the CAGR?
- What are key trends?
- Which region dominates?
- Who are the leaders?
- Market Overview
- Market Coverage / Taxonomy
- Market Definition / Scope / Limitations
- Research Methodology
- Chapter Orientation
- Analytical Lens and Working Hypotheses
- Market Structure, Signals, and Trend Drivers
- Benchmarking and Cross-market Comparability
- Market Sizing, Forecasting, and Opportunity Mapping
- Research Design and Evidence Framework
- Desk Research Programme (Secondary Evidence)
- Expert Input and Fieldwork (Primary Evidence)
- Tooling, Models, and Reference Databases
- Data Engineering and Model Build
- Quality Assurance and Audit Trail
- Market Background
- Market Dynamics (Drivers, Restraints, Opportunity, Trends)
- Scenario Forecast (Optimistic, Likely, Conservative)
- Impact Analysis
- AI Impact
- Sustainability Impact
- Regulatory Impact
- Technology Impact
- Consumer / Buyer Analysis
- Purchase Drivers
- Adoption Barriers
- Buyer Journey
- Opportunity Map Analysis
- Product Life Cycle Analysis
- Supply Chain Analysis
- Investment Feasibility Matrix
- Value Chain Analysis
- PESTLE and Porter's Analysis
- Regulatory Landscape
- Regional Parent Market Outlook
- Production and Consumption Statistics
- Import and Export Statistics
- Global Market Analysis and Forecast, 2021 to 2036
- Historical Market Size Value (USD Million) Analysis, 2021 to 2025
- Current and Future Market Size Value (USD Million) Projections, 2026 to 2036
- Y-o-Y Growth Trend Analysis
- Absolute $ Opportunity Analysis
- Global Market Pricing Analysis, 2021 to 2036
- Global Market Analysis and Forecast, By Product Configuration, 2021 to 2036
- Introduction / Key Findings
- Historical Market Size Value (USD Million) Analysis By Product Configuration, 2021 to 2025
- Current and Future Market Size Value (USD Million) Analysis and Forecast By Product Configuration, 2026 to 2036
- Rack-integrated assembly
- Standalone device/module
- Busway / distribution-integrated
- Prefabricated power cabinet
- Y-o-Y Growth Trend Analysis By Product Configuration, 2021 to 2025
- Absolute $ Opportunity Analysis By Product Configuration, 2026 to 2036
- Global Market Analysis and Forecast, By Nominal DC Voltage, 2021 to 2036
- Introduction / Key Findings
- Historical Market Size Value (USD Million) Analysis By Nominal DC Voltage, 2021 to 2025
- Current and Future Market Size Value (USD Million) Analysis and Forecast By Nominal DC Voltage, 2026 to 2036
- 750-850 VDC
- 600-749 VDC
- 851-1,000 VDC
- Above 1,000 VDC
- Y-o-Y Growth Trend Analysis By Nominal DC Voltage, 2021 to 2025
- Absolute $ Opportunity Analysis By Nominal DC Voltage, 2026 to 2036
- Global Market Analysis and Forecast, By Rack Power Density, 2021 to 2036
- Introduction / Key Findings
- Historical Market Size Value (USD Million) Analysis By Rack Power Density, 2021 to 2025
- Current and Future Market Size Value (USD Million) Analysis and Forecast By Rack Power Density, 2026 to 2036
- 250-500 kW
- Below 250 kW
- 501-750 kW
- Above 750 kW
- Y-o-Y Growth Trend Analysis By Rack Power Density, 2021 to 2025
- Absolute $ Opportunity Analysis By Rack Power Density, 2026 to 2036
- Global Market Analysis and Forecast, By Data Center Type, 2021 to 2036
- Introduction / Key Findings
- Historical Market Size Value (USD Million) Analysis By Data Center Type, 2021 to 2025
- Current and Future Market Size Value (USD Million) Analysis and Forecast By Data Center Type, 2026 to 2036
- Hyperscale AI data centers
- Colocation AI facilities
- Enterprise / sovereign AI
- HPC & research centers
- Y-o-Y Growth Trend Analysis By Data Center Type, 2021 to 2025
- Absolute $ Opportunity Analysis By Data Center Type, 2026 to 2036
- Global Market Analysis and Forecast, By Route to Market, 2021 to 2036
- Introduction / Key Findings
- Historical Market Size Value (USD Million) Analysis By Route to Market, 2021 to 2025
- Current and Future Market Size Value (USD Million) Analysis and Forecast By Route to Market, 2026 to 2036
- Power OEM direct
- Electrical EPC / system integrator
- Authorized distributor
- Retrofit / service channel
- Y-o-Y Growth Trend Analysis By Route to Market, 2021 to 2025
- Absolute $ Opportunity Analysis By Route to Market, 2026 to 2036
- Global Market Analysis and Forecast, By Region, 2021 to 2036
- Introduction
- Historical Market Size Value (USD Million) Analysis By Region, 2021 to 2025
- Current Market Size Value (USD Million) Analysis and Forecast By Region, 2026 to 2036
- North America
- Latin America
- Western Europe
- Eastern Europe
- East Asia
- South Asia and Pacific
- Middle East and Africa
- Market Attractiveness Analysis By Region
- North America Market Analysis and Forecast, By Country, 2021 to 2036
- Historical Market Size Value (USD Million) Trend Analysis By Market Taxonomy, 2021 to 2025
- Market Size Value (USD Million) Forecast By Market Taxonomy, 2026 to 2036
- By Country
- United States
- Canada
- By Product Configuration
- By Nominal DC Voltage
- By Rack Power Density
- By Data Center Type
- By Route to Market
- By Country
- Market Attractiveness Analysis
- By Country
- By Product Configuration
- By Nominal DC Voltage
- By Rack Power Density
- By Data Center Type
- By Route to Market
- Key Takeaways
- Latin America Market Analysis and Forecast, By Country
- Historical Market Size Value (USD Million) Trend Analysis By Market Taxonomy, 2021 to 2025
- Market Size Value (USD Million) Forecast By Market Taxonomy, 2026 to 2036
- By Country
- Brazil
- Mexico
- Argentina
- Chile
- By Product Configuration
- By Nominal DC Voltage
- By Rack Power Density
- By Data Center Type
- By Route to Market
- By Country
- Market Attractiveness Analysis
- By Country
- By Product Configuration
- By Nominal DC Voltage
- By Rack Power Density
- By Data Center Type
- By Route to Market
- Key Takeaways
- Western Europe Market Analysis and Forecast, By Country
- Historical Market Size Value (USD Million) Trend Analysis By Market Taxonomy, 2021 to 2025
- Market Size Value (USD Million) Forecast By Market Taxonomy, 2026 to 2036
- By Country
- Germany
- France
- United Kingdom
- Italy
- Spain
- Benelux
- Nordics
- By Product Configuration
- By Nominal DC Voltage
- By Rack Power Density
- By Data Center Type
- By Route to Market
- By Country
- Market Attractiveness Analysis
- By Country
- By Product Configuration
- By Nominal DC Voltage
- By Rack Power Density
- By Data Center Type
- By Route to Market
- Key Takeaways
- Eastern Europe Market Analysis and Forecast, By Country
- Historical Market Size Value (USD Million) Trend Analysis By Market Taxonomy, 2021 to 2025
- Market Size Value (USD Million) Forecast By Market Taxonomy, 2026 to 2036
- By Country
- Poland
- Czech Republic
- Romania
- Hungary
- By Product Configuration
- By Nominal DC Voltage
- By Rack Power Density
- By Data Center Type
- By Route to Market
- By Country
- Market Attractiveness Analysis
- By Country
- By Product Configuration
- By Nominal DC Voltage
- By Rack Power Density
- By Data Center Type
- By Route to Market
- Key Takeaways
- East Asia Market Analysis and Forecast, By Country
- Historical Market Size Value (USD Million) Trend Analysis By Market Taxonomy, 2021 to 2025
- Market Size Value (USD Million) Forecast By Market Taxonomy, 2026 to 2036
- By Country
- China
- Japan
- South Korea
- By Product Configuration
- By Nominal DC Voltage
- By Rack Power Density
- By Data Center Type
- By Route to Market
- By Country
- Market Attractiveness Analysis
- By Country
- By Product Configuration
- By Nominal DC Voltage
- By Rack Power Density
- By Data Center Type
- By Route to Market
- Key Takeaways
- South Asia and Pacific Market Analysis and Forecast, By Country
- Historical Market Size Value (USD Million) Trend Analysis By Market Taxonomy, 2021 to 2025
- Market Size Value (USD Million) Forecast By Market Taxonomy, 2026 to 2036
- By Country
- India
- ASEAN
- Australia and New Zealand
- By Product Configuration
- By Nominal DC Voltage
- By Rack Power Density
- By Data Center Type
- By Route to Market
- By Country
- Market Attractiveness Analysis
- By Country
- By Product Configuration
- By Nominal DC Voltage
- By Rack Power Density
- By Data Center Type
- By Route to Market
- Key Takeaways
- Middle East and Africa Market Analysis and Forecast, By Country
- Historical Market Size Value (USD Million) Trend Analysis By Market Taxonomy, 2021 to 2025
- Market Size Value (USD Million) Forecast By Market Taxonomy, 2026 to 2036
- By Country
- GCC Countries
- South Africa
- Türkiye
- Israel
- By Product Configuration
- By Nominal DC Voltage
- By Rack Power Density
- By Data Center Type
- By Route to Market
- By Country
- Market Attractiveness Analysis
- By Country
- By Product Configuration
- By Nominal DC Voltage
- By Rack Power Density
- By Data Center Type
- By Route to Market
- Key Takeaways
- Key Countries Market Analysis
- United States
- Pricing Analysis
- Market Share Analysis, 2025
- By Product Configuration
- By Nominal DC Voltage
- By Rack Power Density
- By Data Center Type
- By Route to Market
- Canada
- Pricing Analysis
- Market Share Analysis, 2025
- By Product Configuration
- By Nominal DC Voltage
- By Rack Power Density
- By Data Center Type
- By Route to Market
- Mexico
- Pricing Analysis
- Market Share Analysis, 2025
- By Product Configuration
- By Nominal DC Voltage
- By Rack Power Density
- By Data Center Type
- By Route to Market
- Brazil
- Pricing Analysis
- Market Share Analysis, 2025
- By Product Configuration
- By Nominal DC Voltage
- By Rack Power Density
- By Data Center Type
- By Route to Market
- Chile
- Pricing Analysis
- Market Share Analysis, 2025
- By Product Configuration
- By Nominal DC Voltage
- By Rack Power Density
- By Data Center Type
- By Route to Market
- Germany
- Pricing Analysis
- Market Share Analysis, 2025
- By Product Configuration
- By Nominal DC Voltage
- By Rack Power Density
- By Data Center Type
- By Route to Market
- United Kingdom
- Pricing Analysis
- Market Share Analysis, 2025
- By Product Configuration
- By Nominal DC Voltage
- By Rack Power Density
- By Data Center Type
- By Route to Market
- Italy
- Pricing Analysis
- Market Share Analysis, 2025
- By Product Configuration
- By Nominal DC Voltage
- By Rack Power Density
- By Data Center Type
- By Route to Market
- Spain
- Pricing Analysis
- Market Share Analysis, 2025
- By Product Configuration
- By Nominal DC Voltage
- By Rack Power Density
- By Data Center Type
- By Route to Market
- France
- Pricing Analysis
- Market Share Analysis, 2025
- By Product Configuration
- By Nominal DC Voltage
- By Rack Power Density
- By Data Center Type
- By Route to Market
- India
- Pricing Analysis
- Market Share Analysis, 2025
- By Product Configuration
- By Nominal DC Voltage
- By Rack Power Density
- By Data Center Type
- By Route to Market
- ASEAN
- Pricing Analysis
- Market Share Analysis, 2025
- By Product Configuration
- By Nominal DC Voltage
- By Rack Power Density
- By Data Center Type
- By Route to Market
- Australia and New Zealand
- Pricing Analysis
- Market Share Analysis, 2025
- By Product Configuration
- By Nominal DC Voltage
- By Rack Power Density
- By Data Center Type
- By Route to Market
- China
- Pricing Analysis
- Market Share Analysis, 2025
- By Product Configuration
- By Nominal DC Voltage
- By Rack Power Density
- By Data Center Type
- By Route to Market
- Japan
- Pricing Analysis
- Market Share Analysis, 2025
- By Product Configuration
- By Nominal DC Voltage
- By Rack Power Density
- By Data Center Type
- By Route to Market
- South Korea
- Pricing Analysis
- Market Share Analysis, 2025
- By Product Configuration
- By Nominal DC Voltage
- By Rack Power Density
- By Data Center Type
- By Route to Market
- Poland
- Pricing Analysis
- Market Share Analysis, 2025
- By Product Configuration
- By Nominal DC Voltage
- By Rack Power Density
- By Data Center Type
- By Route to Market
- Hungary
- Pricing Analysis
- Market Share Analysis, 2025
- By Product Configuration
- By Nominal DC Voltage
- By Rack Power Density
- By Data Center Type
- By Route to Market
- Türkiye
- Pricing Analysis
- Market Share Analysis, 2025
- By Product Configuration
- By Nominal DC Voltage
- By Rack Power Density
- By Data Center Type
- By Route to Market
- South Africa
- Pricing Analysis
- Market Share Analysis, 2025
- By Product Configuration
- By Nominal DC Voltage
- By Rack Power Density
- By Data Center Type
- By Route to Market
- Saudi Arabia
- Pricing Analysis
- Market Share Analysis, 2025
- By Product Configuration
- By Nominal DC Voltage
- By Rack Power Density
- By Data Center Type
- By Route to Market
- UAE
- Pricing Analysis
- Market Share Analysis, 2025
- By Product Configuration
- By Nominal DC Voltage
- By Rack Power Density
- By Data Center Type
- By Route to Market
- United States
- Market Structure Analysis
- Competition Dashboard
- Competition Benchmarking
- Market Share Analysis of Top Players
- By Regional
- By Product Configuration
- By Nominal DC Voltage
- By Rack Power Density
- By Data Center Type
- By Route to Market
- Emerging Startups
- Innovation Benchmarking
- Competition Analysis
- Competition Deep Dive
- Eaton
- Overview
- Product Portfolio
- Profitability by Market Segments
- Sales Footprint
- Strategy Overview
- Marketing Strategy
- Product Strategy
- Channel Strategy
- Vertiv
- Hitachi Energy
- Schneider Electric
- Eaton
- Case Studies
- Success Stories
- Recent Developments
- Competition Deep Dive
- Assumptions & Acronyms Used


