

- Market Size (2026)
- USD 418.4 Mn
- Forecast (2036)
- USD 1678.0 Mn
- CAGR (2026 to 2036)
- 14.9%
How Big is the 800VDC Rack Pre-Charge Modules Market in 2026?
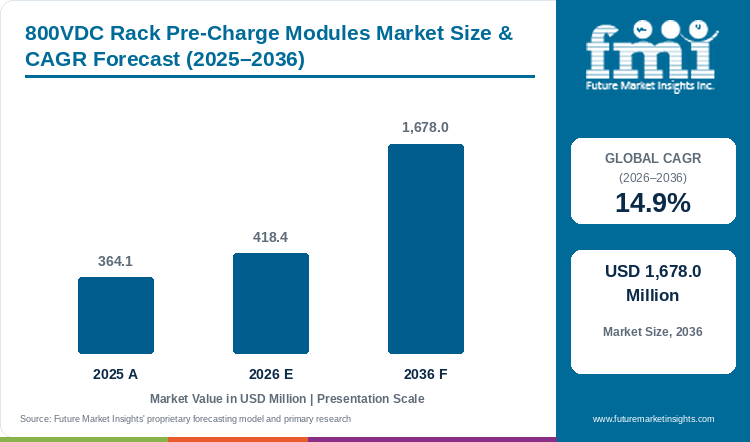
Sales of 800VDC rack pre-charge modules will expand at a 14.9% CAGR between 2026 and 2036. Market value is estimated at USD 418.4 Million in 2026 and will reach USD 1,678.0 Million by 2036.
800VDC rack pre-charge modules market size is estimated at USD 418.4 Million in 2026 and will reach USD 1,678.0 Million by 2036 at a 14.9% CAGR, as per FMI. NVIDIA's May 2025 800 VDC architecture announcement described support for 1 MW IT racks and beyond from 2027 [1]. Raising voltage reduces current and the number of conversion stages. The pre-charge path brings capacitors toward bus voltage before the main connection closes, making controlled startup part of the rack design. Applying the forecast CAGR to the prior year gives an estimated 2025 market value of USD 364.1 Million.
Rack power orders follow the electrical design and construction schedule of each site. France's AI infrastructure investment commitments support new campuses, while the May 2025 Stargate UAE plan described a 1 GW cluster with 200 MW expected online in 2026 [7] [9]. Berkeley Lab's June 2026 reference case for data center energy consumption projects U.S. data centers at 11.8% of national electricity consumption by 2030, within a 9.5%-15.3% scenario range [5]. These plans give suppliers more potential buyers. A module still needs approval for rack startup and DC protection before a project places orders. The data center power distribution market covers the wider equipment pool.
The DC contactors market supplies switching devices used in pre-charge assemblies. A buyer must test the selected device with the rack's actual capacitive load. Its voltage class defines part of the operating range; the startup test shows how the assembled circuit behaves. The controller closes the main path after the DC link reaches its specified voltage. Suppliers that repeat this sequence reliably can retain approvals as rack orders grow.
Key Takeaways
- Rack-integrated assembly will hold 31.0% of product configuration demand in 2026, supported by startup controls tested within the complete rack power system.
- By nominal DC voltage, FMI finds that the 750-850 VDC band will lead at 49.0% in 2026.
- The 250-500 kW band will carry 36.0% of rack power density demand in 2026. Hyperscale AI data centers will hold 51.0% by data center type, and power OEM direct will account for 40.0% by route to market.
- By country, France will grow fastest at 15.8%, and the USA will record the lowest profiled CAGR at 14.1% through 2036.
- Key companies covered by FMI include Sensata Technologies, Littelfuse and Eaton. Their roles span pre-charge switching, DC protection and 800 VDC power architecture.
Analyst Perspective
Revenue conversion will depend less on interest in 800 VDC than on whether module suppliers can pass system-level inrush, fault-interruption and interoperability validation before native-DC deployments scale.
- Sudip Saha, Principal Analyst at Future Market Insights
How is the 800VDC Rack Pre-Charge Modules Market Segmented?
According to FMI, the market is segmented by product configuration, nominal DC voltage, rack power density, data center type, route to market, and region.
Based on product configuration, the study covers rack-integrated assembly, standalone device/module, busway / distribution-integrated, and prefabricated power cabinet. Nominal DC voltage includes 750-850 VDC, 600-749 VDC, 851-1,000 VDC, and above 1,000 VDC. By rack power density, the market covers 250-500 kW, below 250 kW, 501-750 kW, and above 750 kW.
Data center types include hyperscale AI data centers, colocation AI facilities, enterprise / sovereign AI, and HPC & research centers. Routes to market cover power OEM direct, electrical EPC / system integrator, authorized distributor, and retrofit / service channel. The report tracks demand across seven regions.
Why Does Rack-Integrated Assembly Lead the Market by Product Configuration?
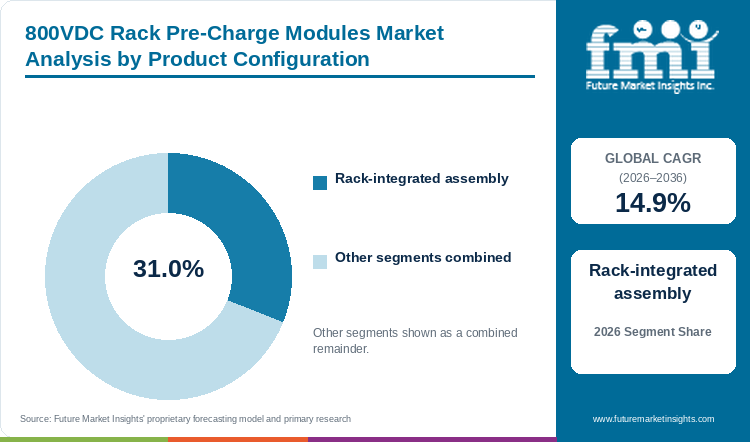
FMI finds that rack-integrated assembly will account for 31.0% of product configuration demand in 2026.
Placing the controller and DC-link monitor inside the rack shortens their connection and reduces field wiring. Installers have fewer interfaces to inspect, and buyers can test the startup sequence with the assembled power path. The controller checks capacitor voltage before closing the main connection. This arrangement will keep rack-integrated assembly ahead of other product configurations as open LVDC practices develop, according to FMI.
- Rack-integrated assembly will hold 31.0% of product configuration demand in 2026, owing to fewer field wiring interfaces and qualification within the rack.
- In August 2026, NVIDIA described an MGX-compatible 800 VDC power rack for existing AC facilities, allowing operators to qualify startup controls within an assembled row-level power system [2].
Why Does 750-850 VDC Lead the Market by Nominal DC Voltage?
The 750-850 VDC band will hold 49.0% of nominal DC voltage demand in 2026, as per FMI.
Designs around a nominal 800 VDC bus fall within the 750-850 VDC band. OCP's March 2026 LVDC paper discusses 840 VDC as an interoperability point and compatibility around 700/800 V device classes [3]. Higher voltage reduces the current needed for a given rack power. Buyers selecting high-voltage switching devices must then check make and break ratings for the intended circuit. Component approval requires both a suitable voltage class and tested switching behavior.
- 750-850 VDC will lead nominal DC voltage demand with a 49.0% share in 2026, supported by emerging 800 VDC designs.
- In August 2026, Google, Microsoft and NVIDIA described a common 800 VDC direction through OCP, giving suppliers shared requirements for connectors, protection and monitoring [4].
Why Does 250-500 kW Lead the Market by Rack Power Density?
FMI finds that 250-500 kW will account for 36.0% of rack power density demand in 2026.
Delivering power at low voltage raises current and copper requirements for racks in the 250-500 kW band. In May 2025, NVIDIA described traditional 54 V in-rack delivery as unsuitable for future megawatt-class racks [1]. The leading band captures an earlier part of this transition. Increasing DC-link capacitance also raises the energy handled during startup, so these racks need a controlled pre-charge path before projects reach 1 MW.
- 250-500 kW will hold 36.0% of rack power density demand in 2026, as operators move beyond conventional low-voltage delivery.
- NVIDIA's May 2025 architecture described scaling from roughly 100 kW to beyond 1 MW, covering transitional rack densities as well as later megawatt designs [1].
Why Do Hyperscale AI Data Centers Lead the Market by Data Center Type?
Hyperscale AI data centers will hold 51.0% of data center type demand in 2026.
A hyperscale operator can repeat one approved startup sequence across many racks. Engineering teams qualify the module through the reference design and supplier approval process for the whole power system. Enterprise and research installations use the same electrical function, but their order schedules provide less early volume for a new 800 VDC design. Common fleet specifications and repeated deployments will sustain the hyperscale lead.
- Hyperscale AI data centers will account for 51.0% of data center type demand in 2026, backed by common rack designs across large deployments.
- The May 2025 Stargate UAE plan described a 1 GW AI cluster with 200 MW expected online in 2026 [7]. Successive power blocks can use standard rack interfaces. Module orders will depend on the rack voltage chosen; the announcement leaves that choice unspecified.
Why Does Power OEM Direct Lead the Market by Route to Market?
Power OEM direct will account for 40.0% of route to market demand in 2026, according to FMI.
Power OEMs test a pre-charge module together with converters and rack protection. Excessive inrush can damage connectors or weld contacts, and a failed startup can trip protection. Working directly with the supplier keeps hardware and control revisions within the same approval process. Once tested, the OEM can repeat that power design as production volumes increase.
- Power OEM direct will hold 40.0% of route to market demand in 2026, supported by qualification with conversion equipment and protection.
- In October 2025, Eaton published an architecture combining 800 VDC conversion, distribution and protection, placing rack energization within the wider system design [12].
What are the Drivers, Restraints, and Opportunities in the 800VDC Rack Pre-Charge Modules Market?
As per FMI's analysis, rising AI rack power will drive sales, system qualification can delay orders, and hybrid 800 VDC power racks will open opportunities in existing AC facilities through 2036.
- Driver: Higher rack power pushes operators toward 800 VDC distribution, raising demand for controlled capacitor charging at startup.
- Restraint: Buyers must qualify startup sequencing, hot connection and fault coordination while open 800 VDC practices continue to develop.
- Opportunity: Hybrid power racks let existing AC facilities add rack-side HVDC where site power and row space permit installation.
Higher rack power makes low-voltage conductors more demanding to size and install. NVIDIA's May 2025 plan uses 800 VDC for 1 MW racks and beyond from 2027 [1]. The lower current helps distribution, but connecting capacitors to the bus still creates inrush. OCP's March 2026 paper notes that live connection can damage contacts or operate fuses and breakers [3]. Pre-charge limits the initial current until the main path can close.
Changing a module requires a fresh assessment of the rack circuit. Buyers check insulation and creepage, then test arc behavior, inrush timing and capacitor-discharge peaks against upstream protection. OCP's LVDC work identifies further development in precharging, hot connection and disconnection [3]. Matching the old device's voltage and current ratings is only the first check. Approval of the assembled power path adds engineering time and cost to a supplier change.
An existing AC facility can add a hybrid power rack where available power and row space allow it. NVIDIA's August 2026 MGX-compatible design converts AC to 800 VDC within the row [2]. This offers a route to denser computing while retaining the building's electrical system. Standalone modules and rack-integrated assemblies can provide pre-charge in that rack. Their startup and service-isolation sequences need to work with its contactors and fault devices before installation.
Which Country CAGRs Are Profiled in the 800VDC Rack Pre-Charge Modules Market?
| Country | CAGR, 2026 to 2036 |
|---|---|
| France | 15.8% |
| South Korea | 15.4% |
| UAE | 15.1% |
| Saudi Arabia | 14.8% |
| Japan | 14.5% |
| USA | 14.1% |
How do Country-level CAGRs Compare in the 800VDC Rack Pre-Charge Modules Market?
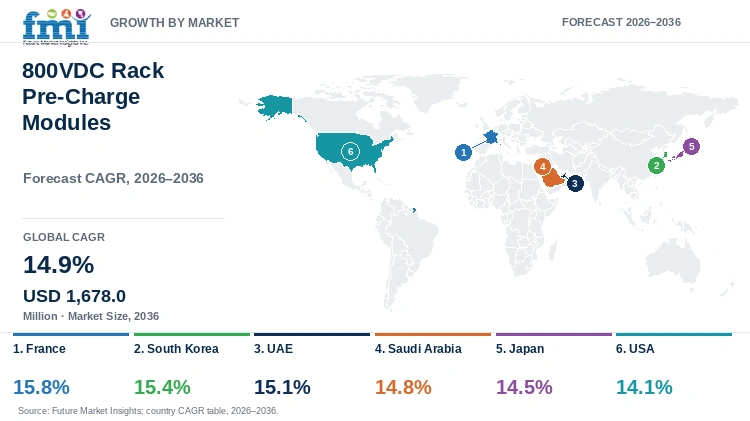
France will grow at 15.8% through 2036, followed by South Korea at 15.4% and the UAE at 15.1%. FMI forecasts 14.8% for Saudi Arabia, 14.5% for Japan and 14.1% for the USA. The gap between France and the USA is 1.7 percentage points. These rates describe growth from different starting revenues. Construction schedules and grid connections determine when a site can open; its selected rack design determines which pre-charge modules the supplier can sell.
- France leads at 15.8%, supported by AI investment commitments and low-carbon electricity.
- South Korea follows at 15.4%, with phased construction at the 100 MW-class Ulsan AI Data Center [8].
- The UAE grows at 15.1%, as Stargate UAE plans an initial 200 MW within a 1 GW cluster [7].
- Saudi Arabia at 14.8% brings AI infrastructure development under the HUMAIN program [6].
- Japan grows at 14.5%, with watt-bit coordination linking power and telecommunications planning [10].
- The USA records 14.1%, the lowest profiled rate, as grid connections and system approval affect project timing.
The full study covers North America, Latin America, Western Europe, Eastern Europe, East Asia, South Asia and Pacific, and the Middle East and Africa. Pre-charge orders depend on the selected rack architecture as well as when facilities receive power.
Country Outlook
- France announced more than EUR 109 billion in AI infrastructure investment around the February 2025 AI Action Summit [9]. Suppliers can approach new campuses while their electrical designs are being chosen. Low-carbon power and prepared sites support this opportunity. FMI forecasts a 15.8% CAGR for rack pre-charge modules in France through 2036, the fastest among the profiled countries. Power OEM and EPC approval will decide which module enters a design, while permitting and grid connections affect the order schedule.
- South Korea's Ulsan AI Data Center gives suppliers a project with several construction phases. In June 2025, the Ministry of Science and ICT described a 100 MW-class development backed by a USD 4 billion AWS investment [8]. Partial operation of 41 MW is scheduled for November 2027, followed by 103 MW by February 2029. A power design approved for the first phase could be repeated later if specifications remain unchanged. FMI forecasts a 15.4% CAGR through 2036. Suppliers need confirmation that the project uses 800 VDC racks and can support local commissioning before treating it as a module order.
- OpenAI's May 2025 Stargate UAE announcement described a 1 GW cluster in Abu Dhabi, with 200 MW expected online in 2026 [7]. Repeating rack and row interfaces would allow operators to reuse an approved power design as capacity expands. Where 800 VDC is selected, the pre-charge module must work with conversion equipment, protection and service-isolation procedures. FMI forecasts a 15.1% CAGR for UAE rack pre-charge modules through 2036.
- HUMAIN's AI infrastructure program provides a route to future data-center projects in Saudi Arabia. PIF launched the company in May 2025 to develop next-generation data centers, AI infrastructure and cloud capabilities [6]. An approved common specification could open several projects to the same module supplier. Integrators need repeatable high-voltage test results, dependable supply and commissioning support to use that design. FMI forecasts a 14.8% CAGR for Saudi Arabia through 2036.
- Power availability at each Japanese site will influence how operators add higher-density computing. METI and MIC's June 2025 watt-bit framework connects data-center development with power and telecommunications planning [10]. A hybrid 800 VDC rack can allow an upgrade where AC capacity and row space permit it. FMI forecasts a 14.5% CAGR through 2036. Buyers need to test startup after maintenance and assess live connection and disconnection alongside module approval.
- U.S. operators with limited power capacity seek more computing from the megawatts available at a site. Berkeley Lab's June 2026 electricity usage update projects data centers at 11.8% of national electricity consumption by 2030, within a 9.5%-15.3% range [5]. Higher-voltage distribution can reduce conductor requirements and conversion losses. Demand for pre-charge follows orders for racks using those designs. FMI forecasts a 14.1% CAGR through 2036, with utility interconnection and protection approval affecting installation dates.
Who Are the Notable Companies in the 800VDC Rack Pre-Charge Modules Market?
Key companies covered by FMI include Sensata Technologies, Littelfuse and Eaton.
Sensata supplies dedicated pre-charge switching through its P105 family, rated to 1200 VDC, and lists data-center applications for selected GX contactors [15] [19]. Littelfuse offers HVDC contactors and protection products, including documented capacitive make tests for selected devices [20] [21] [22]. Eaton's role covers 800 VDC conversion and distribution architecture [12] [13]. Buyers therefore compare different parts of the power path. A dedicated rack pre-charge module needs product-specific evidence beyond Eaton's documented system architecture.
- High-Voltage Switching and Pre-Charge Components: Sensata Technologies documents dedicated pre-charge applications for its P Series MiniTACTOR products.
- DC Protection and Contactor Suppliers: Littelfuse combines HVDC contactors, fuses and protection products with data-center power-equipment coverage.
- 800 VDC Rack and System Architecture: Eaton integrates conversion, distribution, protection and rack power design for AI facilities.
Competitive Benchmarking
| Company | Pre-Charge / Inrush Switching Evidence | HVDC Protection Breadth | 800 VDC Data-Center Integration | Geographic Reach |
|---|---|---|---|---|
| Sensata Technologies | High | Medium | Medium | Global operations in 13 countries; data-center contactor products are documented |
| Littelfuse | Medium | High | Medium | More than 20 countries; industrial and electronics customers served globally |
| Eaton | Unscored | High | High | Customers in 180 countries; global AI data-center infrastructure program |
Scoring basis: Pre-Charge / Inrush Switching Evidence covers dedicated products and documented capacitive make tests. HVDC Protection Breadth assesses switching, fault interruption and circuit protection. 800 VDC Data-Center Integration covers explicit application or system evidence. High denotes direct documented capability, Medium relevant but narrower coverage, and Low a documented limitation. A criterion remains Unscored where public evidence is insufficient. Ratings describe capability without assigning supplier market shares.
Key Developments
- In July 2025, Eaton announced work with NVIDIA on 800 V HVDC infrastructure for 1 MW racks and beyond, covering reference architectures, design practices and power management [11].
- In October 2025, Littelfuse agreed to acquire Basler Electric to expand its data-center presence and high-power control and protection capabilities [24].
- In August 2026, NVIDIA described an MGX-compatible 800 VDC power rack for existing AC facilities and cited more than 80 ecosystem participants [2].
Key Players
High-Voltage Switching and Pre-Charge Components
- Sensata Technologies
DC Protection and Contactor Portfolio
- Littelfuse
800 VDC Rack and System Architecture Integration
- Eaton
Report Scope and Methodology
| Coverage field | Report scope |
|---|---|
| Market breakdown | Product Configuration; Nominal DC Voltage; Rack Power Density; Data Center Type; Route to Market |
| Quantitative Units | USD Million |
| Market Definition | Revenue includes dedicated 800VDC rack pre-charge modules and the identifiable pre-charge subassembly value inside rack-integrated, busway / distribution-integrated and prefabricated power cabinet configurations. Whole AI racks, power racks, cabinets and busways are excluded. Standalone contactors, resistors, fuses, breakers and converters sold without a pre-charge function are also excluded, as are unrelated software and service revenues. |
| Regions Covered | North America; Latin America; Western Europe; Eastern Europe; East Asia; South Asia and Pacific; Middle East and Africa |
| Countries Covered | USA; Saudi Arabia; UAE; South Korea; France; Japan |
| Key Companies Profiled | Sensata Technologies; Littelfuse; Eaton |
| Forecast Period | 2026 to 2036 |
| Approach | Primary and secondary research with market triangulation. |
Research Methodology
| Method | Approach |
|---|---|
| Primary research | FMI's primary-research framework engages module makers, contactor and protection suppliers, power OEMs, EPCs, operators and procurement teams. Interviews examine startup tests, supplier approval, pricing, lead times and support needed for repeat orders. |
| Desk research | The analysis reviews LVDC technical papers, product specifications, AI infrastructure plans and company announcements. Evidence is assessed for date, geographic relevance and connection to the defined pre-charge function. |
| Market sizing and forecasting | The framework combines the baseline value with configuration, voltage, rack density, data center type and route to market. Forecasts consider rack adoption, construction phases, qualification time, component pricing and supply availability. |
| Data validation | Estimates are checked against public data, company activity and primary-research findings. Complete racks, standalone devices without a pre-charge function, unrelated services and overlapping revenue are excluded. Integrated designs contribute only identifiable pre-charge subassembly value. |
800VDC Rack Pre-Charge Modules Market by Segments
800VDC Rack Pre-Charge Modules Market segmented by Product Configuration:
- Rack-integrated assembly
- Standalone device/module
- Busway / distribution-integrated
- Prefabricated power cabinet
800VDC Rack Pre-Charge Modules Market segmented by Nominal DC Voltage:
- 750-850 VDC
- 600-749 VDC
- 851-1,000 VDC
- Above 1,000 VDC
800VDC Rack Pre-Charge Modules Market segmented by Rack Power Density:
- 250-500 kW
- Below 250 kW
- 501-750 kW
- Above 750 kW
800VDC Rack Pre-Charge Modules Market segmented by Data Center Type:
- Hyperscale AI data centers
- Colocation AI facilities
- Enterprise / sovereign AI
- HPC & research centers
800VDC Rack Pre-Charge Modules Market segmented by Route to Market:
- Power OEM direct
- Electrical EPC / system integrator
- Authorized distributor
- Retrofit / service channel
800VDC Rack Pre-Charge Modules Market by Region:
- North America
- United States
- Canada
- Latin America
- Brazil
- Mexico
- Argentina
- Chile
- Western Europe
- Germany
- France
- United Kingdom
- Italy
- Spain
- Benelux
- Nordics
- Eastern Europe
- Poland
- Czech Republic
- Romania
- Hungary
- East Asia
- China
- Japan
- South Korea
- South Asia and Pacific
- India
- ASEAN
- Australia and New Zealand
- Middle East and Africa
- GCC Countries
- South Africa
- Türkiye
- Israel
Research Sources and Bibliography
- [1] NVIDIA (2025, May 20). NVIDIA 800 VDC Architecture Will Power the Next Generation of AI Factories.
- [2] NVIDIA (2026, August 11). Why Scaling AI Compute Performance Requires a New Power Architecture.
- [3] Open Compute Project (2026, March 30). Data Center Facility - Low Voltage Direct Current Power Distribution.
- [4] Open Compute Project (2026, August 11). Powering the Next Era of AI: How Google, Microsoft and Nvidia Are Standardizing and Accelerating the Industry Transition to LVDC.
- [5] Lawrence Berkeley National Laboratory (2026, June). United States Data Center Energy Usage Report: 2025 Update.
- [6] Public Investment Fund (2025, May 12). HRH Crown Prince launches HUMAIN as global AI powerhouse.
- [7] OpenAI (2025, May 22). Introducing Stargate UAE.
- [8] Ministry of Science and ICT, Republic of Korea (2025, June 20). Ulsan AI Data Center Launch Sparks Dialogue on Advancing Korea into a Top-Three Global AI Power.
- [9] Élysée (2025, February 11). Make France an AI powerhouse.
- [10] Ministry of Economy, Trade and Industry, Japan (2025, June 12). Report 1.0 of the Public-Private Advisory Council on Watt-Bit Collaboration Published.
- [11] Eaton (2025, July 15). Eaton accelerates the transformation of data center infrastructure in the AI era with NVIDIA.
- [12] Eaton (2025, October 13). Eaton unveils next-generation architecture to advance 800 VDC power infrastructure for AI factories.
- [13] Eaton (2026, March 16). Eaton collaborates with NVIDIA to unveil the Eaton Beam Rubin DSX platform.
- Eaton (n.d.). Medium-voltage solid-state transformer.
- [15] Sensata Technologies (n.d.). P105 Series MiniTACTOR P105CDA.
- Sensata Technologies (2026, March 4). Sensata Technologies Launches FaultBreak Contactor to Advance EV Safety and Reliability.
- Sensata Technologies (2026, June 30). Sensata Technologies Introduces Active + Passive PyroFuse to Advance High-Voltage Safety.
- Sensata Technologies (2026, July 15). Sensata Technologies to Release Second Quarter 2026 Financial Results on July 29, 2026.
- [19] Sensata Technologies (n.d.). GX26 Series 600A, 24VDC Coil, NO 48-inch Leads GX26CA.
- [20] Littelfuse (2026, January 26). DCNHE400 Series Product Datasheet.
- [21] Littelfuse (2026, March 23). DCNHE20 Series Product Datasheet.
- [22] Littelfuse (2024, July 31). DCNEVT400 Series Product Datasheet.
- Littelfuse (n.d.). Data Center Solutions Application Guide.
- [24] Littelfuse (2025, October 28). Littelfuse to Acquire Basler Electric, Enhancing High-Growth Industrial Market Positioning.
- Littelfuse (2026, May 14). Littelfuse to Host 2026 Investor Day Today.
This bibliography is provided for reader reference and is not exhaustive. The full report contains the complete reference list and detailed citations.
This Report Answers
- How large is the 800VDC Rack Pre-Charge Modules Market in 2026 and what value is forecast for 2036?
- Which AI data center power pressures are supporting demand for 800VDC rack pre-charge modules?
- Why does Rack-integrated assembly hold the leading position in Product Configuration?
- Why does the 750-850 VDC band lead Nominal DC Voltage?
- How do growth rates differ across the six profiled countries?
- Which profiled companies supply relevant switching, protection and 800 VDC system capabilities?
- What qualification issues can slow adoption or supplier switching?
- What should buyers evaluate before purchasing an 800VDC rack pre-charge module?
Frequently Asked Questions
How big is the 800VDC Rack Pre-Charge Modules Market in 2026, and what is forecast for 2036?
Sales of 800VDC rack pre-charge modules total USD 418.4 Million in 2026, according to FMI. Revenue will reach USD 1,678.0 Million by 2036 as higher-voltage racks require controlled startup.
What is the CAGR of the 800VDC Rack Pre-Charge Modules Market from 2026 to 2036?
As per FMI, sales will grow at a 14.9% CAGR from 2026 to 2036. Rack purchasing and completion of system qualification will determine the timing of module orders.
Which Product Configuration segment leads the 800VDC Rack Pre-Charge Modules Market?
Rack-integrated assembly will lead with 31.0% of product configuration demand in 2026. Buyers can test startup inside the complete power system and reduce field wiring interfaces.
Which Nominal DC Voltage segment leads the 800VDC Rack Pre-Charge Modules Market?
750–850 VDC will hold 49.0% of nominal DC voltage demand in 2026. The band fits emerging designs around the 800 VDC operating class.
Which profiled countries have the highest growth rates in the 800VDC Rack Pre-Charge Modules Market?
France will grow fastest at 15.8% through 2036, followed by South Korea at 15.4% and the UAE at 15.1%. These CAGRs compare growth pace rather than market size.
Which companies are active in the 800VDC Rack Pre-Charge Modules Market?
Sensata Technologies, Littelfuse and Eaton are among the companies covered by FMI. Their documented roles span dedicated pre-charge switching, HVDC protection and 800 VDC system architecture.
Preview the report firsthand - request a free sample
Get SampleGet the brochure for pricing and purchase details.
Get PDFTable of Content
- Key Takeaways
- Market Size and CAGR
- Top Growth Driver
- Fastest Growing Segment
- Leading Region
- Key Companies
- Emerging Opportunities
- Executive Summary
- Global Market Outlook
- Demand-side Trends
- Supply-side Trends
- Technology Roadmap Analysis
- Analysis and Recommendations
- Analyst Perspective (What is happening? Why now? What should investors know?)
- Key Questions Answered
- How large is the market?
- What is the CAGR?
- What are key trends?
- Which region dominates?
- Who are the leaders?
- Market Overview
- Market Coverage / Taxonomy
- Market Definition / Scope / Limitations
- Research Methodology
- Chapter Orientation
- Analytical Lens and Working Hypotheses
- Market Structure, Signals, and Trend Drivers
- Benchmarking and Cross-market Comparability
- Market Sizing, Forecasting, and Opportunity Mapping
- Research Design and Evidence Framework
- Desk Research Programme (Secondary Evidence)
- Expert Input and Fieldwork (Primary Evidence)
- Tooling, Models, and Reference Databases
- Data Engineering and Model Build
- Quality Assurance and Audit Trail
- Market Background
- Market Dynamics (Drivers, Restraints, Opportunity, Trends)
- Scenario Forecast (Optimistic, Likely, Conservative)
- Impact Analysis
- AI Impact
- Sustainability Impact
- Regulatory Impact
- Technology Impact
- Consumer / Buyer Analysis
- Purchase Drivers
- Adoption Barriers
- Buyer Journey
- Opportunity Map Analysis
- Product Life Cycle Analysis
- Supply Chain Analysis
- Investment Feasibility Matrix
- Value Chain Analysis
- PESTLE and Porter's Analysis
- Regulatory Landscape
- Regional Parent Market Outlook
- Production and Consumption Statistics
- Import and Export Statistics
- Global Market Analysis and Forecast, 2021 to 2036
- Historical Market Size Value (USD Million) Analysis, 2021 to 2025
- Current and Future Market Size Value (USD Million) Projections, 2026 to 2036
- Y-o-Y Growth Trend Analysis
- Absolute $ Opportunity Analysis
- Global Market Pricing Analysis, 2021 to 2036
- Global Market Analysis and Forecast, By Product Configuration, 2021 to 2036
- Introduction / Key Findings
- Historical Market Size Value (USD Million) Analysis By Product Configuration, 2021 to 2025
- Current and Future Market Size Value (USD Million) Analysis and Forecast By Product Configuration, 2026 to 2036
- Rack-integrated assembly
- Standalone device/module
- Busway / distribution-integrated
- Prefabricated power cabinet
- Y-o-Y Growth Trend Analysis By Product Configuration, 2021 to 2025
- Absolute $ Opportunity Analysis By Product Configuration, 2026 to 2036
- Global Market Analysis and Forecast, By Nominal DC Voltage, 2021 to 2036
- Introduction / Key Findings
- Historical Market Size Value (USD Million) Analysis By Nominal DC Voltage, 2021 to 2025
- Current and Future Market Size Value (USD Million) Analysis and Forecast By Nominal DC Voltage, 2026 to 2036
- 750-850 VDC
- 600-749 VDC
- 851-1,000 VDC
- Above 1,000 VDC
- Y-o-Y Growth Trend Analysis By Nominal DC Voltage, 2021 to 2025
- Absolute $ Opportunity Analysis By Nominal DC Voltage, 2026 to 2036
- Global Market Analysis and Forecast, By Rack Power Density, 2021 to 2036
- Introduction / Key Findings
- Historical Market Size Value (USD Million) Analysis By Rack Power Density, 2021 to 2025
- Current and Future Market Size Value (USD Million) Analysis and Forecast By Rack Power Density, 2026 to 2036
- 250-500 kW
- Below 250 kW
- 501-750 kW
- Above 750 kW
- Y-o-Y Growth Trend Analysis By Rack Power Density, 2021 to 2025
- Absolute $ Opportunity Analysis By Rack Power Density, 2026 to 2036
- Global Market Analysis and Forecast, By Data Center Type, 2021 to 2036
- Introduction / Key Findings
- Historical Market Size Value (USD Million) Analysis By Data Center Type, 2021 to 2025
- Current and Future Market Size Value (USD Million) Analysis and Forecast By Data Center Type, 2026 to 2036
- Hyperscale AI data centers
- Colocation AI facilities
- Enterprise / sovereign AI
- HPC & research centers
- Y-o-Y Growth Trend Analysis By Data Center Type, 2021 to 2025
- Absolute $ Opportunity Analysis By Data Center Type, 2026 to 2036
- Global Market Analysis and Forecast, By Route to Market, 2021 to 2036
- Introduction / Key Findings
- Historical Market Size Value (USD Million) Analysis By Route to Market, 2021 to 2025
- Current and Future Market Size Value (USD Million) Analysis and Forecast By Route to Market, 2026 to 2036
- Power OEM direct
- Electrical EPC / system integrator
- Authorized distributor
- Retrofit / service channel
- Y-o-Y Growth Trend Analysis By Route to Market, 2021 to 2025
- Absolute $ Opportunity Analysis By Route to Market, 2026 to 2036
- Global Market Analysis and Forecast, By Region, 2021 to 2036
- Introduction
- Historical Market Size Value (USD Million) Analysis By Region, 2021 to 2025
- Current Market Size Value (USD Million) Analysis and Forecast By Region, 2026 to 2036
- North America
- Latin America
- Western Europe
- Eastern Europe
- East Asia
- South Asia and Pacific
- Middle East and Africa
- Market Attractiveness Analysis By Region
- North America Market Analysis and Forecast, By Country, 2021 to 2036
- Historical Market Size Value (USD Million) Trend Analysis By Market Taxonomy, 2021 to 2025
- Market Size Value (USD Million) Forecast By Market Taxonomy, 2026 to 2036
- By Country
- United States
- Canada
- By Product Configuration
- By Nominal DC Voltage
- By Rack Power Density
- By Data Center Type
- By Route to Market
- By Country
- Market Attractiveness Analysis
- By Country
- By Product Configuration
- By Nominal DC Voltage
- By Rack Power Density
- By Data Center Type
- By Route to Market
- Key Takeaways
- Latin America Market Analysis and Forecast, By Country
- Historical Market Size Value (USD Million) Trend Analysis By Market Taxonomy, 2021 to 2025
- Market Size Value (USD Million) Forecast By Market Taxonomy, 2026 to 2036
- By Country
- Brazil
- Mexico
- Argentina
- Chile
- By Product Configuration
- By Nominal DC Voltage
- By Rack Power Density
- By Data Center Type
- By Route to Market
- By Country
- Market Attractiveness Analysis
- By Country
- By Product Configuration
- By Nominal DC Voltage
- By Rack Power Density
- By Data Center Type
- By Route to Market
- Key Takeaways
- Western Europe Market Analysis and Forecast, By Country
- Historical Market Size Value (USD Million) Trend Analysis By Market Taxonomy, 2021 to 2025
- Market Size Value (USD Million) Forecast By Market Taxonomy, 2026 to 2036
- By Country
- Germany
- France
- United Kingdom
- Italy
- Spain
- Benelux
- Nordics
- By Product Configuration
- By Nominal DC Voltage
- By Rack Power Density
- By Data Center Type
- By Route to Market
- By Country
- Market Attractiveness Analysis
- By Country
- By Product Configuration
- By Nominal DC Voltage
- By Rack Power Density
- By Data Center Type
- By Route to Market
- Key Takeaways
- Eastern Europe Market Analysis and Forecast, By Country
- Historical Market Size Value (USD Million) Trend Analysis By Market Taxonomy, 2021 to 2025
- Market Size Value (USD Million) Forecast By Market Taxonomy, 2026 to 2036
- By Country
- Poland
- Czech Republic
- Romania
- Hungary
- By Product Configuration
- By Nominal DC Voltage
- By Rack Power Density
- By Data Center Type
- By Route to Market
- By Country
- Market Attractiveness Analysis
- By Country
- By Product Configuration
- By Nominal DC Voltage
- By Rack Power Density
- By Data Center Type
- By Route to Market
- Key Takeaways
- East Asia Market Analysis and Forecast, By Country
- Historical Market Size Value (USD Million) Trend Analysis By Market Taxonomy, 2021 to 2025
- Market Size Value (USD Million) Forecast By Market Taxonomy, 2026 to 2036
- By Country
- China
- Japan
- South Korea
- By Product Configuration
- By Nominal DC Voltage
- By Rack Power Density
- By Data Center Type
- By Route to Market
- By Country
- Market Attractiveness Analysis
- By Country
- By Product Configuration
- By Nominal DC Voltage
- By Rack Power Density
- By Data Center Type
- By Route to Market
- Key Takeaways
- South Asia and Pacific Market Analysis and Forecast, By Country
- Historical Market Size Value (USD Million) Trend Analysis By Market Taxonomy, 2021 to 2025
- Market Size Value (USD Million) Forecast By Market Taxonomy, 2026 to 2036
- By Country
- India
- ASEAN
- Australia and New Zealand
- By Product Configuration
- By Nominal DC Voltage
- By Rack Power Density
- By Data Center Type
- By Route to Market
- By Country
- Market Attractiveness Analysis
- By Country
- By Product Configuration
- By Nominal DC Voltage
- By Rack Power Density
- By Data Center Type
- By Route to Market
- Key Takeaways
- Middle East and Africa Market Analysis and Forecast, By Country
- Historical Market Size Value (USD Million) Trend Analysis By Market Taxonomy, 2021 to 2025
- Market Size Value (USD Million) Forecast By Market Taxonomy, 2026 to 2036
- By Country
- GCC Countries
- South Africa
- Türkiye
- Israel
- By Product Configuration
- By Nominal DC Voltage
- By Rack Power Density
- By Data Center Type
- By Route to Market
- By Country
- Market Attractiveness Analysis
- By Country
- By Product Configuration
- By Nominal DC Voltage
- By Rack Power Density
- By Data Center Type
- By Route to Market
- Key Takeaways
- Key Countries Market Analysis
- United States
- Pricing Analysis
- Market Share Analysis, 2025
- By Product Configuration
- By Nominal DC Voltage
- By Rack Power Density
- By Data Center Type
- By Route to Market
- Canada
- Pricing Analysis
- Market Share Analysis, 2025
- By Product Configuration
- By Nominal DC Voltage
- By Rack Power Density
- By Data Center Type
- By Route to Market
- Mexico
- Pricing Analysis
- Market Share Analysis, 2025
- By Product Configuration
- By Nominal DC Voltage
- By Rack Power Density
- By Data Center Type
- By Route to Market
- Brazil
- Pricing Analysis
- Market Share Analysis, 2025
- By Product Configuration
- By Nominal DC Voltage
- By Rack Power Density
- By Data Center Type
- By Route to Market
- Chile
- Pricing Analysis
- Market Share Analysis, 2025
- By Product Configuration
- By Nominal DC Voltage
- By Rack Power Density
- By Data Center Type
- By Route to Market
- Germany
- Pricing Analysis
- Market Share Analysis, 2025
- By Product Configuration
- By Nominal DC Voltage
- By Rack Power Density
- By Data Center Type
- By Route to Market
- United Kingdom
- Pricing Analysis
- Market Share Analysis, 2025
- By Product Configuration
- By Nominal DC Voltage
- By Rack Power Density
- By Data Center Type
- By Route to Market
- Italy
- Pricing Analysis
- Market Share Analysis, 2025
- By Product Configuration
- By Nominal DC Voltage
- By Rack Power Density
- By Data Center Type
- By Route to Market
- Spain
- Pricing Analysis
- Market Share Analysis, 2025
- By Product Configuration
- By Nominal DC Voltage
- By Rack Power Density
- By Data Center Type
- By Route to Market
- France
- Pricing Analysis
- Market Share Analysis, 2025
- By Product Configuration
- By Nominal DC Voltage
- By Rack Power Density
- By Data Center Type
- By Route to Market
- India
- Pricing Analysis
- Market Share Analysis, 2025
- By Product Configuration
- By Nominal DC Voltage
- By Rack Power Density
- By Data Center Type
- By Route to Market
- ASEAN
- Pricing Analysis
- Market Share Analysis, 2025
- By Product Configuration
- By Nominal DC Voltage
- By Rack Power Density
- By Data Center Type
- By Route to Market
- Australia and New Zealand
- Pricing Analysis
- Market Share Analysis, 2025
- By Product Configuration
- By Nominal DC Voltage
- By Rack Power Density
- By Data Center Type
- By Route to Market
- China
- Pricing Analysis
- Market Share Analysis, 2025
- By Product Configuration
- By Nominal DC Voltage
- By Rack Power Density
- By Data Center Type
- By Route to Market
- Japan
- Pricing Analysis
- Market Share Analysis, 2025
- By Product Configuration
- By Nominal DC Voltage
- By Rack Power Density
- By Data Center Type
- By Route to Market
- South Korea
- Pricing Analysis
- Market Share Analysis, 2025
- By Product Configuration
- By Nominal DC Voltage
- By Rack Power Density
- By Data Center Type
- By Route to Market
- Poland
- Pricing Analysis
- Market Share Analysis, 2025
- By Product Configuration
- By Nominal DC Voltage
- By Rack Power Density
- By Data Center Type
- By Route to Market
- Hungary
- Pricing Analysis
- Market Share Analysis, 2025
- By Product Configuration
- By Nominal DC Voltage
- By Rack Power Density
- By Data Center Type
- By Route to Market
- Türkiye
- Pricing Analysis
- Market Share Analysis, 2025
- By Product Configuration
- By Nominal DC Voltage
- By Rack Power Density
- By Data Center Type
- By Route to Market
- South Africa
- Pricing Analysis
- Market Share Analysis, 2025
- By Product Configuration
- By Nominal DC Voltage
- By Rack Power Density
- By Data Center Type
- By Route to Market
- UAE
- Pricing Analysis
- Market Share Analysis, 2025
- By Product Configuration
- By Nominal DC Voltage
- By Rack Power Density
- By Data Center Type
- By Route to Market
- Saudi Arabia
- Pricing Analysis
- Market Share Analysis, 2025
- By Product Configuration
- By Nominal DC Voltage
- By Rack Power Density
- By Data Center Type
- By Route to Market
- United States
- Market Structure Analysis
- Competition Dashboard
- Competition Benchmarking
- Market Share Analysis of Top Players
- By Regional
- By Product Configuration
- By Nominal DC Voltage
- By Rack Power Density
- By Data Center Type
- By Route to Market
- Emerging Startups
- Innovation Benchmarking
- Competition Analysis
- Competition Deep Dive
- Sensata Technologies
- Overview
- Product Portfolio
- Profitability by Market Segments
- Sales Footprint
- Strategy Overview
- Marketing Strategy
- Product Strategy
- Channel Strategy
- Littelfuse
- Eaton
- Sensata Technologies
- Case Studies
- Success Stories
- Recent Developments
- Competition Deep Dive
- Assumptions & Acronyms Used


